Effects of Nitrogen Deposition on Forest Ecosystems
REPOR
T 5067
Effects of Nitrogen Deposition
on Forest Ecosystems
REPORT 5067
isbn 91-620-5067-2 issn 0282-7298
Editors
Ulla Bertills and Torgny Näsholm
Effects of Nitrogen Deposition
on Forest Ecosystems
SWEDISH ENVIRONMENTAL PROTECTION AGENCY
Increased atmospheric deposition of nitrogen has
affected the forest ecosystems of Sweden and many other
countries. Many of Sweden’s forests are characterized by a
limited natural supply of this nutrient. Although nitrogen
deposition is on the whole much lower in Scandinavia than
in the rest of Europe, the region’s ecosystems are more
sensitive to it. There is therefore every reason to seek to
safeguard these ecosystems against elevated deposition
of nitrogen.
This report summarizes the present state of knowledge
concerning the effects of nitrogen on soil, trees and
for-est flora. It also describes current and expected future
levels of nitrogen deposition, international and national
environmental objectives, critical loads, and how forest
ecosystems recover when nitrogen inputs are reduced.
Effects of Nitrogen Deposition
on Forest Ecosystems
k
EditorsUlla Bertills
Torgny Näsholm
Environmental Assessment Department Environmental Impacts Section Contact: Ulla Bertills, telephone +46 8 698 15 02 The authors assume sole responsibility for the contents of this report,
which therefore cannot be cited as representing the views of the Swedish Environmental Protection Agency. The report has been submitted to external referees for review.
Production: Margot Wallin Translation: Martin Naylor
Cover photograph: Chickweed wintergreen. Photographer: Torbjörn Lilja/N The diagrams in this report have been redrawn by Johan Wihlke
Address for orders:
Swedish Environmental Protection Agency Customer Services
SE-106 48 Stockholm, Sweden Telephone: +46 8 698 12 00 Fax:+46 8 698 15 15 E-mail: kundtjanst@environ.se Internet: www.environ.se Bookstore: www.miljobokhandeln.com isbn 91-620-5067-2 issn 0282-7298
PREFACE
The purpose of this report is to describe our present under-standing of the effects of atmospheric nitrogen deposition on forests and forest soils. It is based on research carried out in the Swedish Environmental Protection Agency’s project area ACIDIFYING SUBSTANCESAND TROPOSPHERIC OZONE. By setting
the results of this research in an international context, we wish to present the knowledge that now exists regarding nitrogen deposition and its effects, and to describe the contribution which our project area has made to this knowledge. Most of the work within the project area was undertaken with funding from the Environmental Protection Agency’s research allocation. When this allocation was discontinued, financial responsibility was taken over by the Swedish Foundation for Strategic Environmental Research (MISTRA), which thus provided support for the concluding phase of the work and the final reports.
We would like to express our sincere thanks to all the research-ers who have contributed to this report, and in particular to Peringe Grennfelt for providing the questions in the ‘Questions and answers’ sections.
Thanks are also due to Margot Wallin and Johan Wihlke at the Environmental Protection Agency for their painstaking work on the layout of the report and the diagrams, and to Martin Naylor for his excellent translation.
ULLA BERTILLS & TORGNY NÄSHOLM
Earlier reports from the project area
ACIDIFYING SUBSTANCESAND TROPOSPHERIC OZONE:
GROUND-LEVEL OZONE – A THREATTO VEGETATION
Swedish Environmental Protection Agency Report 4970 EDITOR: HÅKAN PLEIJEL
(Swedish version: Report 4969)
RECOVERYFROM ACIDIFICATIONINTHE NATURAL ENVIRONMENT.
PRESENT KNOWLEDGEAND FUTURE SCENARIOS
Swedish Environmental Protection Agency Report 5034 EDITORS: PER WARFVINGEAND ULLA BERTILLS
C
ONTENTSEXECUTIVESUMMARY 7
CHAPTER 1. THENITROGENPROBLEMINHISTORICALPERSPECTIVE 9
• Tryggve Persson
CHAPTER 2. INTERNATIONALNEGOTIATIONSANDNATIONAL 13
ENVIRONMENTALOBJECTIVES
• Ulla Bertills & Peringe Grennfelt
CHAPTER 3. NITROGENDEPOSITIONNOWANDINTHEFUTURE 21
• Gun Lövblad
CHAPTER 4. HOWARETHENITROGENDYNAMICSOFFORESTSOILS 29
AFFECTED?
• Peter Högberg, Göran Bengtsson, Dan Berggren, Mona Högberg, Ingvar Nilsson, Hans-Örjan Nohrstedt, Tryggve Persson & Michael Sjöberg
CHAPTER 5. HOWAREFORESTTREESAFFECTED? 53
• Torgny Näsholm, Hans-Örjan Nohrstedt, Ola Kårén, Maarit Kytö & Christer Björkman
CHAPTER 6. DOESNITROGENDEPOSITIONCHANGETHEFLORA? 77
• Ursula Falkengren-Grerup, Lars Ericson,Urban Gunnarsson, Annika Nordin, Håkan Rydin & Bo Wallén
CHAPTER 7. CRITICALLOADS 105
• Hans-Örjan Nohrstedt & Ulla Bertills
CHAPTER 8. WHATHAPPENSWHENNITROGENDEPOSITION 115
DECREASES?
• Maud Quist, Dan Berggren, Tryggve Persson & Richard Wright
CHAPTER 9. HOWARESOILSANDPLANTSAFFECTEDBYNITROGEN 127
DEPOSITION? – A SYNTHESIS
• Torgny Näsholm & Tryggve Persson
AUTHORS’ ADDRESSES 137
E
XECUTIVE
SUMMARY
M
any forest ecosystems in Sweden receive appreciable inputs of nitro-gen in the form of atmospheric deposition resulting from human activi-ties. Nitrogen deposition is an international problem, since emissions in one country often give rise to effects in another. Of the current deposition of nitro-gen oxides in Sweden, some 85% originates from emissions in other countries, and for ammonia the corresponding figure is 65%.International agreements have been entered into to curb emissions of both nitrogen oxides and ammonia. Deposition of nitrogen currently exceeds what are known as ‘critical loads’ with respect to eutrophication throughout south-ern Sweden. Furthermore, there is much to suggest that emissions of nitrogen – and particularly of ammonia – will remain high over the coming decade. Envir-onmental research to improve our understanding of how these emissions affect forests is therefore crucial.
Nitrogen is a very important plant nutrient, and in most cases its availability
is a major limiting factor for growth in forest ecosystems. Most of the nitro-gen supplied to a forest by deposition ends up in the soil, where it is rapidly taken up and turned over by plants and micro-organisms. In moderate amounts, deposition of nitrogen can above all increase biological activity, and often growth. However, plants and micro-organisms do not have an unlim-ited capacity to absorb this element. Large inputs, in fertilizers or deposition, will result in the biological capacity for nitrogen retention being exceeded. In an ecosystem in which such a surplus of nitrogen exists, the excess can easily be leached from the soil, polluting ground and surface waters.
Nitrogen deposition causes eutrophication (nutrient enrichment) of the forest ecosystem, with the result that organisms adapted to a severe nitrogen limitation are replaced by others which are more competitive at higher levels of nitrogen.
To enhance our understanding of the effects nitrogen deposition is having and has had on forests, several experiments have been carried out in which nitrogen has been applied to forest ecosystems. From these studies, mainly involving coniferous forests, the following results have emerged:
• The quantities of nitrogen in soil are increasing, and there is a long-term risk of nitrogen saturation and hence increased leaching of nitrogen into lakes and watercourses. Forest soils in southern Sweden have a large capacity to retain nitrogen and, what is more, retention increases with the scale of deposition. The carbon/nitrogen ratio of the soil is an important factor affecting nitrogen retention. European experiments have revealed a clearly increased risk of ni-trogen leaching at C/N ratios of less than 25. High deposition of nini-trogen may also result in an increased release of carbon from bogs.
• Trees are not damaged even by relatively high levels of nitrogen. However, additions of nitrogen do cause a number of changes to their biochemistry and structure, which can in turn make them more sensitive to frost, drought, in-sect attack or fungal infection, for example. There is no evidence in the litera-ture, though, of clear changes in trees’ resistance to such stress factors.
• The flora of deciduous forests subjected to nitrogen inputs shows a marked shift towards more nitrophilous species. In severely nitrogen-limited conifer-ous forests, even small doses of nitrogen rapidly produce a distinct effect, in that growth of grasses is promoted at the expense of bilberry. In such forests, the species composition of mycorrhizal fungi also changes dramatically. Ni-trogen deposition results in there being fewer mushrooms and berries to pick in these forests.
• When nitrogen deposition decreases, the nutrient status of trees rapidly shifts in the direction of nitrogen limitation. The soil pool of inorganic nitrogen decreases rapidly, as does leaching of nitrate. Thus, several of the serious ad-verse effects of nitrogen deposition are read-versed relatively quickly when depo-sition abates. However, ground- and field-layer vegetation respond more slowly, and a similar inertia probably applies to other components of the forest ecosystem. It could conceivably take a long time for species which have de-clined significantly as a result of nitrogen deposition to recolonize a site.
To understand and predict the effects of nitrogen deposition on forest eco-systems, we have to have recourse to experimental studies of various kinds. At the same time, it has to be admitted that experiments provide only fragmen-tary knowledge. Many nitrogen fertilization experiments have been relatively small-scale. What is more, most of the experiments conducted were not set up specifically to study the consequences of atmospheric inputs of nitrogen, but primarily to investigate forest productivity. These studies have consequently covered a relatively narrow range of forest types and, furthermore, they have involved patterns of nitrogen application which do not tally very closely with atmospheric deposition. Given all these factors, we are not in a very good position to predict the effects of nitrogen deposition.
Many European countries have considerably higher deposition levels than Sweden, and there leaching of nitrogen from forest soils is a very major en-vironmental problem. In Sweden, deposition of nitrogen has not caused the same problems, and many Swedish forest ecosystems have evolved with a se-vere nitrogen limitation. The organisms inhabiting them are thus adapted to meagre supplies of nitrogen and some will therefore probably decline or dis-appear altogether as a result of deposition. The only way of preventing this is to reduce emissions of nitrogen as rapidly as possible.
T
HE
NITROGEN
PROBLEM
IN
HISTORICAL
PERSPECTIVE
TRYGGVE PERSSON
V
iews of nitrogen (chemical symbol N), which is an essential constituent of the proteins and nucleic acids of cells, have changed dramatically in recent decades. For most of human history, plant-available forms of this element have been in short supply. This is the case in forested areas, too: at our latitudes, nitrogen is usually the limiting factor for the growth of forest trees. After the Second World War, the use of artificial fertilizers rose sharply, and emissions of nitrogen oxides from motor ve-hicles and industrial processes also increased. As a result, far more nitro-gen than before was brought into circulation. Nitronitro-gen was therefore no longer simply a factor of production; in certain respects, it also became an environmental problem.From the middle of the 1980s, nitrogen began to be seen as one of the most problematic of pollutants, in the light of mounting evidence that excess amounts of it could have adverse effects. These effects included:
• infants becoming ill as a result of high nitrate levels in drinking water,
• lakes, rivers and streams suffering eutrophication and becoming choked with plant growth,
• blooms of toxic algae,
• increased formation of ozone due to nitrogen oxides, harming plants and human health,
• intensification of the greenhouse effect and damage to the ozone layer at high altitudes, caused by emissions of nitrous oxide,
• effects on biodiversity, and
• incipient nitrogen saturation and declining productivity of forest land (Cowling et al. 1998).
In many cases, atmospheric deposition of nitrogen took the place of sul-phur deposition as the chief focus of environmental concern. However, nitrogen and nitrogen deposition differ in several respects from sulphur and sulphur deposition. An input of nitrogen not only tends to boost tree productivity; it affects virtually every organism in the forest ecosystem. It therefore changes far more processes in this ecosystem than an input of sulphur. This report describes some of the effects of nitrogen deposition
that have been studied more closely. A number of these effects are clearly detrimental, such as increased leaching of nitrate or reduced forest growth at very high levels of nitrogen. Others need to be described in detail be-fore it can be established whether or not they represent a threat. In a few cases, deposition of nitrogen has consequences that can be regarded as either desirable or undesirable, depending on one’s point of view. In areas where nitrogen is the growth-limiting factor, deposition of this element stimulates forest growth, and such an effect is of course welcome to the owners of forests. It can also be regarded as beneficial in terms of binding more carbon dioxide in plant biomass and hence reducing net emissions of this greenhouse gas to the atmosphere. At the same time, there is cause for concern if nitrogen deposition affects the vascular plant and macro-fungal floras of the forest floor in such a way as to reduce their species richness.
Our understanding of how nitrogen is cycled and how it affects the natural environment is based on research that began in the days of Carl Linnaeus. Table 1.1 presents some of the milestones in the history of ni-trogen research.
One of the first breakthroughs in thinking in this area came when Liebig showed that, in addition to sunlight and water, plants needed min-eral salts to grow, and not what Linnaeus referred to as ‘humus’. Other breakthroughs followed when microbiologists began to understand how nitrogen could be converted from one form to another. A further advance in thinking occurred when scientists began to discover that certain plants, chiefly those with mycorrhizas, were able to take up nitrogen even though it was not present in a mineral form. Liebig’s conclusions thus had to be partly revised. In recent years, Näsholm and co-workers (1998), among others, have shown that several forest plants are able to take up simple forms of organic nitrogen (amino acids) in the field. The suspicion that roots with mycorrhizas can take up organic nitrogen has, however, existed since the 19th century.
In Sweden, the long-term forest experiments established by Carl Olof Tamm and his successors have played a major part in developing our un-derstanding of how nitrogen inputs affect forests and soils (Helmisaari & Helmisaari 1992), but also of how nitrogen cycling itself is affected by dif-ferent treatments, such as nitrogen fertilization, experimental acidifica-tion, liming, applications of ash, whole-tree harvesting and clear felling. Some of the experiments that have generated most knowledge are listed in table 1.2 overleaf. Many of the results which form the core of this report stem from these experiments.
TABLE 1.1. Milestones in nitrogen research. Sources: Stålfelt 1960 and others.
YEAR DISCOVERYORIDEA
1747 LINNAEUS launches the idea that plants live on the humus formed by
the decomposition of plants and animals (the theory of humus).
1840 JUSTUSVON LIEBIG shows that growth of agricultural crops is
depend-ent on the salts presdepend-ent in the soil.
1862 Microbiologist LOUIS PASTEUR suggests that nitrification (formation of nitrate) is a biological process.
1876 Forest researcher E. EBERMAYER shows that forest trees need mineral salts.
1885 A. B. FRANK proposes that plants with mycorrhizas should be able to take up organic nitrogen from forest soils (see also below).
1920–40 Forest researchers H. HESSELMANN, L.-G. ROMELL and C. MALMSTRÖM show by fertilization experiments that nitrogen is the limiting factor for forest growth.
1946 A. G. NORMAN writes that it should be possible to use the stable isotopes 13C and 15N to quantify various transformations of nitrogen.
1950–60 The forest researchers C. O. TAMM in Sweden and P. J. VIRO in Finland set up fertilization experiments involving varying doses of nitrogen, phosphorus, potassium and other nutrients. Some of these experiments are still in progress.
1958 Using 15N techniques, S.-L. JANSSON shows that soil micro-organisms
utilize ammonium in preference to nitrate.
1985–86 D. READ’S research group (BAJWA, ABUZINADAH et al.) in Sheffield show that members of the heath family with ericoid mycorrhizas and trees with ectomycorrhizas can take up organic nitrogen.
1993 F. S. CHAPIN et al. show that organic nitrogen can also be taken up by non-mycorrhizal sedges in Arctic environments.
International emission abatement agreements have achieved cuts in emissions of nitrogen compounds, both reduced (ammonia/ammonium) and oxidized (nitrogen oxides/nitrate), and will bring about further re-ductions in the years ahead. However, as yet we do not know how far-reaching the environmental effects of these decreases will be. One possi-bility is that they will result in a less marked nutrient imbalance in forest trees and recovery in terms of biodiversity in affected areas of Sweden. Another possibility is that their effects will be more limited, since soils have already been ‘charged’ with nitrogen.
The chapters that follow will shed light on the effects of nitrogen depo-sition on forest ecosystems. An account will be given of how nitrogen deposition has changed over time, what happens to deposited nitrogen
once it has entered the soil, how it affects trees and other vegetation, and what happens when nitrogen inputs are reduced. It is our hope that this report will provide a fair picture of the current state of knowledge and hence provide a basis for effective action to tackle the nitrogen problem.
TABLE 1.2. Long-term experiments at Swedish forest sites which shed light on the effects of nitrogen on tree growth, nutrient status, soil chemistry, soil biology, leaching, and cycling of carbon and nitrogen. Examples of other questions which they answer are given in the table. N1, N2 and N3 refer to increasing doses of ni-trogen fertilizer, with N1 averaging between 30 and 40 kg of nini-trogen per hectare per year. Source: Nohrstedt et al. 1999.
EXPERIMENT BEGAN TREATMENTS QUESTIONSANSWERED
Stråsan 1967 N1, N2, N3 combined Effects of nutrient
combina-(Norway spruce) with P, K, PK and tions. Critical loads.
CaPK Recovery processes.
Norrliden 1971 N1, N2, N3 combined Significance of nutrient
(Scots pine) with P, K, PK; CaCO3, combinations. Critical loads.
acidification Recovery. Effects of liming.
Flakaliden 1987 Solid fertilizer, irrigation, Effects of increased
tempera-(Norway spruce) irrigation with fertilization, ture and CO2 concentrations.
warming, CO2 Maximum tree productivity
with no nitrate leaching. Asa 1987 Solid fertilizer, irrigation, Maximum tree productivity
(Norway spruce) irrigation with fertilization with no nitrate leaching. Skogaby 1988 Solid fertilizer, irrigation, Effects of supraoptimal N/S
(Norway spruce) irrigation with fertilization, fertilization on trees and
drought, ash soils. Effects of irrigation,
drought, ash, N-free fertilizers.
Gårdsjön 1989 Roof experiment Effects of decreased/
(Norway spruce) (low deposition) increased deposition. 1991 Application of 15N fertilizer
Farabol 1976 N fertilization, CaCO3, Post-felling effects of
(Norway spruce) S powder followed by clear additions of lime, acid and
felling N fertilizer.
Hasslöv 1984 Different doses of dolomite Effects of liming N-rich soils
I
NTERNATIONAL
NEGOTIATIONS
AND
NATIONAL
ENVIRONMENTAL
OBJECTIVES
ULLA BERTILLSAND PERINGE GRENNFELT
I
t has long been recognized that nitrogen oxides and ammonia are transported across national frontiers in a similar way to sulphur. The role of nitrogen compounds as a factor in acidification and behind changes in the structure and functioning of ecosystems was also elucidated at an early stage. Not until the mid-1980s, though, did the countries of Europe begin to show any real interest in acting on this knowledge.At the international level, nitrogen compounds have primarily received attention in the framework of the Convention on Long-Range Trans-boundary Air Pollution (CLRTAP). In addition, atmospheric transport and deposition of nitrogen compounds have been addressed under the marine environment conventions relating to the Baltic (HELCOM) and the North Sea (OSPAR). The European Community/European Union has also high-lighted the nitrogen problem, initially through its Large Combustion Plants Directive, adopted in 1988, and through various directives in the area of road transport. In recent years, nitrogen compounds have been addressed as part of the EU’s strategies on acidification and tropospheric ozone.
Convention on Long-Range Transboundary Air Pollution
Following initiatives from Sweden and other countries, international negotiations were launched with the aim of reducing pollutant emissions to the atmosphere. They resulted in an agreement, the Convention on Long-Range Transboundary Air Pollution, being drawn up in 1979 under the auspices of the United Nations Economic Commission for Europe (UNECE). This Convention came into force in 1983.
The first protocol to reduce emissions of nitrogen oxides was signed in 1988. This protocol proved a fairly undemanding agreement, its objective being merely to ensure that 1994 emissions were no higher than 1987 lev-els. On the other hand, it did receive quite broad support, with a total of 26 signatories. Twelve of the countries concerned, including Sweden, signed a separate agreement declaring their intention of reducing emis-sions by 30% by 1998, from the level prevailing during a year of their choice between 1980 and 1986.
Despite the modest requirement laid down in the 1988 protocol, i.e. that emissions should not increase up to 1994, several countries (seven, according to the statistics) had difficulty meeting it. As for the countries that pledged a 30% reduction, the outcome has proved even more dis-couraging: probably not even half of them have attained their more ambi-tious target. Overall, however, European emissions of nitrogen oxides are falling and, according to available statistics (EMEP 1999), they have been reduced by almost 20% since 1987. Over the same period, Sweden’s emis-sions have decreased by around 35%.
Ammonia – European emissions of which are of the same order of mag-nitude as those of nitrogen oxides (calculated in tonnes of nitrogen) – was not dealt with at all in the 1988 protocol. Several countries have neverthe-less taken steps to curb agricultural losses of nitrogen to both air and soil. According to the statistics, these measures reduced emissions by about 20% between 1987 and 1996.
After a second sulphur protocol, based on critical loads, had been signed in 1994, negotiations began on a new protocol relating to nitro-gen. From the outset, it became clear that the parties to the Convention had widely differing priorities when it came to reducing nitrogen oxide emissions. Most of the countries on the continent saw high ozone levels as the main reason for taking action, while the Nordic countries were prima-rily concerned about nitrogen’s role in acidification and eutrophication. Some countries referred to high urban concentrations of nitrogen dioxide as the key argument for a protocol.
In addition, the countries involved considered it imperative that critical loads and cost-effective action should remain the guiding principles for the negotiations. Since it was not easy to distinguish the contributions of nitrogen oxides to different effects, it was felt that the only viable ap-proach was to try to develop a protocol that would take into account both a range of effects (acidification, eutrophication, and the effects of ground-level ozone on vegetation and health) and a number of different sub-stances (nitrogen oxides, ammonia, volatile organic compounds and sul-phur dioxide). The agreement that has since been negotiated under the Convention reflects this approach and has accordingly been described as a ‘multi-pollutant, multi-effect’ protocol. The Protocol to Abate Acidifica-tion, Eutrophication and Ground-level Ozone, as it is officially known, was signed in Göteborg, Sweden, on 1 December 1999 and is expected to reduce European emissions of sulphur by 63%, nitrogen oxides by 41%, volatile organic compounds by 40% and ammonia by 17% by 2010, com-pared with 1990 levels (UNECE 1999).
TABLE 2.1. Protocols relating to sulphur, nitrogen and ground-level ozone, entered into under the Convention on Long-Range Transboundary Air Pollution.
PROTOCOL UNDERTAKING(S) BASEYEAR TARGET RATIFIED
YEAR
First Sulphur 30% reduction of sulphur 1980 1993 1987
Protocol 1985 emissions. (21 states)
NOx Protocol Nitrogen oxide emissions 1987 1994 1991
1988 to be frozen at base year level (26 states)
(12 countries declared in a separate agreement that they would reduce emissions by 30% by 1998 from a base year chosen from the period 1980–86).
VOC Protocol 30% reduction of 1984–90, 1999 1997
1991 emissions of volatile to be (17 states)
organic compounds. chosen by
signatories
Second Sulphur Difference between actual 1990 2000 1998
Protocol 1994 sulphur deposition and critical (22 states)
loads to be reduced by 60%.
Multi-Effect Emission ceilings for 1990 2010
Protocol 1999 SO2, NOx , NHx and VOCs.
Marine environment conventions
The part played by nitrogen in marine eutrophication appeared on the agendas of the marine environment conventions at an early stage. Within both HELCOM and OSPAR, decisions were taken in the mid-1980s to halve anthropogenic inputs of nitrogen to the sea areas covered by these conventions by 1995. In principle, these commitments applied to all sources, i.e. atmospheric deposition as well as runoff and direct dis-charges. All the inventories and measurements carried out show that the 50% reduction target has definitely not been met, and, as the previous sec-tion made clear, the countries have fallen far short of it as far as ammonia and nitrogen oxides are concerned.
At a meeting of the OSPAR Commission in 1998, a Strategy to Com-bat Eutrophication was adopted, with the aim of eliminating all eutrophi-cation due to human activities by the year 2010.
EU efforts to reduce emissions of nitrogen compounds
To date, European Community/European Union efforts to reduce emis-sions of nitrogen oxides have resulted in directives targeted on (new) large combustion plants and on cars and heavy vehicles.
As was mentioned above, a directive to limit emissions of nitrogen ox-ides from large combustion plants (with a rated thermal input of 50 MW or more) was adopted in 1988. The directive was aimed at new plants (built after 1987) and is expected to have reduced emissions from installa-tions of this type by around 30% between 1980 and 1998. A proposal for a new directive, imposing more stringent standards on new plants, has been presented. The problem, however, is that it does not include stand-ards for existing combustion plants.
The biggest source of nitrogen oxide emissions is the transport sector. In 1990, road transport was responsible for around half of EC emissions of this pollutant. The Community decided in 1989 to introduce emission standards for passenger cars, of the type that had long existed in the United States. These standards, which only became binding in 1993, will bring about a gradual reduction of emissions, as old vehicles are replaced with new. Their practical consequence was that all cars began to be fitted with catalytic converters. The standards have since been tightened up, chiefly by a decision taken in 1998, which will impose more rigorous
quirements on vehicles from 2000 and 2005. For heavy vehicles, standards corresponding largely to those in place in the US were introduced in 1996. Combined, the measures decided on will gradually reduce emissions of nitrogen oxides across the territory of the EU. There is considerable un-certainty, though, about the ultimate effect of the various standards.
In 1995 Sweden suggested that a special strategy should be developed to solve the problem of acidification – i.e. to reduce deposition to below critical loads – throughout the EU. Such a strategy was presented in spring 1997. A corresponding strategy has been drawn up for tropo-spheric ozone.
In June 1999, as a result of the strategies on acidification and ozone, the European Commission put forward a draft directive proposing ‘na-tional emission ceilings’ for the year 2010 for sulphur dioxide, nitrogen oxides, ammonia and volatile organic compounds. The Commission’s proposal will entail significant emission cuts for many countries. The aim is to promote cost-effective action that will reduce by at least 50%, in all parts of Europe, the area in which critical loads are exceeded. However, the proposed cuts will not be sufficient to bring deposition to below critical load levels in the most sensitive areas of south-west Sweden, for example.
Since the majority of nitrogen deposition in Sweden can be attributed to sources outside its borders, active efforts to achieve further progress within the EU and CLRTAP remain the most important line of attack on this problem.
National environmental objectives and measures
Although emissions in other countries account for a dominant share of nitrogen deposition in Sweden, further reductions of Swedish emissions are still important, not only with a view to reducing disturbance of the environment in this country, but also because a proportion of Sweden’s emissions are exported.
To plan action that will lead in the direction of sustainable develop-ment, we need estimates of the changes that are required in our society. One way of achieving such estimates is to adopt national environmental objectives.
• NATIONAL ENVIRONMENTALOBJECTIVES
In 1990, national emission targets for both nitrogen oxides and ammonia were adopted in Sweden (Government Bill 1990/91, p. 25, JoU 30, rskr 338):
A 30% REDUCTIONIN NITROGEN OXIDEEMISSIONS BY 1995, compared
with 1980 levels.
A 25% REDUCTION IN AMMONIA EMISSIONS BY 1995. In addition, the
feasibility of halving emissions in southern and western Götaland (southern Sweden) was to be looked into.
The nitrogen oxides target was achieved in 1997, whereas ammonia emissions have not fallen, but in fact increased by 20%.
In April 1999 the Swedish Parliament adopted 15 new environmental quality objectives, including goals relating both to eutrophication and to acidification (Swedish Environmental Protection Agency 2000):
NOEUTROPHICATION: Nutrient levels in soil and water must not cause
ad-verse effects on human health, the prerequisites for biological diversity or versatile land and water use.
NATURALACIDIFICATIONONLY: The acidifying effects of acid deposition and
land use must not exceed limits that can be tolerated by land and water. In addition, deposition of acidifying substances must not accelerate the cor-rosion of technical materials or cultural artefacts and buildings.
The Government proposed a number of more specific intermediate goals, and in addition some twenty government agencies were commis-sioned to develop additional intermediate goals and sectoral targets, and to propose courses of action and specific measures to achieve them. In October 1999 the agencies’ proposals were submitted to an all-party advi-sory committee, the Environmental Objectives Committee, which has the task of weighing together the various submissions and presenting a final set of recommendations on intermediate goals and action strategies to the Government in June 2000. The intermediate environmental quality ob-jectives that are formulated are intended to guide the selection of appro-priate measures.
• MEASURES
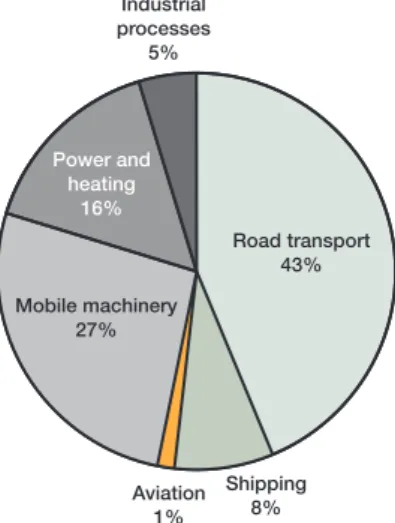
Action on nitrogen emissions will reduce the effects of this pollutant in terms of both acidification and eutrophication. Of Sweden’s total emissions of nitrogen oxides, the majority come from various forms of transport.
Figure 2.1. Swedish emissions of nitrogen oxides to air, 1998. The figures for shipping and aviation refer to emissions from fuels used in domestic traffic only.
The main focus of action in Sweden has been on achieving better exhaust gas treatment and cleaner fuels for road vehicles. All cars from 1989 mod-els on are required to be fitted with catalytic converters. Emission stand-ards for lorries and buses were introduced in 1993.
With the legislation and regulations already adopted, and on the basis of predicted trends, it is estimated that emissions of nitrogen oxides could be reduced by just over 40% between 1995 and 2010. Emissions from road transport are expected to fall by 70% and from shipping by 50%. The meas-ures already decided on will bring
about significant reductions in nitro-gen oxide emissions, but will not be sufficient to meet the environmental objectives that have been set.
The most important source of
am-monia emissions is livestock
produc-tion, an area in which reductions have proved difficult to achieve. Almost 90% of Sweden’s emissions of ammonia come from the farming sector.
Figure 2.2. Swedish emissions of ammonia to air, 1997. Industrial processes 5% Road transport 43% Mobile machinery 27% Shipping 8% Aviation 1% Power and heating 16%
Source: Statistiska meddelanden, Mi 18
Source: Statistiska meddelanden, Mi 37
Farmyard manure 77% Grazing livestock 9% Industrial and energy production 3% Others 2% Road transport 6% Artificial fertilizers 3%
The main priority must therefore be to cut agricultural emissions of am-monia, particularly in the south of Sweden. The principal means of achiev-ing reductions are expected to be improved methods for the storage and application of animal manure and urine.
The international negotiations in progress within the EU and CLRTAP and the current work on environmental objectives in Sweden will provide guidance as to what reductions in national nitrogen emissions are required and what action needs to be taken.
Information about protocols, emissions and deposition levels can be found at the following Web sites:
Convention on Long-Range Transboundary Air Pollution: www.unece.org/env/ lrtap
Data on emissions, transport and deposition: www.emep.int
Models and estimates of measures required across Europe: www.iiasa.ac.at Data on concentrations and deposition levels in Sweden: www.ivl.se/env_data.htm
QUESTIONSANDANSWERS
Are critical loads for acidification the key determinant of the scale of action needed to combat nitrogen deposition?
No, not in general. The level of action required is determined, rather, by the eutrophication effects of nitrogen.
Will the measures already decided on or planned be sufficient to eliminate the effects of
excessive nitrogen deposition?
If the national emission ceilings proposed in the EU are implemented, emissions of nitrogen oxides and ammonia in the EU area are expected to fall by 55% and 20%, respectively, compared with 1990 levels. The Multi-Effect Protocol (Protocol to Abate Acidification, Eutrophication and Ground-level Ozone) will cut deposition of oxidized nitrogen by just over 40% and of reduced nitrogen by just under 20%, for Europe as a whole. These measures will not be sufficient to eliminate the adverse effects of nitrogen deposition in Sweden.
N
ITROGEN
DEPOSITION
NOW
AND
IN
THE
FUTURE
GUN LÖVBLAD
Current deposition levels
A
tmospheric deposition of nitrogen provides a significant nutrient put to both terrestrial and marine ecosystems, an input that has risen substantially since the 1950s. After the Second World War, strong economic growth resulted in an appreciable increase in the use of fossil fuels, while emissions from the transport sector spiralled. Figure 3.1 shows how emissions of nitrogen oxides and ammonia have developed in Sweden. Similar trends have been seen in all the countries of Europe, and the sum total of the resultant long-range transport of air pollutants is reflected, inter alia, in the field data that have been recorded as part of Sweden’s environmental monitoring programme.Since the 1950s, emissions of nitrogen compounds, and above all nitrogen oxides, have increased in Sweden and the rest of Europe, with the result that deposition of both oxidized and reduced compounds of nitrogen in Sweden has shown a steady rise. In the last few years, however, a slight downward trend in wet deposition of nitrogen has been observed (see figure 3.2a). The same trend can be seen in concentrations in precipitation, and this is being investi-gated in more detail in a study in progress for the environmental monitoring programme (figure 3.2b) (K. Sjöberg, IVL, and others).
Data on current levels of nitrogen deposition in Sweden are now available on the Internet. The Web site of the Swedish Environmental Research Insti-tute (IVL) (www.ivl.se) provides field data from the EMEP network, the precipitation chemistry network and regional forest plots. Deposition data calculated using the MATCH model (Persson et al. 1996, Robertson et al. 1999) can be found on the site maintained by the Swedish Meteorological and Hydrological Institute, SMHI (www.smhi.se). The maps presented on that site show a breakdown of estimated nitrogen deposition into oxidized and reduced nitrogen compounds, wet and total deposition of nitrogen, and dry deposition to land in different land use categories.
Figures 3.3 and 3.4 below show wet and total deposition of oxidized nitrogen (nitrate) and reduced nitrogen (ammonium) in Sweden. The maps illustrate the prevailing pattern of deposition across the country, which is affected on the one hand by gradients of pollutant concentrations in precipitation and air, on the other by climatic parameters, such as precipitation totals and prevailing wind directions.
Thousand tonnes 500 400 300 200 100 0 1900 1910 1920 1930 1940 1950 1960 1970 1980 1990 kg N/ha/yr 1950 1960 1970 1980 1990 2000 1950 1960 1970 1980 1990 2000 µeq/l 45 40 35 30 25 20 15 10 5 0 NO3 -NH4+ NO3 -NH4+ 4.5 4.0 3.5 3.0 2.5 2.0 1.5 1.0 0.5 0.0 NH3 NOX Figure 3.1. Emissions of nitrogen oxides and ammonia in Sweden (Kindbom et al. 1993). Figure 3.2a. Wet deposition of nitrate- and ammonium-nitrogen in southern central Sweden, 1955–98 (kg N/ha/yr). (Data from Department of Meteorology, Stockholm University, and IVL.) Figure 3.2b. Mean nitrate and ammonium concentrations (µeq/l) in precipitation over southern central Sweden, 1955–98.
WET (mg N/m2) 25 - 50 50 - 100 100 - 150 150 - 200 200 - 300 300 - 500 500 - 700 WET (mg N/m2) 25 - 50 50 - 100 100 - 150 150 - 200 200 - 300 300 - 500 500 - 700 Figure 3.3. Wet and total deposition of nitrate, 1997. 100 mg N/m2 corresponds to 1 kg/ha (SMHI, IVL). Figure 3.4. Wet and total deposition of ammonium, 1997. 100 mg N/m2 corresponds to 1 kg/ha (SMHI, IVL). TOTAL (mg N/m2 ) 50 - 100 100 - 150 150 - 200 200 - 300 300 - 500 500 - 700 700 - 1 000 TOTAL (mg N/m2 ) 50 - 100 100 - 150 150 - 200 200 - 300 300 - 500 500 - 700 700 - 1 000
The highest deposition levels occur in Skåne and the west coast region, primarily on higher ground, where total deposition, averaged over a large area, amounts to 5–7 kg of nitrate-nitrogen per hectare per year (0.5–0.7 g N/m2/yr) and over 8 kg of ammonium-nitrogen per hectare per year
(0.8 g N/m2/yr). Deposition is high in the south-west of Sweden because
the region is affected by the major emission sources in western Europe and because the prevailing precipitation-bearing winds here are south-westerly. A large proportion of deposition in upland areas occurs in rain and snow. Further north, total deposition of nitrogen decreases to around 2–3 kg per hectare per year. In southern Sweden as a whole, dry deposi-tion makes up 25–50% of the total atmospheric input of nitrogen com-pounds, whereas in the north it accounts for an appreciably smaller pro-portion than wet deposition. However, there are wide variations between individual sites in the south of the country, and the highest levels of dry deposition occur on forest land exposed to heavy nitrogen loads.
The nitrogen deposited originates from emissions of nitrogen oxides and ammonia. Nitrogen oxide emissions are primarily produced by com-bustion processes in engines and boilers, as a result of atmospheric nitro-gen and oxynitro-gen reacting at high temperatures. Ammonia is released in conjunction with livestock production, when manure is stored and applied to fields. In general, nitrogen oxides spread further than ammonia. This is because, once emitted, nitrogen oxides need to undergo further oxidation to nitrogen compounds with high deposition velocities before efficient deposition can take place. Reduced nitrogen already has a high deposition velocity in the form in which it is emitted (ammonia). However, any am-monia that is not deposited in the vicinity of its source reacts with acid gases and particles in the air to form very fine aerosols of ammonium salts. These aerosols disperse over large distances (more than 1000 km), to-gether with nitrate and sulphate ions, and have a comparatively long at-mospheric residence time.
On average, roughly equal quantities of nitrogen are deposited in the ni-trate and ammonium forms in Sweden. In southern areas where ammonia emissions are high, deposition of reduced nitrogen predominates, while in northern parts of the country nitrate deposition prevails. The sources of the nitrogen deposition occurring in Sweden are shown in table 3.1.
In the case of nitrogen oxides, Sweden’s own emissions account for be-tween 10% and 20% of total deposition. Germany, Britain and other EU member states provide major contributions, together accounting for around 60% of the total in southern parts of the country and some 35% in the north. The EU countries are thus far and away the dominant source of
inputs of oxidized nitrogen to Swedish ecosystems, and an EU strategy to reduce nitrogen oxide emissions should therefore be of great significance from Sweden’s point of view.
As for ammonium deposition, domestic emissions make the largest contribution to the total, 25–45% in the south of the country and 10–20% in the north. Other countries accounting for large shares are Denmark, Germany and Poland, which are all neighbours of Sweden. Domestic
TABLE 3.1. Countries of origin of the nitrogen deposited in different areas of Sweden (from EMEP/MSC-W 1998).
BLE- KRONO- WEST STOCK- S NORR- N NORR -NITROGEN KINGE BERG COAST HOLM LAND LAND
OXIDES % % % % % % Sweden 9 11 13 17 16 13 Baltic states 2 9 1 4 2 4 Norway 1 2 4 3 11 6 Germany 25 21 19 19 12 9 UK 11 15 19 8 9 6 Denmark 8 9 8 4 4 3 Other EU 14 15 15 14 12 16 Poland 10 6 4 9 6 4 Czech Republic 2 4 2 2 2 1 Other E Europe 4 3 2 6 4 6 Sea areas 5 4 4 4 3 2 Known 91 91 91 90 81 70 origin Unknown 9 9 9 10 19 30 origin AMMONIA Sweden 44 34 25 22 17 10 Denmark 15 16 13 6 4 4 Norway 1 1 0 1 10 4 Baltic states 2 2 4 8 5 5 Germany 10 13 17 14 8 7 UK 4 4 2 3 3 2 Other EU 8 10 9 11 7 13 Poland 4 6 14 11 8 7 Other E Europe 4 5 6 10 6 8 Known 92 91 90 86 68 60 origin Unknown 8 9 10 14 32 40 origin
measures to reduce emissions of ammonia will have a far greater effect in Sweden than corresponding efforts to curb nitrogen oxide emissions.
There are considerable variations in deposition across the country. The maps on p. 23 show mean deposition in 11x11 km squares with mixed land use. In reality, local variations are much greater than the maps indi-cate, since land use has such a marked impact on the scale of dry deposi-tion. Over large areas of southern Sweden, the total deposition of nitro-gen to forests is estimated to be 1.5 to 2 times the wet deposition. On open sites, total deposition is estimated to be roughly equal to wet deposi-tion. To calculate deposition in particular areas, it is necessary to have data on concentrations of nitrogen compounds in both air and precipitation, local precipitation totals, and land use.
A more detailed account of temporal and spatial variations in deposi-tion in Sweden, and of the contribudeposi-tions of different deposideposi-tion processes, can be found in Lövblad et al. 1995.
Future deposition trends
Future trends in deposition will depend on the effectiveness of action to re-duce air pollutant emissions. To assess how ecosystems will develop on a long time-scale, long-term forecasts of emission trends are needed. At present, however, reliable predictions cannot be made beyond the year 2010.
In the light of expected changes in emissions (see chapter 2), future deposition levels can be estimated using EMEP model calculations (EMEP/MSC-W 1998). The emission cuts that can be achieved in the framework of current plans and national objectives constitute the ‘refer-ence scenario’ (REF J) for the pollution situation in 2010. The WGS sce-nario, drawn up in conjunction with the Multi-Effect Protocol, reflects the expected results of that protocol. Assuming the national emission ceil-ings planned by the EU are implemented, deposition in the year 2010 can be estimated on the basis of the EU H1 scenario.
Table 3.2 shows the changes in deposition that can be expected by 2010, compared with 1990, under the REF J, Multi Effect Protocol and EU H1 scenarios.
By the year 2010, under the three scenarios, deposition of oxidized nitrogen (nitrate) is expected to have fallen considerably, to around 2.5 kg of nitrogen per hectare per year in southern parts of the country and just under 1␣ kg in the north. This represents an overall decrease from 1990 levels of 50–60% in southern Sweden, and 40–50% in the north. Deposi-tion of reduced nitrogen (ammonium) is expected to have decreased by 15–20% compared with 1990, to around 3 kg of nitrogen per hectare per
SCENARIO DEPO- BLE- KRONO- WEST STOCK- S NORR- N NORR
-SITION KINGE BERG COAST HOLM LAND LAND
TOTAL N Ref. (J) 2010 5.55 5.93 5.18 3.78 1.54 1.31 % of 1990 66 60 65 68 64 66 Multi-Effect 2010 5.73 5.92 5.18 3.80 1.56 1.31 Prot. (WGS 31b) % of 1990 68 60 65 68 65 66 EU Ceilings 2010 5.20 5.36 4.80 3.54 1.47 1.25 Dir. (H1) % of 1990 62 54 60 63 61 63 NOx Ref. (J) 2010 2.35 2.69 2.54 2.08 0.89 0.84 % of 1990 51 44 51 57 54 59 Multi-Effect 2010 2.35 2.56 2.54 2.08 0.89 0.84 Prot. (WGS 31b) % of 1990 51 42 51 57 54 59 EU Ceilings 2010 2.44 2.35 2.35 1.94 0.85 0.80 Dir. (H1) % of 1990 53 39 47 53 51 56 NH3 Ref. (J) 2010 3.20 3.24 2.64 1.70 0.65 0.47 % of 1990 85 84 86 87 88 85 Multi-Effect 2010 3.38 3.36 2.64 1.72 0.67 0.47 Prot. (WGS 31b) % of 1990 89 87 86 88 91 85 EU Ceilings 2010 2.76 3.01 2.45 1.60 0.62 0.45 Dir. (H1) % of 1990 73 78 80 82 84 82
year in the south of Sweden and roughly 0.5 kg in northern areas. These figures refer to mean deposition over large areas with mixed land use. In forested areas, deposition will be somewhat higher.
Provided that current reduction plans are implemented, the environ-mental situation will improve appreciably, creating a basis for ecosystem recovery.
TABLE 3.2. Estimated deposition levels (kg N/ha/yr) in different regions of Swe-den in the year 2010: mean values over large areas and comparisons with 1990. Based on EMEP model calculations (EMEP/MSC-W 1998).
Is deposition of nitrogen decreasing in Sweden? Yes, probably. Measurements of am-monium and nitrate concentrations in precipitation suggest a downward trend. An evaluation of trends is cur-rently in progress within the environ-mental monitoring programme, and this will determine the statistical sig-nificance of observed trends. Meas-urements of Swedish urban air reveal an appreciable fall in concentrations of nitrogen dioxide, of the order of 30–50%, depending on the location, size and local emissions of the town or city concerned. Decreases can also be observed in other European coun-tries, reflecting the emission reduc-tions now being achieved, primarily thanks to rapidly increasing use of catalytic converters.
According to available inventory data, European emissions of nitrogen oxides fell by around 20% between 1990 and 1996. There are also data pointing to a similar reduction of am-monia emissions.
What proportions of oxidized and reduced nitrogen are
present in deposition? In Sweden, the ratio of nitrate to am-monium concentrations in precipi-tation is virtually 1:1. In the case of dry deposition, the proportions vary, with higher deposition of reduced nitrogen in the vicinity of agricultural areas.
How much of the nitrogen deposited in Sweden comes from other countries? Non-Swedish sources account for around 85% of deposition of oxidized nitrogen compounds in Sweden. In the case of reduced nitrogen, domes-tic sources are more significant, ac-counting for some 35% of the total for the entire country. These figures, based on balances for 1998 calculated by EMEP, apply to Sweden as a whole.
Will current plans result in nitrogen deposition in Sweden falling
below critical load levels? No. In the areas currently exposed to the highest deposition levels, deposi-tion will remain in excess of critical loads even when the measures now planned have been implemented. This is particularly true of forests, heaths and mires in Skåne, Halland, Blekinge, Bohuslän and adjacent areas of Småland (southern and south-west Sweden).
H
OW
ARE
THE
NITROGEN
DYNAMICS
OF
FOREST
SOILS
AFFECTED
?
PETER HÖGBERG, GÖRAN BENGTSSON, DAN BERGGREN,
MONA HÖGBERG, INGVAR NILSSON, HANS-ÖRJAN NOHRSTEDT,
TRYGGVE PERSSONAND MICHAEL SJÖBERG
N
itrogen is the nutrient which plants need in the largest quantities, and in many ecosystems, such as temperate forests, its availability is normally the limiting factor for plant production. The supply of nitrogen also regulates many complex interactions within ecosystems, including in-teractions between different trophic levels. For this reason, a nitrogen-limited ecosystem differs radically from one that is nitrogen-saturated. The dynamics of nitrogen in the soil system are complex, but crucial to an understanding of this element’s role in the ecosystem.Increased availability of nitrogen, resulting for example from atmospheric deposition, can have a number of undesirable effects. Excess nitrogen is leached from the system, chiefly as nitrate, leading to pollution of groundwater and eutrophication of coastal sea areas. The nitrate leached out is accompanied by positively charged ‘counter-ions’, such as hydrogen and aluminium ions, which cause acidification of the receiving system, or the base cations calcium, potassium and magnesium, resulting in acidifica-tion of the leached soil. Nitrate can also be given off as nitrous oxide, N2O, which can cause depletion of the ozone layer. Since nitrogen availability is generally the limiting factor for production, it also has a direct bearing on an ecosystem’s ability to bind atmospheric carbon dioxide, and hence on the problem of climate change. In this chapter we discuss how nitrogen deposi-tion provides an addideposi-tion to the natural nitrogen cycle, and how this affects the soil system in particular. The chapter focuses to a large extent on the re-lationship between dose (level of nitrogen deposition) and response (eco-system effects, chiefly in terms of leaching of nitrogen), and on differences between different forest ecosystems in this context.
NITROGENSATURATION
A discussion is currently under way on how the concept of nitrogen saturation should be defined.
One alternative, based on the chemical notion of saturation, defines a nitrogen-saturated ecosystem as one where losses of nitrogen are equal in magnitude to inputs. The advantage of this definition is that it is strict and not open to different interpretations. A possible disadvan-tage is that it does not cover situations in which the supply of nitrogen is elevated (and harmful to certain organisms); however, such states can be described using other terms (Binkley & Högberg 1997). Another definition broadens the concept to include systems in which an elevated level of nitrogen leaching can be observed, i.e. an in-crease compared with a given natural background level. This ap-proach has the advantage that it draws attention to the effects of nitrogen deposition at an early stage. The disadvantages are that the chemical definition of saturation is abandoned, that it is difficult to establish an obvious limit value, and that transient and natural states (e.g. windthrow) may also fall within the scope of the definition. Yet another possibility is to define nitrogen saturation as a state in which the supply of nitrogen exceeds the nitrogen needs of plants and micro-organisms. This definition focuses on the requirements of or-ganisms in the ecosystem, but clearly says nothing about the extent to which nitrogen is being leached from the system (Aber et al. 1989). We have chosen here to adopt the first definition, and to use expres-sions such as ‘an elevated supply of nitrogen’ to describe states in which nitrogen availability is above the natural background, but losses of nitrogen are not equal to inputs.
Deposition has increased nitrogen pools
Nitrogen rarely occurs in soil minerals and therefore, unlike calcium, phosphorus and other elements, it is not generally supplied to the soil by weathering. Historically (up to a hundred years ago), most nitrogen has been incorporated in ecosystems by biological fixation (nitrogen gas from the atmosphere, N2, is reduced by certain bacteria, alone or in symbiosis with plants, to ammonia, which then binds to carbon chains to form amino acids). A small proportion of the nitrogen present in ecosystems is the result of fixation by lightning discharges. However, the current high
output of artificial fertilizers and nitrogen fixation by combustion pro-cesses in industry and the transport sector have doubled the annual global supply of nitrogen (Vitousek et al. 1997). Analyses of the Greenland ice sheet confirm that a modest, more or less stable background level of nitro-gen deposition has existed for thousands of years, but that a marked in-crease in deposition has occurred over the last few decades (Mayewski et
al. 1986).
The store of nitrogen present in our forests is the net result of inputs and losses over the 9000–12␣ 000 years that have elapsed since the last gla-ciation. Natural inputs of nitrogen (natural background deposition + bio-logical fixation) have probably amounted to 1–2 kg per hectare per year. This could potentially mean an accumulated input of some 10–20 tonnes of nitrogen per hectare since the last ice age. Usually, however, the nitro-gen pool is considerably smaller than this, probably mainly as a result of fires of varying frequency in coniferous forests (Zackrisson 1977), but also owing to leaching, chiefly of organic nitrogen compounds (Hedin et al. 1995).
The combined nitrogen pool of a forest ecosystem (in vegetation and in the soil down to a depth of 0.5 m) varies from roughly 1 tonne per hectare at low-fertility sites in northern Sweden to 10 tonnes per hectare in forests in the south of the country (Nohrstedt 1993). In exceptional cases, in pine forests on sites with extensive exposures of rock, the figure could probably be even lower, but no data are available for such sites. Higher values than 10 tonnes per hectare may also occur, chiefly in for-ests on drained peat (Holmen 1964), as a result of both smaller fire losses in these damp ecosystems and an influx of nitrogen from mineral soils at higher elevations. In general, stores (and turnover) of nitrogen increase below hill-slopes of significant size, owing both to a flux of ni-trogen from groundwater recharge to groundwater discharge zones, and to increased cycling – and probably also fixation – of nitrogen with rising moisture levels and pH. This results in considerable variations in forest productivity and the composition of the flora (Giesler et al. 1998, Hög-berg 2000).
Over the last 100 years, in the most exposed areas of southern Sweden, anthropogenic deposition has added an estimated 500–1000 kg per hec-tare to the nitrogen capital of ecosystems. It thus follows that the man-made input of nitrogen to forests in the south of the country corresponds to an increase of, at most, some 50–100% (the latter figure an estimate for pine forests in areas of exposed rock in the south-west) and, as a mini-mum, less than 5%.
Most nitrogen in soil is bound to humus
The majority, often more than 80–90%, of the nitrogen capital of Swedish forests is to be found in the soil (Nykvist 1977, Nohrstedt 1993). A significant quantity of this nitrogen occurs in the mor horizon of the podzols on which the forests grow, but surprisingly large amounts are also found in humic substances in the upper layers of mineral soil, particularly the illuvial (enriched) horizon. In simplified terms, the nitrogen present in the soil can be divided into a number of component pools (figure 4.1), which vary in size and turnover time. The dominant pool consists of nitro-gen bound to dead organic matter, chiefly humus, which is turned over very slowly, probably as slowly as the carbon to which it is bound – which would mean a turnover time of 20–100 years in the mor horizon and 200–500 or even 1000 years or more in the illuvial horizon (Tamm & Östlund 1960, Tamm & Holmen 1967). Another relatively large pool is more readily decomposed by micro-organisms and can be described as the slow-degrading pool, with turnover times of months to years (Binkley & Hart 1989). The nitrogen in micro-organisms such as bacteria and fungi is turned over more rapidly, on a time-scale of weeks to months (Binkley & Hart 1989). This pool makes up some 10% of the total store of nitro-gen in the upper, biologically most active layers of the soil (table 4.1). The shortest turnover times of all, just a day or so, are found in the case of the inorganic pools of ammonium and nitrate ions (Davidson et al. 1992, Hart et al. 1994), and probably also the pool of free organic nitrogen compounds, such as amino acids and proteins. This is chiefly true of soils with a severe nitrogen limitation; turnover is probably appreciably slower in ecosystems with large pools of ammonium and nitrate. Table 4.1 shows, by way of illustration, the sizes of different nitrogen pools in the mor horizon of a nitrogen-limited coniferous forest in northern Sweden.
PLANTS
(years (leaves) – centuries (wood)) SOIL
Microbial nitrogen Free amino acids Ammonium Nitrate
(weeks–months) (days–weeks) (days–?) (days–?)
More readily degradable organic nitrogen compounds (months–years)
Very slow-degrading nitrogen compounds (e.g. nitrogen in humus) (centuries–millennia?)
Figure 4.1. Nitrogen in plants and soil can be divided into different pools (fractions), which vary in size and turnover time (shown in parenthesis).
Plants can also use organic nitrogen compounds
The cycling of nitrogen in soil is controlled to a large degree by biological processes. Traditionally, it has been held that plants can only take up inorganic forms of nitrogen (ammonium and nitrate), and that organic nitrogen compounds therefore only become available to them when they have been broken down into inorganic forms, i.e. mineralized. However, increasingly it has been discussed whether forest plants might in fact be able to assimilate simple organic nitrogen compounds, above all via their mycorrhizal fungi. This possibility is supported both by model experiments in the laboratory (Smith & Read 1997), and by the fact that, when samples of many acid forest soils with a high carbon/nitrogen (C/N) ratio are incubated in the laboratory, no net mineralization occurs for several weeks or months (Persson 1995). Rough model estimates based on data from laboratory experiments on such soils indicate a large shortfall in calculated net nitrogen mineralization in relation to uptake by forest trees (Persson 1995). Very recently, moreover, the uptake of an intact amino acid, glycine, was demonstrated in the field for the first time (Näsholm et al. 1998).
Ammonium and nitrate pools in soil can be turned over in a day
By adding small quantities of ammonium labelled with nitrogen-15 to a soil, it is possible to monitor how quickly the labelled ammonium is diluted with unlabelled ammonium. This gross mineralization of nitrogen can be very rapid, even in a coniferous forest soil (Davidson et al. 1992, Hart et al. 1994). Studies of net mineralization show only the net production of mineral nitrogen, and do not reveal that the newly produced mineral nitrogen is rapidly and constantly being taken up by micro-organisms (and, in the natural environment, also by mycorrhizal roots). Studies of gross turnover show that soil pools of ammonium and nitrate are turned over in the space of just a day or so in soils where these pools
TABLE 4.1. Nitrogen pools in the mor horizon of a northern Swedish coniferous forest, expressed in kg N/ha (Näsholm et al. 1998).
Total store (mostly nitrogen bound to slow-degrading humus) 300
Nitrogen in micro-organisms 30
Extractable organic nitrogen (amino acids in the soil solution
and loosely bound to soil particles) 1 Extractable inorganic nitrogen (ammonium + nitrate in the
are small. With such short turnover times, it is possible that the mineralization process supplies trees with more inorganic nitrogen than net mineralization studies suggest. As yet, however, net and gross mineralization have not been compared in forest soils in which no net mineralization has been demonstrated. We are therefore unable to say anything very definite about the proportions of organic and inorganic nitrogen sources involved in nitrogen uptake by trees.
The uptake (assimilation) of inorganic nitrogen by micro-organisms, known as immobilization, is dependent on the micro-organisms having ac-cess to readily degradable carbon compounds (Hart et al. 1994, Kaye & Hart 1997). This is partly because the assimilation of inorganic nitrogen requires energy, and partly because this nitrogen has to be bound to a carbon compound to form an organic nitrogen compound (normally an amino acid). The carbon/nitrogen ratio of the soil is thus a key factor in the dynamics of nitrogen (see ‘Nitrogen retention and the carbon/nitrogen ratio’).
PROCESSESANDTERMS
Nitrogen mineralization (ammonification, nitrogen mobilization) is a
process that takes place primarily inside the cells of micro-organisms and soil animals. It may, for example, involve an amino acid being split into ammonia and a fatty acid. The ammonia is given off through the cell membrane and, in an acid environment, forms ammonium. The following simplified formula sums up the process of mineralization: Organic N → NH4+ + carbon compound
Nitrification:
Autotrophic nitrification = ammonium is oxidized by micro-organisms (via nitrite) to nitrate in two steps (while the energy released by oxidation is used to assimilate CO2):
2NH4+ + 3O2 → 2NO2- + 2H2O + 4H+ 2NO2- + O2 (from H2O) → 2NO3
-Heterotrophic nitrification = oxidation of ammonium/ammonia or an organic nitrogen compound to nitrate (the oxidation providing no energy for the nitrifying organisms), according to the following simplified formula:
Organic N → NO3
-Ion exchange:
Ions become bound to soil particles by electrostatic forces. These particles are usually negatively charged, and therefore ammonium (NH4+) is bound more strongly than nitrate (NO3
-
).Denitrification:
Nitrate is reduced to nitrous oxide and/or nitrogen gas in the pres-ence of a carbon source (which is oxidized), according to the follow-ing simplified formula:
NO3- → NO2- → NO → N2O → N2
Nitrate reduction (in plants or micro-organisms) is the reduction of
nitrate to nitrite (followed by reduction to ammonium and subse-quently assimilation into an amino acid).
Nitrogen immobilization:
Inorganic nitrogen is assimilated by soil micro-organisms. Inorganic nitrogen can also be immobilized chemically when nitrite binds to phenols or ammonia reacts with quinones.
Humus:
Collective term for highly decomposed and transformed organic matter, consisting of large molecules made up of combinations of aromatic rings and carbon chains of varying length.
Polyphenols:
Breakdown products of lignin, for example, consisting of aromatic rings, which do not degrade readily and which form part of humus molecules.
Quinones:
Aromatic rings formed from carbohydrates, polyphenols (lignin) and melanins (synthesized by micro-organisms), constituents of humus.
Mycorrhiza:
‘Fungus root’, symbiosis formed between plant roots and certain fungi. Most Swedish forest trees form ectomycorrhizas, consisting of a mantle of fungus around their roots and a network of hyphae penetrating both into the roots (between the cells) and out into the soil. The fungus obtains carbon from the tree, while enhancing the tree’s supplies of water, nitrogen, phosphorus etc.
Nitrogen-15 (15N):
Nitrogen atom with an extra neutron in its nucleus. Most nitrogen atoms (99.6%) have 7 protons and 7 neutrons in their nuclei (nitro-gen-14), but nitrogen-15 has 8 neutrons. This stable (non-radio-active) isotope is widely used in biological and ecological research. Since nitrogen-14 has an overwhelming predominance in nature, it is relatively easy to track added nitrogen-15 as it passes through an ecosystem.
Relationship between soil acidity and nitrogen availability
A statistical relationship exists between the acidity (pH) of a soil and the productivity of the plant community, and not least the trees, growing on it (for references, see Giesler et al. 1998). Many researchers have interpreted this as evidence that trees need large quantities of base cations (high con-centrations of base cations mean a high pH), and even that the supply of base cations (Ca, Mg, K) is a direct limiting factor for forest productivity (e.g. Sverdrup et al. 1992a, 1994). Acidification resulting from anthropo-genic deposition would thus reduce forest production in a very direct way. However, with the exception of potassium, trees’ base cation requirements are in fact relatively small (Linder 1995). Trees need considerably less cal-cium than nitrogen, but levels of calcal-cium do have a major impact on soil pH, and hence on the activity of soil micro-organisms.
Experimental forest research shows that, in most parts of Sweden (with the exception of a number of sites in the south-west, see Binkley & Högberg 1997), additions of nitrogen increase forest productivity, despite the fact that they usually also lower the pH of the soil. At the same time, experiments involving liming (which raises soil pH) demonstrate that forest productivity can fall as a result of increased microbial immobilization of ni-trogen (with the exception of a few cases in south-west Sweden). We can conclude from this that forest tree production is most commonly limited by a deficiency of nitrogen (once again, the exception being a small number of south-western sites). The strong correlation between soil pH and forest productivity can probably be attributed to the significance of pH for micro-bial turnover of nitrogen (Giesler et al. 1998), but it is not an effect that is achieved immediately after an application of lime (Högberg 1999). An in-teresting phenomenon in this context is that forest productivity increases in a regular manner with increasing distance down large hill-slopes. This rise in productivity parallels increases in pH and nitrogen availability that are linked to discharge of groundwater (Giesler et al. 1998, Högberg 2000).
Deposited nitrogen is first taken up
by micro-organisms and plants
Some of the nitrogen in precipitation is taken up directly by tree crowns and by field- and ground-layer vegetation, and therefore does not reach the ground straightaway. The remainder reaches the soil surface, together with the portion of the previously dry deposited nitrogen which is washed from foliage by the rain. This nitrogen consists of a mixture of different forms: ammonium and nitrate ions, amino acids, proteins, and nitrogen bound in