VTI notat 15A-2011 Published 2011
www.vti.se/publications.
Literature review on variable message sign
s
(VMS) 2006–2009
Preface
This study was initiated and financed by the Nordic Meeting for Improved Road Equipment (NMF). Hillevi Nilsson Ternström at the VTI Library and Information Centre assisted with the literature search. Sara Nygårdhs, VTI, has been the project leader and author of the literature study.
Linköping March 2011
Kvalitetsgranskning
Intern peer review har genomförts 2011-03-28 av Niklas Strand. Sara Nygårdhs har genomfört justeringar av slutligt rapportmanus 2011-04-01. Projektledarens närmaste chef, Jan Andersson, har därefter granskat och godkänt publikationen för publicering 2011-04-08.
Quality review
Internal peer review was performed on 28 March 2011 by Niklas Strand. Sara Nygårdhs has made alterations to the final manuscript of the report on 1 April 2011. The research director of the project manager Jan Andersson examined and approved the report for publication on 8 April 2011.
Table of Contents
Sammanfattning ... 5
Summary ... 7
1 Introduction ... 9
1.1 Background and Aim ... 9
1.2 Method and Limitations ... 9
1.3 List of Abbreviations ... 10
2 Design... 11
3 Compliance and Behaviour ... 15
4 Reducing Speed and Accidents ... 19
5 Use of VMS, New Systems and Technologies ... 24
6 Legibility ... 27
7 Recommendations ... 30
8 Discussion and Conclusions ... 32
Litteraturstudie om variabla meddelandeskyltar, VMS – åren 2006–2009 av Sara Nygårdhs
VTI
581 95 Linköping
Sammanfattning
Denna litteraturstudie initierades av Nordiskt Möte för Förbättrad vägutrustning (NMF) och är tänkt att vara ett uppdaterat komplement till den tidigare rapporten ”VMS – Variable Message Signs. A literature review” av Nygårdhs och Helmers, 2007.
Variabla meddelandeskyltar, VMS, kan användas på många olika sätt, till exempel för information gällande hastighet, restid, vägarbeten, köer, olyckor, körfältsbyte, väder, omledning och händelser. Under 2006–2009 har ett stort antal studier på VMS
genomförts, av vilka 61 stycken refereras i denna rapport. Huvudresultaten från dessa studier är:
Piktogram bör användas istället för textmeddelanden.
Antalet rader på en VMS bör vara så litet som möjligt med hänsyn till förståelse. Piktogram och texter på VMS ska utvärderas innan de används i praktiken. Typsnittet ”Tern” rekommenderas för användning i Europa.
Tvåspråkiga skyltar bör undvikas.
VMS som endast aktiveras vid fortkörning leder till minskad hastighet, det vill säga bättre efterlevnad.
Extrainformation i samband med en aktiverad VMS leder inte alltid till bättre efterlevnad.
Att läsa och bearbeta textmeddelanden på VMS leder till minskad hastighet. Gällande hastighetsbegränsning nonchaleras om den inte är motiverad av
trafiksituationen, vilket innebär att en VMS enbart bör aktiveras när situationen förvärras.
Det är väsentligt att en VMS fungerar korrekt och motsvarar verkliga förhållanden, vilket innebär höga krav på utrustning och kontroll.
Lästiden för en VMS är bättre korrelerad till antalet informationsenheter än till antalet rader.
En tom skärm mellan två på varandra följande VMS-meddelanden kan förbättra informationsbehandlingen.
En hög luminans är att föredra för symboler på VMS.
En symboltjocklek på tre dioder leder till bättre läsbarhet jämfört med en eller två dioders tjocklek.
Literature review on variable message signs (VMS) 2006–2009 by Sara Nygårdhs
VTI (Swedish National Road and Transport Research Institute) SE-581 95 Linköping Sweden
Summary
This literature review was initiated by the Nordic Meeting for Improved Road
Equipment (NMF) as an updated supplement to the previous report “VMS – Variable Message Signs. A literature review” by Nygårdhs and Helmers, 2007.
VMS can be used in a number of ways, for instance for information about speed, travel time, roadworks ahead, congestion, accidents, lane shift, weather, route guidance and events. During 2006–2009 a large number of studies regarding VMS have been
completed, of which 61 are referred to in this report. The main results from these studies are:
Graphic-aided signs should be preferred to text signs.
The number of lines on a VMS should be kept to a minimum, with respect to comprehensibility.
Pictograms and messages must be evaluated before they are used in practice. The typeface “Tern” is recommended for use within Europe.
Bilingual signs should be avoided.
A VMS activated only when speeding leads to reduced speed, i.e. better compliance.
Supplementary information to an activated VMS may not enhance behaviour concerning compliance.
Reading and processing a text message on a VMS lead to reduced speed. The current speed limit is ignored if it is not motivated by the traffic situation,
which means that the VMS should be activated only when conditions deteriorate.
It is essential that a VMS works correctly and reflects the actual conditions, which puts a high demand on equipment and central control.
Reading time is better correlated to the number of information units than to the number of lines.
A blank “off-screen” may enhance information processing when successive VMS are shown.
High luminance is preferable for symbols on VMS.
A three diode symbol thickness leads to better legibility than one or two diodes symbol thickness.
1 Introduction
This report is a literature review on variable message signs, VMS. A variable message sign is a sign for the purpose of displaying one of a number of messages that may be changed or switched on or off as required.
In this introductory chapter, the background of the project and the aim of the study are presented, as well as the method and the databases used.
1.1
Background and Aim
In 2006, the Nordic Meeting for Improved Road Equipment (NMF) initiated a project on the interaction between human behaviour and VMS on one hand, and legibility and VMS on the other hand. The project resulted in a literature review with mostly
European references published during the years of 2000-2005 (Nygårdhs & Helmers, 2007).
Since the field of VMS is still developing, the NMF desired an updated literature review. The aim of this literature review is to supplement the previous one with studies including the years of 2006–2009.
1.2
Method and Limitations
The literature search was carried out by VTI Library and Information Centre. Four databases were used:
TRAX – the VTI library catalogue.
TRIS – Transportation Research Information Services. ITRD – International Transport Research Documentation.
Scopus – An abstract and citation database of peer-reviewed literature. The following search words were used:
Omställbara skyltar (vägskyltar, trafikskyltar, vägmärken), Variabla meddelandeskyltar, Dynamisk trafikstyrning, Dynamisk hastighet, Dynamisk information, Dynamisk informasjon, Variabel tekst, Variable trafikkskilt, VMS, Variable message sign, Variable message display, CMS, Changeable message sign, DMS, Dynamic message sign, Variable sign, Changeable sign, Dynamic sign, Dynamic road sign, Variable message, Dynamic message, Changeable message, Congestion warning sign, Variable road condition sign, Variable speed limit sign, Dynamic speed limit sign, Changeable speed limit sign, Variable speed limit display, Dynamic speed limit display, Changeable speed limit display, Dynamic display, Variable display, Changeable display, Variable traffic sign, Dynamic traffic sign, Changeable traffic sign, Variable road sign, Dynamic road sign, Changeable road sign, Wechselverkehrszeichen
The literature search was concentrated on finding new studies on VMS within the period of January 2006 to December 2009. The search resulted in about 800 references, of which 61 references are cited in the report.
The selected literature focused on VMS outside of the vehicle (not inside bus for example) and when driving on roads (not car parks).
1.3
List of Abbreviations
VMS Variable Message Sign(s)
CMS Changeable Message Sign(s) (the same as VMS, why in general the conception VMS is used in this report)
PCMS Portable Changeable Message Sign(s) VSL Variable Speed Limit
VSLS Variable Speed Limit Sign(s)
ATIS Advanced Traveler Information Systems DSMD Dynamic Speed Monitoring Display TERN Trans-European Road Network CCTV Closed-Circuit Television
TCMS Traffic Control and Management System DGPS Differential Global Positioning System
2 Design
Crawford (2007) states that the use of bilingual messages is often a concession to politics and not safety, and that bilingual messages may lead to driver overload. The EU project TRaffic OPtimisation by the Integration of information and Control (TROPIC) concluded that the use of bilingual signs should be limited to the most essential of cases. Also, studies at the Institute for Transport Studies at the University of Leeds, UK, resulted in that increased numbers of lines on VMS (as with bilingual messages) tended to impinge driver behaviour. A decrease in minimum headways was noted, which may possibly have an impact on the driver’s ability to avoid a collision and on the severity of the collision. Using different colours or type fonts separating the two languages were recommended from this study. Another example used by Crawford is the Mare Nostrum MN-VMS initiative for harmonization of VMS in Europe. The aim is to achieve better understanding of traffic conditions among all nationalities and thereby using pictograms as much as possible.
Ullman, Trout & Dudek (2009) compared the use of graphic displays to equivalent text messages through three human factors evaluations of alternative designs. They found that a graphic display seems to improve the ability of drivers to identify available lanes in a problem area, as well as improving comprehension for non-native-language drivers when it comes to incident information like accidents or work zones.
Also in India, graphic messages instead of text messages are considered to improve comprehension (Ravinder, Velmurgan, & Gangopadhyay, 2009).
A study by Meng, Zhang & Mustafa (2009) investigated different visualization types of traffic information in different driving scenarios. The results showed that a combination of text and graphics was preferred by the drivers and that this combination was also the best when it comes to usefulness. However, understandability was significantly ranked best for text information.
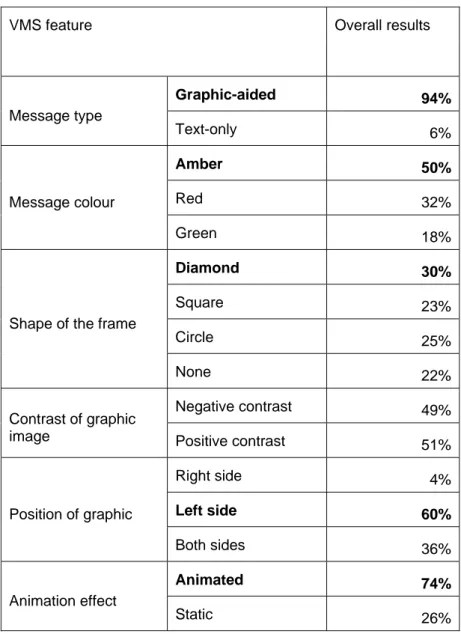
Wang, Collyer & Hesar (2006) studied graphics to aid message display on VMS signs in the USA. The study consisted of a questionnaire survey and a laboratory driving simulation experiment. The survey contained four types of VMS messages: weather (slippery road / snow), construction (road work / lane shift), information (congestion / accident) and regulatory (road work / seat belt / no truck) messages. There were a total of 40 questions, comparing graphic-aided messages and text-only messages, message colour (amber / red / green), alternative graphic images, frame around graphic image (diamond / square / circle / no frame), contrast of the graphic image (negative /
positive), position of graphic image (right / left / both sides of text message), animated and static messages. In each survey question, the participant had to decide which VMS message he or she preferred the most. It was seen that graphic-aided messages were preferred over text-only messages, across all demographic categories, gender, age and native language. The overall preferences were the following: Amber colour, diamond frame, graphic-aided VMS with the graphic image on the left and animated messages. See Table 1. No significant difference was detected between negative and positive contrast (5% risk level).
Table 1 Respondents’ preferences on VMS features. Overall preferences are marked with bold text. From Wang, et al. (2006).
VMS feature Overall results
Message type Graphic-aided 94% Text-only 6% Message colour Amber 50% Red 32% Green 18%
Shape of the frame
Diamond 30% Square 23% Circle 25% None 22% Contrast of graphic image Negative contrast 49% Positive contrast 51% Position of graphic Right side 4% Left side 60% Both sides 36% Animation effect Animated 74% Static 26%
In the driving simulation experiment, drivers were set in a car and shown a video recording of driving a section of state highway where an inactive overhead VMS was in place. The message of the VMS could, however, be changed and 48 different VMS messages were used in the experiment. The task of the driver was to press button “1” for the “MAJOR ACCIDENT AT EXIT 9 EXPECT DELAYS” message and button “2” for the “ROAD WORK NEXT 3 MILES REDUCE SPEED” message, regardless of
message type and message colour. For any other message, button “3” should be pressed. Analyses of the data found that the response time for graphic-aided messages was significantly shorter than for text-only messages. Furthermore, the response time for red-coloured messages was significantly longer than for the amber and green ones. Males responded faster than females but had lower accuracy in their answers, and younger participants responded faster and more accurate than older participants. Non-native English speakers responded faster than Non-native English speakers to graphic-aided signs. Non-native English speakers also had higher accuracy. Older drivers, native English speakers and males responded more accurate to graphic-aided messages than to text-only messages.
The conclusions drawn from the study were the following:
Graphic-aided messages are significantly better than text-only messages in terms of preference, response time and accuracy
Red colour is not recommended to be used for VMS messages
Older drivers’ performances were significantly improved by graphic-aided messages
Graphic-aided VMS messages enhanced message comprehension time for non-native English speakers.
More research is required to find out the proper specifications and design guidelines of these graphical images to be used on VMS messages.
Older drivers’ understanding of VMS messages was investigated in a Rhode Island study including a computer based questionnaire survey as well as a driving simulator experiment (Clark, Wang, Maier-Speredelozzi, & Collyer, 2008). The age of the 60 drivers participating in the study was between 20 and 94, where persons over 60 were considered older drivers. In the survey, different types of graphics, use of graphics instead of text, message colour, graphics colour, message flashing, animation, text alignment, abbreviations, shadowing and wording sequence were tested. The results showed that drivers preferred text only messages over graphics and animated graphics over stationary ones. The same subjects participated in the video based driving
simulator experiment. The results from the simulator study showed that drivers responded faster to amber messages and messages that use graphics instead of text. Older drivers’ response time was longer and less accurate than younger drivers, but their response time and accuracy was improved if graphics were used in the VMS.
Results from a survey with 150 participants in the USA showed that VMS caused drivers to slow down and that long, complex or abbreviated messages caused further slowdowns (Wang, Keceli et al., 2009). Drivers answering the survey preferred text messages over graphic-aided ones, one-frame messages over two-frame messages and messages with more details over those with less. Older drivers tended to slow down more than others as a consequence of the active VMS messages, according to the survey.
A Nordic study concerning roadworks at night was carried out by Ihs & Augdal (2008). An expert panel, consisting of ten people, evaluated different measures while driving through roadworks on a highway in the dark hours. One of the measures evaluated was if ordinary fixed signs or variable message signs should be used for the speed limit through the roadworks. All members of the expert panel preferred the variable speed limit signs, mainly because they were considered to help to draw the driver’s attention to the current speed limit.
Field experiments were conducted in Kansas following a construction company resurfacing a two-lane highway (Finger, Bai, Li, & Firman, 2009). One portable VMS (either activated with the text “Slow Down, Drive Safely”, or not activated) and one temporary traffic sign showing the message “Road Work Ahead” were used. The results showed that the VMS was effective in reducing passenger car and lorry speeds in one way two-lane work zones. However, it was noted that the temporary traffic sign had a larger speed reducing effect on passenger cars and semitrailers than the activated VMS.
Summary, Design:
The number of lines on VMS should be kept to a minimum. Graphic-aided signs should be used as much as possible. Red colour should not be used for VMS.
Bilingual signs should only be used when absolutely necessary.
If bilingual signs are used, different colours or type fonts should separate the languages.
3
Compliance and Behaviour
The Swedish National Road and Transport Research Institute conducted a study on compliance with speed limits on variable message signs, including driver interviews (Anund, Ahlström, Almqvist, & Yahya, 2009). Two sites were chosen for evaluation: One at a school and one at a crossing. At both sites the posted speed limit was 50 km/h both before and after the introduction of the VMS. The VMS was only lit up when a vehicle exceeded the speed limit. Speed measurements were carried out both before and after the introduction of the VMS, resulting in a mean speed reduction of 4-6 km/h at the school site and 1-5 km/h at the crossing after VMS had been introduced. Also, the 85-percentiles were reduced. The drivers motivate their speed reduction by being reminded of the prevailing speed limit by the VMS. Several drivers express that they do not want to drive too fast and that it is a good thing to be reminded. A conclusion from these tests was that the variable sign had an effect on the attitude of the drivers as well as on their choice of speed. After a while a supplementary VMS showing the message “Slow down”, was introduced about 10 m before the speed limit VMS at the school site. Additionally, flashing lights were introduced on the VMS at the crossing site. It was observed that these supplementary measures did not have any added effect on speed and that the interviewed drivers thought that they were already aware of the speed limit and acted according to their intentions from the speed limit VMS only. A conclusion from the study was therefore that the supplementary text VMS or the additional flashing lights did not have any speed reducing effect, but that the variable 50 km/h sign had already generated the reduction that the drivers were willing to make.
The Danish Road Directorate has implemented different traffic management
applications on motorways in order to improve traffic conditions during construction work (Wendelboe, 2008). These include a new traffic detector system, lane
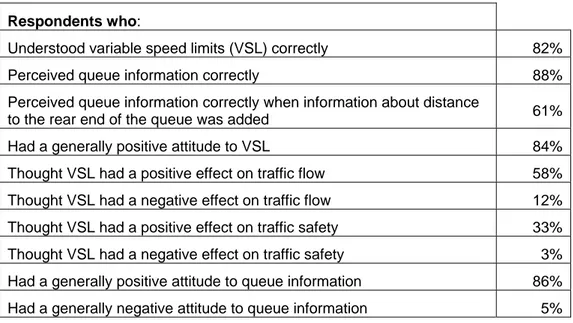
management, VMS providing real-time traffic information, CCTV, telephone and web services. VMS have led to a slight decrease in driver speeds, but no better obedience of the variable speed limit than the fixed speed limit. 78% of the motorists respected the fixed speed limit of 110 km/h before the construction started, but only 67% respected the variable speed limit of 80 km/h during construction. Driver surveys carried out show that most of the participants understood the VMS as intended. In Table 2, more results from the driver surveys are given.
Table 2 Results from driver surveys in (Wendelboe, 2008).
Respondents who:
Understood variable speed limits (VSL) correctly 82% Perceived queue information correctly 88% Perceived queue information correctly when information about distance
to the rear end of the queue was added 61% Had a generally positive attitude to VSL 84% Thought VSL had a positive effect on traffic flow 58% Thought VSL had a negative effect on traffic flow 12% Thought VSL had a positive effect on traffic safety 33% Thought VSL had a negative effect on traffic safety 3% Had a generally positive attitude to queue information 86% Had a generally negative attitude to queue information 5%
VMS billboards promoting traffic services via a website and an automated telephone service were put up along the motorway, but only 9% of the respondents used the website, 2% used the telephone service and 2% used both.
The effects of route guidance VMS on driver behaviour were studied in Norway by Erke, Sagberg & Hagman (2007). Four different text messages in Norwegian were tested on two sites of a motorway, with information about closed road sections and recommendations for alternative routes:
Text 1 (site 1): “E18 Svartskog/road works/alternative route/E6” Text 2 (site 2): “E18/Festningstunnel/closed/choose Ring 3”
Text 3 (site 2): “Europaveg 18/Festningstunnel/closed/choose Ring 3” Text 4 (site 2): “E18/Festningstunnel/is now closed/choose Ring 3”
Traffic counts were carried out at the nearest intersection downstream of site 2 to study the effects of the VMS on route choice and an analysis of speed and braking behaviour was conducted to see possible effects of the VMS on road safety. The results showed that more drivers chose the recommended route when the VMS was active than when it was inactive (45% with message and 29% without message). No significant differences were shown between text 2, 3 and 4, although there was a tendency for more
complicated messages (text 3 and 4) leading to higher compliance. VMS are effective in rerouting traffic, according to the traffic counts conducted. Every fifth driver that would have continued on the motorway changed route to follow the recommended route. The recommended route was in this case about 70 % longer than the main route, implicating that the drivers who did not comply with the VMS were familiar with the road and understood the message but chose a more efficient way to avoid the closed road section. Large speed reductions due to the text messages on the VMS were shown. From video observations it was concluded that while the VMS messages were active, there were frequently chain reactions where one vehicle braking led to the following vehicles braking or changing lanes. It is suggested that several factors (such as too short reading distance of the VMS and the speed of approaching vehicles) may have led to attention overload for some drivers. The authors’ suggestions for improvements include increased reading distance, use of symbols helping drivers make route choice decisions and speed
In Iowa, variable message signs were tested and used in connection with lane closures and traffic merging (Sperry, McDonald, Nambisan, & Pettit, 2009). A statistical review of data on four weekends stated that no significant impact on driver merging actions when the VMS messaging was activated were found compared to free flow conditions without messaging.
In Maine, the effect of advanced traveler information systems (ATIS) on motorists was studied (Belz & Gårder, 2009). Speed data were collected during hard weather
conditions to determine the effect of variable speed limit signs (VSLS) on traveler speed and surveys were carried out. It was stated that drivers adjusted their speed to what they thought was appropriate in the current conditions. The fact that drivers did not slow down according to the posted speed limit on the VSLS was suggested partly to be a consequence of the VSLS not being compulsory.
A simulator study on the effect of warning messages and variable speed limits on driver speed was conducted by Lee & Abdel-Aty (2008). 86 participants drove a highway section of about 8 km where three types of warning signs were displayed via VMS. The results of the simulator study suggest that warning messages and variable speed limit signs are successful in reducing speed variation and removing congestion.
In Montana in the United States, collisions between animals and vehicles are common (Hardy, Lee, & Al-Kaisy, 2006). To prevent this, a study including two permanent and one portable VMS used for posting messages advising drivers to watch for wildlife moving across a specific route, was carried out. The results suggest that wildlife advisory messages posted on permanent and portable VMS are generally effective in reducing average vehicle speeds, and that the advisory messages are more effective in reducing speeds during dark conditions. Additionally, the messages on the portable VMS were found to have a more significant impact on average speed than the messages on the permanent VMS.
A Korean survey showed that drivers have a greater confidence in traffic information given than in their own previous experience on the highway (Choi & Choi, 2008). During highly congested weekend periods the drivers used VMS information but during high peak event periods they relied on broadcasted radio traffic information instead. An Advanced Traveler Information System (ATIS) in Wisconsin was developed in order to enhance traffic flow locally by promoting alternative routes during road works (Chen, Qin, & Noyce, 2008). A field evaluation during a bridge reconstruction at a highway was carried out through comparisons between presence and absence of ATIS. Diversion patterns were found to be correlated to delay levels, i.e. drivers generally did not divert if the expected delay was less than 15 minutes, but had a higher tendency to divert if the displayed delay was more than 15 minutes.
In a study by Gan, Ye & Gao (2008) it was found that VMS information could influence drivers’ decision on diverting from the regular freeway route to the alternate local street route. However, the characteristics of driver, route and VMS message of travel time, influences the impact of information. It was seen that travel time saving and drivers’ driving age led to a higher compliance to divert, whereas factors such as driving
employer-provided cars, frequency of driving on freeway and drivers being mid-age had a higher tendency to remain on the freeway.
limit. It was seen that the warning system did not lead to reduced speed variability, but mean speed throughout the experimental sections was reduced by about 6.5 km/h. Oh, Hong & Park (2009) conducted a study with the aim at investigating drivers’ (about 20-30 years old) behavioral responses to VMS when reading and processing VMS messages in a VMS influence zone. Individual vehicle trajectories were studied via differential global positioning system (DGPS) and thereby speed and acceleration rates were used as surrogate measurements to represent driver behaviour. The VMS influence zone was divided into five sections, each 100 m long. Results from ANOVA tests showed that the average speed and acceleration were statistically different in each section. It was found that drivers tend to reduce their travel speed while reading and processing VMS messages, and increase speeds again after they finish reading the messages.
In Canada, surveyed drivers in general supported the use of VMS for traffic incident reports and weather information on highways (Tay & De Barros, 2008). They were also positive to VMS displaying road safety messages and to remind drivers to drive safely and be courteous on the roads. Most drivers in this study reported that they used to read and think about the displayed messages and react in a positive way to some of the road safety messages.
Summary, Compliance and Behaviour:
VMS activated only when speeding led to reduced speed, i.e. better compliance.
Supplementary information to an activated VMS may not enhance behaviour concerning compliance.
VMS are effective in rerouting traffic.
Reading and processing text messages on VMS lead to speed reductions. For non-compulsory VSL, drivers may adjust their speed to what they think
is appropriate in the current conditions.
Warning messages and VSLS are successful in reducing speed variation and removing congestion.
Displayed delay times on VMS are correlated to diversion patterns. Factors correlated to unwillingness to divert from the freeway are driving
employer-provided cars, frequency of driving on the freeway and being mid-age.
4
Reducing Speed and Accidents
In 2008, a practice report on variable speed limits was published by the Swedish Road Administration (Lindkvist, 2008b), as a result of trials during the years of 2003–2008. The accessibility of the signs was, with one exception, in accordance with the demands of showing the correct speed at least 99.5% of the time. At one site, over a long bridge, it was observed that about 80% of all drivers drove their car at a speed less than the posted speed of 90 km/h. Variable speed limits controlled by traffic were regarded in a positive way by most of the drivers. The difference between signs with and without a red ring (regulatory and recommended speed limits, respectively) was, however, not understood. Another observation was that signs that were always active (luminous), meant that only a few motorists thought that they could be out of order compared to if the signs were only active when speed limits were lowered. Many drivers meant that their respect for speed limits had increased, but at the same time most drove above the prevailing speed limit. This is mostly due to drivers following the traffic rhythm or not seeing or apprehending the prevailing speed limit. A large number of car drivers
thought that the low speed limit was not motivated by the traffic situation. Results from floating-car drives indicate that sudden applications of the brakes at very low speeds were more unusual with the variable speed limits. The introduction of variable speed limits led to increased mean speed at dense traffic and that queues were more unusual. The emission of carbon dioxide and the fuel consumption was increased, mainly due to the increased mean speed, but on the other hand, the travel time was reduced by about 5%. The authors want better information to the road users about how the traffic
controlled VSL works and also to the police, road keepers and others in the road traffic system.
A summary of the main results from the trials with VSL in Sweden was published by the Swedish Road Administration in 2008 (Lindkvist, 2008a). The trials included twenty sites with crossing, pedestrian, weather or traffic controlled automatic speed. Some of the conclusions drawn from the trials are the following:
Speed reductions of 5–15 km/h were obtained at crossings with VSL. VSL may be appropriate at relatively large traffic volumes of the main road with
secondary road traffic volume of 20–30%.
Pedestrian controlled VSL resulted in some speed adaptation and less speed variation. Most pedestrians found the measure beneficial.
Weather controlled VSL gave an extra stimulus to reduce speed at severe road conditions.
Traffic controlled VSL resulted in a calmer pace and fewer hard brakings at queues.
Driver acceptance is good for all applications.
A VSL should only be activated when conditions deteriorate.
VSL should be tried in combination with speed enforcement and better information, respectively.
A Swedish study on variable speed limits of maximum 110 km/h was conducted by Lindkvist & Lind (2007). A follow-up showed that the variable speed limits had only been correctly managed from the traffic information central 62% of the time, due to communication problems. Speed adaptation had been remarkably better after the introduction of the VSL system. The chosen speed was about 15–20 km/h lower than
uniform traffic rhythm. Most thought that the speed limit corresponded well with the weather and state of the road, although about half of the participants found that the signs were sometimes or often out of order or that the signs did not show the correct message. Information about why the speed limits were lowered would lead to higher compliance, in the opinion of the drivers asked.
According to a Swedish memo (Davidsson, Kronborg, & Lind, 2007), the value of traffic information by VMS is mainly shown in four ways:
Travel time advantages for motorists having the possibility to choose another route.
Travel time advantages for road-users passing the disruption after that the inflow to the disturbance has been reduced and the queue reduction is facilitated.
Comfort advantages through information for road-users, for example realistic expectancies of queues and travel times, leading to less stress and irritation. Environmental and safety effects of shorter queues, uniform speeds and less
incidents as well as secondary accidents.
Travel time reductions of 3–9% have been calculated at bigger incidents, due to information of alternative route choices. A 10% reduction of the number of rear-end collisions has been estimated, due to gradual speed reduction before the end of a queue. The environmental effects of VMS are mainly connected to how the variable speed signs influence the acceleration and retardation course on the main road.
Findings from a Swedish study at rural intersections where variable speed limits were introduced claim that VSL contribute to improved traffic safety at certain rural
intersections at the cost of increased travel time of a few seconds for drivers on the main road (Towliat, Svensson, & Lind, 2007). The speed limit was reduced from 90 km/h to 70 km/h when a vehicle turned from the side road to the main road or from the main road to the side road. Most drivers experienced that it had become easier to turn to the main road and fewer drivers exceeded the speed limit after installation of the VSL. The drivers who experienced that the system worked properly, appreciated the system considerably more than the others. They were also more willing to follow the speed limits than the others, implying that it is very important that the system works properly for as many drivers as possible. Recommendations from the study included:
Variable speed limits should be used when the traffic on the primary road is at least 10 000 vehicles/day and the secondary traffic amount to 20-30%. If visibility is limited, VSL can be motivated even with less primary road traffic. If the traffic on the secondary road is less than ca. 10% a dynamic warning sign
should be used instead (the road sign “crossing traffic” as VMS). The sign should be activated with the same criteria as for VSL.
If the traffic on the secondary road is more than ca. 40%, a local fixed speed limit should be considered.
However, since there is a high demand on equipment and central control, the costs will often be too high for VSL.
In a Swedish thesis work by Baghdarusefi (2009), long-term effects of VMS messages active when a pedestrian was present at pedestrian crossings were examined. The conclusions from studies before and after installation of the VMS messages showed that on the long term:
Speeds have been reduced when the VMS is active at a pedestrian crossing. Speeds have been reduced when the VMS is non-active.
The willingness of the motorists to stop and give way to pedestrians was increased when the VMS was active.
A study where slow-moving road marking vehicles were equipped with VMS showing the maximum recommended speed throughout the work zone was conducted by the Swedish Road Administration (Friberg, Persson, Granlund, & Johansson, 2007). Radar measurements showed that when the VMS was not active, both the average and top speeds were very high. However, when the VMS was active, the average speed was reduced by 22 km/h on wide roads. The percentage of vehicles driving at extremely high speeds (more than 70 km/h) dropped from 62% to 12%.
In Finland, a long-term research and development programme was developed based on present state analysis and a brainstorming session (Peltola, Rajamäki, & Luoma, 2007). The aim of the programme is to develop an effective strategy for speed management in Finland, and the following projects were considered to be especially efficient in order to fulfil the vision of traffic safety and the strategy for speed management: to find criteria for appropriate speed levels during varying conditions, to reduce particularly large risks on main roads and to develop speed enforcement further.
As previously mentioned (see Chapter 3), the Danish Road Directorate has implemented different traffic management applications on motorways in order to improve traffic conditions during construction work, and one of those is VMS providing real-time traffic information (Wendelboe, 2008). It was noted that VMS have led to a slight decrease in driver speeds and that 82% of the participants in a driver survey correctly understood the variable speed limits. 78% of the motorists respected the fixed speed limit of 110 km/h before the construction started, but only 67% respected the variable speed limit of 80 km/h during construction. (Author’s comment: This is probably not
due to the use of VMS, but to the reduced speed limit itself.)
In an Australian review of designs and outcomes of some VSL systems that have been implemented or tested on motorways, the following summary of safety benefits from VSL installations in Europe was reported (Han, Pyta, & Lennie, 2008):
Accident reductions by 15–33% (Dutch and British studies) Crash rate reductions by 20–30% (German study)
Secondary crash reduction by 35% (Dutch study)
Injury crash reduction by 2–13% (British and Finnish studies) Serious crash reduction by 22% (Dutch study)
Reduction of vehicles involved in crashes by 19% on average (Dutch study) Damage only crashes for every injury accident reduction by 20% (British study) It was stated that VSL is an effective control tool for roadway sections with unstable traffic flow and unsafe driving behaviour. The effects of VSL systems were summarized
Better speed compliance
Reduced mean speed during adverse conditions Generally reduced speed variance
Significant safety benefit Improved journey time
Positive impact on the environment due to less emission.
The Utah Department of Transportation wanted to evaluate the effect of variable speed limits (VSL) at work zones on driver behaviour (McMurtry, Riffkin, Heath, & Saito, 2009). Five speed detectors and two VSL signs were placed in a long distance work zone and vehicle speeds were observed for three months. It was seen that the average speed between the static speed limit signs and VSL signs was not statistically different (at a 95% confidence level). However, variation in speed was reduced generally. It was also seen that speed restrictions reflecting actual conditions builds trust in the posted speed limit.
In an earlier report by the Utah Department of Transportation (Riffkin, McMurtry, Heath, & Saito, 2008) there were positive long term indications for VSL signs to reduce average speed and speed variation. Drivers were provided with real time speed limit information reacting to the construction conditions in the field. It was seen that when no construction activity was at hand, in the evening, the VSL signs resulted in statistically lower speed than static speed limits through the construction zone.
Heaslip, Collura & Knodler (2009) made a field study along a rural road in Massachusetts where several design features were evaluated, including portable
changeable message signs (PCMS). One of the results from the study was that PCMS in advance of work zones are effective in reducing driver speeds.
A New York study on the effectiveness of three commonly used VMS messages in reducing vehicle speed was carried out by Zech, Mohan & Dmochowski (2008). Speed measurements on about 180 000 vehicles were made. The three VMS messages were:
1. RIGHT LANE CLOSED~KEEP LEFT 2. WORK ZONE MAX SPEED 45 MPH~BE PREPARED TO STOP 3. LEFT LANE CLOSED~KEEP RIGHT
It was found that vehicle speeds were most reduced by VMS message 2 (5.3–10.8 km/h reduction).
The Dynamic Speed Monitoring Display (DSMD) sign is a tool for reducing speeding on roadways (Schoenecker, Sandberg, Sebastian, & Soler, 2008). The DSMD signs measure the speed of approaching vehicles and reports it back to the driver in real time.
An evaluation of DSMD signs at speed reduction transition zones, where the speed limit is reduced, was carried out. Immediately after installation of the DSMD signs, a
statistically significant decrease in overall vehicle speed was found (about 11 km/h) and this reduced speed was maintained during the one yearlong study. The conclusion from the study was therefore that DSMD signs were effective long-term for speed
management at speed transition zones.
Speed-monitoring displays for reduction of speed in school zones were studied in field studies in South Korea by Lee, Choulki et al. (2006). Short-term results showed that vehicle speed was reduced when the driver perceived the sign and the average speed was reduced by about 17.5% (8.2 km/h) at the location of the sign. This was the case throughout the day, irrespective of the time of day. Long-term study results showed that average speed reduction was 12.4% (5.8 km/h) at the location of the sign. Statistical analyses showed that the speed differences were statistically significant. It was also seen that the number of speeding vehicles was considerably reduced, and the 85th percentile speed also decreased from 54.3 to 46.3 in the short-term and to 45.0 km/h in the long-term studies, respectively. The conclusion drawn from the studies was that speed-monitoring displays are effective in reducing speed in school zones for a long period of time.
A Canadian study suggested that the implementation of variable speed limit sign systems could provide improvements in safety but that these were obtained at a cost in terms of increased travel times (Hellinga & Allaby, 2007). Safety improvements were achieved for heavily and moderately congested traffic conditions. Net reduction in safety occurred for uncongested conditions. Travel times were increased for all traffic scenarios considered when VSL were used.
Summary, Reducing Speed and Accidents:
A VSL should only be activated when conditions deteriorate.
It is essential that the VSL works correctly and reflect actual conditions, which puts a high demand on equipment and central control.
Traffic controlled VSL are positively regarded by drivers and may lead to fewer hard brakings at queues.
Weather controlled VSL could help reduce speed at severe road conditions. If drivers do not think that the speed limit is motivated by the traffic situation,
they ignore the current speed limit.
Gradual speed reduction is effective and drivers also ask for a more uniform traffic rhythm.
5
Use of VMS, New Systems and Technologies
In general, VMS are used for information about: Speed Travel time Roadworks Congestion Accidents Lane shift Weather Route guidance
Other information, such as o Toll road
o Events o Parking
o Safety messages.
A new type of VMS, called the swap sign, has been developed by the Danish Road Directorate (Vithen & Sillesen, 2009). The sign can swap between the active and inactive state and is intended to be used at minor roadworks on motorways. When the roadwork starts, the sign will be activated, leading to high credibility experienced by the road users.
In England, predictive traffic information is given to road users by VMS (Burton, Crosthwaite, Simpson, & Billington, 2008). It uses a combination of historical data and real-time journey times collected by over 1000 automatic number plate recognition (ANPR) cameras. The predicted travel times have been highly accurate and road users have been very positive.
The Cooperative Systems for Intelligent Road Safety (COOPERS) project is a European research project focusing on co-operative traffic management. The goal of the project is to establish safety-related service communication using two-way communication between infrastructure and vehicles. It includes for example accident/incident warning, weather conditions warning, roadwork information, lane utilization information, traffic congestion warning, estimated journey time, recommended next link and map
information (Fuchs & Bankosegger, 2008; Meckel & Jandrisits, 2008).
On critical sections of Slovenian highways, a system called Traffic Control and Management System (TCMS) is installed (Kastelic, Zupancic, & Pirc, 2008). The system provides information about current traffic and weather conditions by means of video surveillance and detection cameras. When a critical situation or incident detection is at hand, the system displays appropriate traffic messages on 25 VMS. A high positive impact on safety has been observed, where emergency response time has been reduced as well as the number of accidents and traffic congestion.
On German motorways, lane control systems are used (Denaes, Schieferstein, Riess, & Ermer, 2009). They adapt the maximum speed limit automatically according to traffic and weather conditions and can also warn the drivers of fog, queues, accidents and other dangers. Before and after analyses have shown that the lane control systems have a potential to reduce accidents by about 30%, with a simultaneous capacity increase of about 5–10%.
A research project in the Netherlands is lowering the speed limit on highways according to bad weather conditions, especially rain (Jonkers, Klunder, van der Horst, & de Rooy, 2008).
In Turkey, a VMS management system is being used for minimizing traffic delays, travel times and fuel consumption (Demircan & Gallastegi, 2008). The system can provide real-time traffic flow information and alert operators to potential incidents by an incident detection module. It is possible to see previously sent messages and to set brightness and illumination levels from remote sites.
Pickworth & Marsch (2008) conclude that new technologies, such as mobile phones and satellite navigation, will provide drivers with information in new forms. It is also
considered essential that information overload does not occur for the drivers so the right balance of information should be provided.
In the province of Florence a traffic information service called “Fipilissima” has been tested (Bellini & Tartaglia, 2007). Vehicles carrying out the road patrolling are equipped with video cameras as well as a variable message panel so that accidental events or queues can be signaled closer to the position for the event. This is made possible by integration of dynamic message signs located along the road and at the interchanges.
On French motorways, a new system has been tested, where the goal was to use the navigation system to alert the driver of the current speed limit when passing nearby a road work (Boussuge & Dubois, 2007). The navigation system will then be able to warn the driver before the road work to help him or her to adapt the vehicle speed in advance. In three years’ time, the average vehicle speed dropped by 5–6% and the number of fatalities was cut by 35%.
In the USA, commercial electronic VMS are often used for displaying information on missing children or advising motorists of emergencies ahead. The Federal Highways Agency has stated that digital billboards are not violating the regulations prohibiting intermittent or moving lights on billboards (Birdsall, 2008).
Since installation of 13 VMS along major highways of Staten Island, large amount of positive public attention has been received (Ding, Alam, & Amin, 2008). This is thought to be due to the accurate travel times posted and also because of congestion relief.
Summary, Use of VMS, New Systems and Technologies:
It is vital that information overload does not occur for the driver. VMS are used for information about:
o Speed o Travel time o Roadworks o Congestion o Accidents o Lane shift o Weather o Route guidance
o Other information, such as Toll road
Events Parking
Safety messages.
New systems and technologies include:
o Video-equipped vehicles for accident and queue warning o Navigation system alert on current speed limit
o Historical data and automatic number plate recognition to predict travel times.
6 Legibility
Kim, Oh, Yeon & Kim (2009) conducted a field study on message reading time for VMS in South Korea. A 500 m road stretch with 2 lanes in each direction was chosen for the field test, in which 61 drivers participated. Each participant drove the experiment site in an equipped vehicle while an operator collected data on the participant’s message reading times, defined as the time from when the participant identified legible VMS characters to when he or she completed reading the displayed message. One outcome from the study was that the number of information units, defined as the minimum unit of messages which has an independent meaning, was better correlated to VMS reading time than the number of lines displayed on the VMS. The study resulted in a model using only statistically significant variables expressed as the following equation: VMS reading time (sec.) = 1.765 + 0.402x – 0.021y + 0.166z,
where
x = number of information units (2-8)
y = travel speed (10-80 km/h) z = age group
(0 = 20-30 years, 1 = 30-40 years, 2 = 40-50 years, 3 = 50-60 years). The authors propose that more field experiments with larger groups of participants should be conducted to derive more realistic and reliable models. Additionally, there need to be experiments on real roadway conditions to validate the proposed models. Research at the University of California, Berkeley, was carried out in order to optimize comprehension of VMS signs (Greenhouse, 2007). The project conducted was divided into laboratory studies and a field test. In the laboratory studies, a computer controlled VMS display program quantified a driver’s ability to stay within a simulated lane while measuring the accuracy of the driver’s comprehension of message content. Accuracy was quantified by the percentage of words correct (WC) and the percentage of numbers correct (NC), in the meaning of measuring the number of words (or digits, respectively) that the observer rendered correct divided by the possible number of words (or digits) contained within the VMS frames for all trials in a given test. Nine observers with fully corrected vision and ages ranging from 20 to 74 (6 young and 3 old) were tested. The accuracy of lane keeping was measured by the percentage of time that the participant kept within the lane. Results from these tests showed:
The insertion of a blank “off-screen” (duration 300 ms) between successive frames in a portable VMS enhanced the average WC score for younger as well as for older observers. The NC score was also improved for younger observers. This indicated better processing of information content with a blank “off-screen”.
Both left and staircase (first line left-justified, second line centre-justified, third line right-justified) justification of a permanent VMS are likely to improve an observer’s ability to reproduce information content contained within a VMS. The geometric alignment of the staircase-justified text might fit the natural
Gradually increasing the physical size of the letters does not improve the observer’s ability to reproduce the information of the VMS and may possibly reduce the understandability of these messages.
Understanding of the message declined when one specific element (a number or a letter) of the message was changed between two frames.
Abbreviated words on VMS display decreased the comprehension of the VMS compared to non-abbreviated words. This was due to observers stopping reading the rest of the message because they did not understand the abbreviations. Another set of laboratory experiments, with 10 observers (mostly young), was carried out to clarify the concept of “information unit”. Observers were shown a message containing a license plate or a directional message containing a direction (“E” or “W”) and were asked to recall the direction or the license plate, respectively. The recall of license plates was not as good as the recall of direction, implying that license plates have greater “informational content” than directional messages. Finally, a field test with a single informative message was carried out. The text message was either shown as standard (center-aligned) or in novel (staircase) configuration. No significant disruption to traffic flow was found with the optimal, i.e. staircase configuration of the message. Another study concerning recall of license plate numbers, in Texas, was reported by Dudek, Schrock & Ullman (2007). It was seen that the majority of the participants could not recall the entire number and hence that a license plate number was considered to be equivalent to more than three units of information. That means that a message with a license plate number exceeds the current message guidelines that specify a maximum of four units of information in a message and a maximum of three units of information in a message phase.
Results from a driving simulator study in Texas showed that presenting five units of information on sequential portable VMS resulted in unacceptably low comprehension rates for highway applications (B. R. Ullman, Ullman, Dudek, & Williams, 2007). Using four information units instead led to the same comprehension rates as those obtained by presenting the same information at a single location on a large VMS. Another study by G. L. Ullman, Ullman & Dudek (2007) was carried out as a laptop-based human factors study where a total of 192 participants in Texas were shown a series of different twophase messages for a specific amount of time. The participants were then asked questions to determine comprehension and recall of the information presented in each message. They were also required to determine which way of
presenting the message that they preferred the most. The results from this study showed that when presenting calendar dates a three-character abbreviation of the month, such as APR for April, should be displayed together with the date. For information spanning of several dates, the abbreviation should only be used once, i.e. APR 21-23 instead of APR 21-APR 23.
A study with the aim to investigate which symbol luminances are suitable from the road-user's point of view, i.e. luminances which make the sign conspicuous, but not as high as to involve glare and thereby impair legibility, was performed within the Nordic collaboration NMF (Nordic Meeting for Improved Road Equipment) (Lundkvist,
Sørensen, & Nygårdhs, 2006). Comparative observations of two variable message signs with white symbols placed next to each other were made. At the assessments, three observers (the authors) had to decide which symbol luminance they found "most suitable". This implied that the three observers compared the two signs, which always had different luminance, with respect to "suitable symbol luminance" and through a
series of comparisons the preferred luminance was defined. This was done through observations at a distance of 46 metres from the signs during various light conditions, in daylight, dusk and darkness. The results show that to obtain the luminances that were considered "most suitable", the VMS had to belong to luminance class L3. If the correlation in the standard between luminance and illuminance would be based on this "suitability measure", this result would be true for all lighting conditions. However, there was a tendency that in darkness, it was also possible for a sign belonging to class L2 to fulfil the demand for symbol luminance. Daylight conditions became
standardizing, though, and under these lighting conditions luminances in class L3 were preferred. A comparison of the results from the present and two previous observation studies shows great concordance: A predominant amount of observations show that luminance class L3 is demanded for achieving "suitable" luminance. However, there are also indications that luminances belonging to class L2 could be accepted, but from the road-user's point of view, L3 is still preferred.
A later pilot study within the NMF tried to investigate how legibility distance depended on luminance class, symbol thickness and space between symbols in daylight (Nygårdhs & Lundkvist, 2008). Six test subjects were instructed to walk from a start position at about 400 m away from a VMS towards the sign to the point where they, separately, were completely certain of what two digit numbers were shown on the VMS. Legibility distance between the VMS and the subject was registered. Luminance class was tested in two levels, symbol thickness in three levels and space between symbols in three levels. Conclusions from this pilot study were the following:
Luminance class L3 is preferable to L2.
A three diode symbol thickness gives longer legibility distances than one or two diodes thickness.
One diode’s symbol thickness in combination with luminance class L2 results in very short legibility distances.
The space between symbols only affects legibility distance to a minor extent.
Summary, Legibility:
The number of information units may be better correlated to VMS reading time than the number of lines displayed.
The definition of information unit is not easily stated.
A blank “off-screen” with short duration may enhance information processing when successive VMS frames are used.
Right-justified text on VMS should be avoided.
Abbreviations could decrease understanding of VMS if they are not very commonly known.
Luminance class L3 is preferable for symbols on VMS.
A three diode symbol thickness leads to better legibility than one or two diodes thickness.
7 Recommendations
The need for the use of standardized visual imaging is stated among others by Wordswoth (2009). The increasing traffic on European motorways and different national approaches lead to an excessive workload for drivers.
In the EU-project Infrastructure and Safety (In-Safety), one of the deliverables is a proposal on unified pictograms, keywords, bilingual verbal messages and typefaces for VMS in the Trans-European Road Network (TERN). The result of the deliverable was a first step into systematizing and harmonizing verbal messages across Europe
(Simlinger, Egger, & Galinski, 2008). The aim of this harmonization was for example to:
facilitate the development of navigation systems in different languages in Europe
facilitate the design for traffic information systems
make the whole system of traffic signs, variable messages and verbal messages more consistent and more flexible
improve perception and comprehension for the driver.
In “Proposal on unified pictograms, keywords, bilingual verbal messages and typefaces for VMS in the TERN” (Simlinger, et al., 2008) the recommended VMS designs for regulatory (lane allocations, carriageway guidance, speed control, regulations), danger warning (general danger warning, immediate warning on weather conditions, immediate warning on traffic status), informative (advance warning, advice, driver comfort) and miscellaneous signs are given. Also, different versions of the typeface “Tern” for use on static signs and on VMS is found. The report is accessible on the following webpage: http://www.insafety-eu.org/documents/IN-SAFETY_Deliverable_2.3.pdf
(Att: 2011-02-22)
Some of the recommendations given are the following: Information on VMS must always be placed centered.
To obtain longest possible viewing duration (text) messages must always be built from bottom to top (i.e. be aligned at the bottom of the sign).
The ranking of information elements should be as follows:
o Left: Information on danger hazard or “out of order” ahead o Middle: Prohibition, restriction, and/or mandatory information o Right: Ancillary information
Spaces between information elements belonging together should be four times the defined smallest graphical detail
In case of an impassable stretch of motorway and indicated reachable and inaccessible places the former are to be shown with appended check marks in green, the latter with appended diagonal crosses in red.
A “Best practice guide on road signing” within the In-Safety project is given by
Sulzmann (2008). It is stated that there is a set of validated and standardized pictograms available for further discussion and analysis. It is also recommended to evaluate
pictograms, messages etc. before they are used in practice. Test results have proven that superimposing animated pictograms with a flashing graphic element impairs
comprehension, why only static symbols are to be used with flashing elements to alert drivers of a rapidly approaching danger.
Summary, Recommendations:
VMS pictograms and messages should be evaluated before they are used in practice.
The typeface “Tern” is recommended for use within Europe according to the In-Safety project.
8
Discussion and Conclusions
In this literature study, current reports and articles on the VMS topic have been reviewed. One of the most relevant conclusions from the study is that for the justification of the VMS system, it must be reliable. This means, that if the proper measures could not be taken to ensure that the information on the VMS is relevant and accurate, it should simply not be used.
When it comes to design of VMS, research in general advocate using graphics when possible. This puts high demands on finding graphical images that are easily perceived and understood in spite of the fact that they are built up on pixels. Additionally, the graphical images should be harmonized to an as large extent as possible. Evaluation of pictograms and other messages is essential before they are used in practice.
More research is required on legibility of VMS. One of the relevant topics is how to increase the reading distance. If a driver knows in advance what he or she should be prepared of, the chances are better for compliance with the message on the VMS. One way to make sure that the VMS is read properly may be gradual speed reduction leading to a more uniform traffic rhythm and reduced attention demands from driving.
Supplementary research and field experiments in the area of information units could be useful, as well as the adjustment of text.
Suggested areas of future research:
Graphic messages on VMS. How can they be designed o to be easily perceived in real traffic?
o to be used in many countries?
o to contain enough information but not lead to information overload? o using reasonably cheap technology?
Legibility of VMS.
o Which text adjustment should be used? o How should frames be used?
o Which colours should be used and how? Information units.
o What are they?
References
Al-Ghamdi, A., S. (2007). Experimental evaluation of fog warning system. Accident
Analysis & Prevention, 39(6), pp. 1065–1072.
Anund, A., Ahlström, C., Almqvist, S., & Yahya, M.-R. (2009). Småskalig ITS: Utvärdering av effekten av lokala VMS-system i tätort VTI rapport 646. Linköping: VTI.
Baghdarusefi, H. (2009). Långtidseffekter av omställbara skyltar vid övergångsställe. Lunds Tekniska Högskola, Lund. (156)
Bellini, D., & Tartaglia, V. (2007, 17–21 September 2007). An Integrated System for
Traffic and Information to Users: Management during Resurfacing Works on a Dual Carriageway. Paper presented at the 23rd PIARC World Road Congress, Paris.
Belz, N., P, & Gårder, P., Erik. (2009). Maine Statewide Deployment and Integration of Advanced Traveler Information Systems. Transportation Research Record: Journal of
the Transportation Research Board (2129).
Birdsall, M., S. (2008). The Debate over Digital Billboards: Can New Technology Inform Drivers without Distracting Them? ITE Journal, 78(4).
Boussuge, J., & Dubois, C. (2007, 17–21 September 2007). Realtime Speed Limit Map
on Road Works to Improve Safety. Paper presented at the 23rd PIARC World Road
Congress, Paris.
Burton, P., Crosthwaite, S., Simpson, A., & Billington, P. (2008, 20081116–20081120).
The Design and Implementation of a National Real-Time Travel Time on VMS Service.
Paper presented at the 15th World Congress on Intelligent Transport Systems and ITS America's 2008 Annual Meeting, New York, USA.
Chen, Y., Qin, X., & Noyce, D., A. (2008). Evaluation of ATIS in Suburban Freeway
Work Zone. Paper presented at the 15th World Congress on Intelligent Transport
Systems and ITS America's 2008 Annual Meeting, New York, USA.
Choi, Y., Hyuk, & Choi, K. (2008). Influence of Traffic Information Media on Drivers'
En-Route Diversion Behaviors. Paper presented at the 15th World Congress on
Intelligent Transport Systems and ITS America's 2008 Annual Meeting, New York, USA.
Clark, A., T, Wang, J., H, Maier-Speredelozzi, V., & Collyer, C., E. (2008). Assisting
Elder Drivers' Comprehension of Dynamic Message Signs. Paper presented at the
Transportation Research Board 87th Annual Meeting, Washington, DC, USA. Crawford, D. (2007). Brief encounter? ITS International, May 2007–Jun 2007, p. 49–50.
Davidsson, F., Kronborg, P., & Lind, G. (2007). PM - Trafikstyrning och tillgänglighet. Stockholm: Movea Trafikkonsult AB.
Demircan, A., & Gallastegi, M., Izaskun. (2008). Message in a Bottleneck. Traffic
Technology International, 2008/01, pp 68–69.
Denaes, S., Schieferstein, A., Riess, S., & Ermer, P. (2009). Neue Methoden zur Steuerung von Streckenbeeinflussungsanlagen – Teil 1: Zielfunktion wur
estimating the impacts of speed regulation messages and congestion warning.
Strassenverkehrstechnik, 53(3), p. 133–140.
Ding, Y., Alam, S., & Amin, R. (2008, 20081116–20081120). Staten Island Travel
Time Information System. Paper presented at the 15th World Congress on Intelligent
Transport Systems and ITS America's 2008 Annual Meeting, New York, USA. Dudek, C. L., Schrock, S. D., & Ullman, B. R. (2007). License plate and telephone numbers in changeable message sign Amber alert messages. Transportation Research
Record, p. 64–71.
Erke, A., Sagberg, F., & Hagman, R. (2007). Effects of route guidance variable message signs (VMS) on driver behaviour. Transportation Research Part F, 10(6).
Finger, K., Bai, Y., Li, Y., & Firman, U. (2009). Determining Motorists' Response to
Signage in Rural Highway Work Zones. Paper presented at the Transportation Research
Board 88th Annual Meeting, Washington, DC, USA.
Friberg, F., Persson, M., Granlund, J., & Johansson, A. (2007, 17–21 September 2007).
Traffic Calming at Mobile Roadwork Zones: Use of Vehicle-Mounted Radar to Evaluate the Effect of Variable Message Signs. Paper presented at the 23rd PIARC World
Congress, Paris.
Fuchs, S., & Bankosegger, D. (2008). Developing Value Chains for Co-Operative
Services - Safety and Convenience Services. Paper presented at the 15th World
Congress on Intelligent Transport Systems and ITS America's 2008 Annual Meeting, New York, USA.
Gan, H., Ye, X., & Gao, W. (2008). Drivers' En Route Diversion Decisions Under
Influence of Variable Message Sign Information: Empirical Analysis. Paper presented at
the Transportation Research Board 87th Annual Meeting, Washington, DC, USA. Greenhouse, D. (2007). Optimizing Comprehension of Changeable Message Signs (CMS). California PATH Research Report, 2007/11.
Han, C., Pyta, V., & Lennie, S. (2008). A review of variable speed limits (VSL)
initiatives and reported results. Paper presented at the AITPM 2008 National
Conference: Making Connections – People, Places, Goods and Services, Blackwood, Australia.
Hardy, A., Lee, S., & Al-Kaisy, A. F. (2006). Effectiveness of animal advisory messages on dynamic message signs as a speed reduction tool: case study in Rural Montana. Transportation Research Record, p. 64–72.
Heaslip, K., Collura, J., & Knodler, M., A. (2009, 20090111-20090115). Evaluation of
Work-Zone Design Features to Aid Older Drivers. Paper presented at the Transportation
Research Board 88th Annual Meeting, Washington, DC, USA.
Hellinga, B., & Allaby, P. (2007). The potential for variable speed control to improve
safety on urban freeways. Paper presented at the Transportation Association of Canade
Annual Conference, Saskatoon, Saskatchewan, Canada.
Ihs, A., & Augdal, A. (2008). Störande ljus vid vägarbeten om natten – fältförsök på E6 norr om Varberg 19–20 april 2007 (Disturbing lights at road works during night – field tests on E6 north of Varberg 19–20 April 2007) VTI notat 24-2008. Linköping: VTI. Jonkers, E., Klunder, G., van der Horst, R., & de Rooy, R. (2008). Development of an