Price elasticities of demand for (garage) parking in Stockholm
Kristofer Odolinski – Statens väg- och transportforskningsinstitut (VTI)Roger Pyddoke – Statens väg- och transportforskningsinstitut (VTI)
CTS Working Paper 2019:2
Abstract
There is scope for generating welfare effects by changing parking fees, where knowledge on price elasticities are central elements in the implementation of an efficient parking policy. In this paper, we estimate price elasticities of demand for five parking garages in the central business district of Stockholm, using transaction data and a price increase implemented in January 2017. The econometric results for the purchased parking hours show an average elasticity estimate at -0.60, while the effect on the decision to park is -0.45. These elasticities vary for the different parking garages, showing that there is a considerable heterogeneity between garages, even within the central business district, which needs to be considered for an efficient parking policy. Based on our estimated elasticity for garage parking (-0.60) and a willingness to pay a premium for curbside parking in previous research, we calculate a proxy for the elasticity of curbside parking in Stockholm, which is found to be -0.39.
Nyckelord: Parking; Price elasticity; Garage; Parking policy; JEL-koder: R41; R42; R48
Centre for Transport Studies SE-100 44 Stockholm
Sweden
1
Price elasticities of demand for (garage) parking in Stockholm
Kristofer Odolinskia
Roger Pyddokea
a The Swedish National Road and Transport Research Institute, VTI, Department of Transport
Economics; Box 55685; 102 15 Stockholm, Sweden.
Abstract
There is scope for generating welfare effects by changing parking fees, where knowledge on price elasticities are central elements in the implementation of an efficient parking policy. In this paper, we estimate price elasticities of demand for five parking garages in the central business district of Stockholm, using transaction data and a price increase implemented in January 2017. The econometric results for the purchased parking hours show an average elasticity estimate at -0.60, while the effect on the decision to park is -0.45. These elasticities vary for the different parking garages, showing that there is a considerable heterogeneity between garages, even within the central business district, which needs to be considered for an efficient parking policy. Based on our estimated elasticity for garage parking (-0.60) and a willingness to pay a premium for curbside parking in previous research, we calculate a proxy for the elasticity of curbside parking in Stockholm, which is found to be -0.39.
JEL codes: R41; R42; R48
Keywords: Parking; Price elasticity; Garage; Parking policy
Acknowledgements
The authors are grateful to the Centre for Transport Studies, Stockholm, for funding this research. Special thanks to Dr Johanna Jussila-Hammes for her help in the initial work with this study, as well as to Jessica Lindau and Claes Ohlsson at Stockholm Parkering for providing access to their transaction data and their support in answering our questions. The authors also wish to thank Prof. Jonas Eliasson for providing helpful comments on an earlier version of this paper, as well as colleagues at the Swedish National Road and Transport Research Institute for their comments on a presentation of this paper in April 10, 2019, Stockholm. All remaining errors are the responsibility of the authors.
2 1. Introduction
External costs created by car traffic motivates the use of road tolls and parking policies. Verhoef et al. (1995) concludes that the scope of the latter is more limited than the former. Still, a parking policy can be efficient in targeting external costs created by cruising for parking, which is likely to exist if parking fees are (too) low and street parking highly occupied. Theoretical and empirical research has suggested different occupancy rates for curbside parking that parking regimes should aim at in order to reduce cruising (and hence externalities) to optimal levels. For example, Shoup (2005) suggests an optimal occupancy rate at 85 per cent, while Arnott (2014) takes steps to show analytically how the optimal occupancy rate varies depending on the level of demand intensity. In any case, information on the price elasticity of demand for parking is an important part of the formulation of a parking policy. Numerous estimates of the price elasticity of parking demand has been provided in the literature, which varies considerably depending on the context of the data and the method used. For example, Concas and Nayak (2012) provide a meta-analysis, reporting elasticities between 0 and -6.22, with a mean value of -0.48. Their meta-analysis regression indicates an elasticity at -0.86 (in non-North American parts of the world and -0.30 in North America) when the reported estimate is based on an econometric technique using observational data, and that the estimates vary for different types of locations. A recent meta-analysis of price elasticities of parking is provided by Lehner and Peer (2019), reporting means of elasticities with respect to parking occupancy (-0.5 with standard deviation 0.36), dwell time (-0.59 with standard deviation 0.89) and parking volume (0.50 with standard deviation 0.51). Specific examples of studies that estimate the price elasticity of parking are Madsen et al. (2013), Ottosson et al. (2013) and Gragera and Albalate (2016). Madsen et al. (2013) estimate price elasticities of curbside parking occupancy in Copenhagen, and a calculation of the elasticity in the inner zone at the sample average yields the elasticity -0.69 (using best guesses of the share of residential parking, ranging from 10 to 30 percent, gives grounds for adjusting the above figure to about -1). The price elasticities for curbside (on-street) parking occupancy in Ottosson et al. (2013) vary depending on the time of the day and neighbourhood characteristics (for example, distance to downtown), with estimates between -0.37 to -0.70 for neighbourhoods experiencing increased rates. Gragera and Albalate (2016) estimate the impact of garage fees and curbside regulation on garage parking demand (purchased parking hours) with yearly data from 34 garages in Barcelona from seven years for occasional parkers and parking subscribers. The estimated price elasticities for these groups are -1.2 and -1.1 respectively.
3 Considering the variation in estimates1, a city’s parking policy may be well-served by elasticities of
parking demand that are estimated on data and with methods that allows an extrapolation to their context, for example, using transaction data and econometric techniques that considers the heterogeneity between parking facilities/locations in a city. The purpose with this paper is therefore to estimate price elasticities of demand in the central business district (CBD) of Stockholm, using a fixed effects model with transaction data on purchased parking time, before and after a change in parking fees. We only have transaction data for garages. However, we consider that these can also be used as proxies for the elasticities of demand for curbside parking, acknowledging that there may be a shift parameter corresponding to the willingness to pay a premium for parking in streets compared to parking in garages. This shift parameter is expected to be positive as willingness to pay is likely to be higher for parking on streets than in garages. The premium was found to be in the range from EUR 0.37 to EUR 0.6 by Kobus et al. (2013) and EUR 0.55 in Gragera and Albalate (2016).
Indeed, curbside parking and garage parking are (imperfect) substitutes. One way to achieve a better occupancy rate and reduce cruising for parking is to decrease the difference in fees between these parking alternatives. For example, Calthrop and Proost (2006) and Arnott and Rowse (2009) considers a situation where curbside fees are lower than garage fees and suggests a parking equilibrium condition in which cruising for parking will increase until the total cost of both parking alternatives is equal. It is shown that in case of traffic congestion, there are large welfare benefits of increasing the fee for curbside parking (see Inci (2015) for a comprehensive review of the literature on the economics of parking).
Inefficient outcomes are also created by garage fees that are not set at its marginal cost. This is mainly due to a market power of garage operators created by the geographic proximity of destinations that drivers are willing to pay a premium for (Arnott (2006)). This can create a larger difference in fees between the parking alternatives and thus increase cruising for parking. In fact, in the CBD of Stockholm, the garage fees are higher than the curbside parking fees, a difference that became more pronounced when the garage fees increased (with around 25 per cent) in January 13th, 2017, while
curbside fees in this area were mostly left unchanged.2 Moreover, the municipality of Stockholm has
not adjusted fees to reach the goal of 15 percent free curbside spaces, even though it is a goal set by
1 Which may also depend on the different definitions of parking demand used, as indicated by Lehner and Peer (2019) who provide a comparison of price elasticities of parking occupancy, parking dwell time and parking volume, where the first elasticity should in theory equal the two latter elasticities.
2 A few streets in the most central parts of this area experienced an increase in fees, while the number of hours per day when fees apply were extended in the entire CBD (these changes started to be implemented as of April 1, 2017).
4 the municipality (Stockholm city (2016)). Measures indicate occupancy rates at 88 per cent and 93 per cent in the CBD during September-October in 2016 and 2018, respectively (Eliasson (2019). Given this choice, the best policy regime for garages is not obvious. For Stockholm and some other cities in Europe where significant shares of parking facilities in garages are owned by the city, there is a choice to be made about which goals should govern the management of the parking facilities. The city could consider a range of objectives such as revenue maximization, maximum capacity utilization, or some second-best policy including favoring citizens of the city with resident parking fee rebates. In any case, information on the price sensitivity of parking demand is an important step towards these goals. For some of these policies, the manager and the municipality could thus benefit from having information on the price sensitivity of garage (and curbside) parking demand at different locations.
In this paper, we also estimate elasticities for different duration intervals as motorists may behave differently to changes in fees depending on the duration interval they sort into, as shown by for example Kobus et al. (2013). We are not able to test to which extent individuals within a duration interval choose not to use the garage when the fee increases, or to which extent the fee increase implies that individuals within a duration interval choose shorter durations and thus sort into shorter duration intervals. However, estimates on the different duration intervals can still be informative with respect to effects the increase in fees has on the intensive margin (parking duration) and on the extensive margin (frequency; the decision to park). Specifically, differentiating between these effects and different durations intervals may be important as an increase in parking fees may create shorter parking durations but can increase traffic as there are more parking spaces available. This was for example shown by the model by Glazer and Niskanen (1992) and by Nourinejad and Roorda (2017), and also highlighted by Shoup (2005).3 Thus, the effect may be negative on the intensive margin
(especially for longer duration intervals) while it may be positive on the extensive margin (especially for shorter durations). Still, it should be noted that, even if we find such effects, we are not able to test if this is due to the effect proposed by Glazer and Niskanen (1992) and Nourinejad and Roorda (2017), as we do not have information on occupancy rates (the reason for this is that the garages have fee
3 The intensive and extensive margin was also an important feature in the demand model for parking by Zakharenko (2016), proposing that the socially optimal relationship between arrival rate and occupancy rate is negative (with a lower shadow price of parking when fewer searchers arrives, implying a higher optimal occupancy rate), while the optimal relationship is positive in a model by Arnott (2014), which does not include the intensive margin of parking demand.
5 caps for mornings, evenings and 24-hour periods, where individuals may leave the garage several hours prior to the purchased parking time has been reached, which is not indicated by our transaction data).4
The contribution of our paper lies mainly in estimating price elasticities for parking garages experiencing a price increase, using a rich transaction micro data set and considering both the purchased parking hours and the frequency of purchased parking time. The elasticities are estimated for different garages, as such differentiated estimates can be required for an efficient parking policy, especially since the garage manager in Stockholm claims that the demand for parking varies considerably between locations and is influenced by changes in residential patterns, local business and employment. It is important to note that the fees for curbside parking within the area of the garages are kept constant during the studied period. Hence, this paper provides elasticity estimates for garage parking that are not influenced by other curbside parking fee changes.
The structure of the paper is as follows. Section 2 presents the data and some further institutional background. Section 3 presents the estimated models. The results are presented in section 4. A discussion and conclusion is provided in section 5.
2. The parking market in Stockholm and data description
The parking market in Stockholm consists of curbside parking (which with few exceptions is owned by the municipality), parking lots and parking garages that can be either publicly or privately owned. The privately owned facilities are to a large extent outdoor facilities or garage parking with a sizeable share of the use paid as subscriptions per month, while the municipality’s parking facilities – managed by the publicly owned company Stockholm Parkering – have fees per hour (usually with fee caps for evenings and nights and 24-hour periods: this is further described below).5 According to the Stockholm city
webpage6 there are more than 77.000 parking spaces in Stockholm city. Stockholm Parkering manage
and own more than 65.000 spaces (Stockholm Parkering 2018) and a large share of garage parking in Stockholm. Hence, the municipality of Stockholm dominates the market for short-term parking in garages and can influence the cruising for parking via its garage fees. Nevertheless, the municipality of Stockholm increased the garage fees in January 13, 2017, which in theory could increase the cruising
4 Individuals leaving early when reaching the fee caps is likely to be common considering that the fee cap during mornings and evenings are reached after around 1 hour, giving a purchased parking time up to 8 hours, while the 24-hour fee cap is reached after around 4 hours.
5 Some employers in Stockholm provide free or subsidised parking (the employees are however taxed for this benefit).
6 for curbside parking. Before this increase, the municipality of Stockholm had decided to change the fees for curbside parking, but the implementation of these new curbside parking fees started in April 2017 in the central business district (CBD) of Stockholm – that is, the location of the garages in our dataset. Hence, there was no change in fees for curbside parking close to the garages in our study and during the period that our dataset covers (January 2016 to March 2017).7
The data for the number of parked cars, the duration of purchased parking time and the amount paid for parking has been obtained from the City of Stockholm’s parking company, Stockholm Parkering. Our dataset comprises transaction data for seven publicly owned parking garages in the CBD of Stockholm during two time periods, namely January 1st to March 31st, 2016 and January 1st to March
31st, 2017. The parking garages are named with respect to their location in the city (name of street or
area): David Bagare, Kungsbron, Medborgarplatsen, Norra Real, S:t Eriksplan, Strandbergsdäcket, and Vartofta. The unit of observation is the daily parking transactions in each duration class in each garage. There are also privately owned parking garages in the CBD, but all but one garage have only monthly (or longer) subscriptions, thus targeting the commuters or residents (the exception have monthly subscriptions but also offer short-term parking at SEK 114 per hour, which is significantly higher than the fees in the garages comprising our dataset). We were not able to obtain data from these garages. We do not have access to transaction data for curbside parking or information on search costs. In fact, accurate data on parking on each street in Stockholm is not possible to generate from transaction data as transactions are only accounted for by (larger) parking zones. However, we note that there is a significant difference in costs between curbside parking and garage parking in downtown Stockholm. In January 2016 to March 2017, the daytime curbside fee was SEK 41 per hour in the most central zone of Stockholm, SEK 26 per hour in the rest of downtown Stockholm while the garages in our dataset had a fee between SEK 40 to SEK 70 per hour during this period. The fact that garage parking is more expensive than curbside parking could indicate that search costs and cruising for parking was not a big problem during this period (that is, and indication of low occupancy rates). However, recent surveys commissioned by the city (Eliasson (2019)) show that the degree of occupancy in the inner city of Stockholm was above 85 percent in more than 76 percent of the examined streets, despite that the municipality has a goal that prices should be set so that 15 percent of curbside parking spaces are free at all times. The impact of increased fees for garage parking is thus warranted, as this could potentially result in more cruising for parking.
7 There is however an annual mark-up that follows consumer price index which increase with less than 2 per cent between 2016 and 2017.
7 When estimating the price elasticity of demand, one has to consider a possible endogeneity as the prices set are often dependent on the quantity demanded and vice versa, meaning that both variables are jointly determined which creates simultaneity bias. An increase in parking fees may thus differ between garages depending on the parking time demanded. We therefore restrict our analysis to garages that had the same percentage increase in parking fees (25 per cent) between 2016 and 2017. This means that we exclude two parking garages (David Bagare and Strandbergsdäcket) which had a 21 per cent and 33 per cent increase in (hourly) fees, respectively (the issue of endogeneity bias is further discussed in section 3.1). In total, we make use of 73 824 purchased parking transactions from the five garages, comprising 88 859 hours of purchased parking time.
The parking fees during the periods in our dataset are presented in Table 1, showing that the garages have fee caps that apply during evenings and nights. Moreover, there is also a fee cap that applies during all hours of the day. Hence, the parking fees are non-linear, depending on the time of the day and the parking duration.
Table 1. Parking fees (SEK), with new levels from 13th January 2017 in parenthesis.
Parking garage
Fee Fee caps and time during the day when applied
00:00-08:00 18:00-24:00 18:00-07:00 00:00-24:00 David Bagare 70 (85) 50 (50) 50 (50) - 280 (320) Kungsbron 60 (75) 50 (50) 50 (50) - 240 (280) Medborgarplatsen 40 (50) 50 (50) 50 (50) - 190 (200) Norra real 40 (50) 50 (50) 50 (50) - 200 (250) S:t Eriksplan 40 (50) 50 (50) 50 (50) - 200 (250) Vartofta 40 (50) 50 (50) 50 (50) - 190 (200) Strandbergsdäcket 30 (40) - - 30 (30) 100 (150)
We choose to analyse the price elasticities for parking during daytime, which is at 08:00 to 18:00 for the garages included in the estimations, considering that curbside fees do not have fee caps and that we aim at estimating elasticities that may be used as proxies for curbside parking (acknowledging that there can be a shift parameter corresponding to the willingness to pay a premium for curbside parking). During this time of the day, the fee caps for parking during evenings and nights do not apply. However, there is a fee cap that applies to all hours during the day (see last column in Table 1). This means that the duration for when the regular hourly fee applies varies before and after the fee increase and between the parking garages. Specifically, the duration before the fee cap is reached varies between
8 3 hours 44 minutes up to 5 hours.8 In order to only compare prices and elasticities for the same time
period and the same durations, we restrict the analysis to durations shorter than 3 hours 44 minutes. Using duration intervals per day as the time unit, and with five garages observed for 181 days (January 1 to March 31 in 2016 and 2017), we have 3620 observations available. Descriptive statistics of the purchased parking hours per day and garage during daytime, together with the frequencies of the purchases within each duration, are presented in Table 2. The duration intervals we use are 0 to 60 minutes, 60 to 120 minutes, 120 to 180 minutes and 180 to 224 minutes.
The mean of the total purchased parking hours, with a duration that ranges between 0 to 224 minutes, is about 107 hours per day and garage prior to the fee increase, and 87 hours after the fee increase. Standard deviations at 119 hours and 78 hours before and after the fee change indicates a local variation in the demand for parking. Similar changes are found for the frequencies of purchased parking.
Table 2. Descriptive statistics: Purchased parking hours and parking frequencies per day and garage, before the fee increase and after the fee increase.
Purchased parking hours, per day and garage
Before fee increase (515 obs. per interval) After fee increase (390 obs. per interval) Duration intervals (min) Mean St. dev. Min Max Mean St. dev. Min Max (0–60) 14.18 17.95 0.00 78.38 12.89 13.78 0.01 71.46 [60–120) 38.46 44.45 0.00 194.85 32.26 29.54 0.00 123.84 [120–180) 33.66 38.68 0.00 186.98 26.17 24.63 0.00 187.38 [180–224) 20.51 22.64 0.00 129.00 15.49 15.59 0.00 98.59 Total: (0–224) 106.81 118.91 0.00 461.38 86.80 78.35 2.44 445.35
Frequencies of purchased parking, per day and garage
Before fee increase (515 obs. per interval) After fee increase (390 obs. per interval) Duration intervals (min) Mean St. dev. Min Max Mean St. dev. Min Max (0–60) 36.51 47.71 0.00 210.00 32.74 35.82 1.00 169.00 [60–120) 29.14 34.40 0.00 153.00 24.16 22.91 0.00 97.00 [120–180) 15.29 17.70 0.00 84.00 11.84 11.31 0.00 85.00 [180–224) 6.64 7.46 0.00 45.00 4.89 4.91 0.00 31.00 Total: 0–224 87.59 104.49 0.00 432.00 73.63 71.49 2.00 330.00
8 Cars that parked in Strandbergsdäcket prior to the fee increase reached the fee cap after 3 hours 20 minutes. However, this parking garage and David Bagare are excluded from the analysis because their percentage increase in fees were different from the other five parking garages (in that way we avoid problems with endogeneity bias in the estimations; see section 3).
9 The variations over time are illustrated in Figure 1, where total purchased parking hours (all garages) for each day during the periods January 1 to March 31, 2016 and January 1 to March 31, 2017 are presented. This variation and its pattern are mainly due to the lower levels of parking durations during weekends and holidays: the average parking hours per day is 554 during weekdays while the weekends (including holidays) have an average of 343 parking hours. The weekend days and the holidays may therefore be an important control variable in the model estimations, considering that the number of weekends or holidays differ between the periods before and after the fee increase (see Table 4).
Figure 1. Total purchased parking hours during daytime (08:00-18:00) and averages before and after the increase in fees (sum of all parking garages).
With information on changes in fees and purchased parking time, we can calculate log arc elasticities for the individual parking garages, which are presented in Table 3.9 The elasticities vary between -1.72
to 0.60, with a mean value at -0.93.
9 The formula is ln(ℎ2)−ln(ℎ1)
ln(𝑝2)−ln(𝑝1) (see for example Vázquez (1998). As expected, this generates elasticities very similar to the midpoint arc elasticity that was proposed by Allen (1934) 0.5(ℎ0.5(𝑝2−ℎ1)(𝑝2+𝑝1)
2−𝑝1)(ℎ2+ℎ1). 0 100 200 300 400 500 600 700 800 900 2016-01-01 2016-01-07 2016-01-13 2016-01-19 2016-01-25 2016-01-31 2016-02-06 2016-02-12 2016-02-18 2016-02-24 2016-03-01 2016-03-07 2016-03-13 2016 -03 -19 2016-03-25 2016-03-31 2017-01-06 2017-01-12 2017-01-18 2017-01-24 2017-01-30 2017-02-05 2017-02-11 2017-02-17 2017-02-23 2017-03-01 2017-03-07 2017-03-13 2017-03-19 2017-03-25 2017-03-31 Tot al p ark ing h ou rs
Purchased parking hours Average before fee increase Average after fee increase
10 Table 3. Log arc elasticities
Average purchased parking time per day (hours)
Parking garage Before fee increase After fee increase Log Arc Elasticity
Kungsbron 41.05 37.55 -0.40 Medborgarplatsen 319.49 217.61 -1.72 Norra Real 87.83 100.40 0.60 S:t Eriksplan 54.76 54.92 0.01 Vartofta 30.91 23.52 -1.22 Total 534.04 434.01 -0.93
The aim is to estimate point elasticities (𝜕ℎ𝜕𝑝𝑝ℎ) from a functional relationship between purchased parking (ℎ) and fees (𝑝), controlling for confounders – that is, variables that influence parking fees and also parking durations. For example, Figure 1 indicates that a variable for the number of weekends and holidays can be important in the estimations. Descriptive statistics of the garage characteristics, month, type of day and weather are presented in Table 4.
Table 4. Descriptive statistics: Garage characteristics, trends and weather variables, before fee increase and after fee increase.
Before fee increase (515 obs.) After fee increase (390 obs.)
Variable Mean St. dev. Min Max Mean St. dev. Min Max Garage characteristics
No. of parking spots per garage 210.60 61.82 150.00 306.00 210.60 61.84 150.00 306.00 Parking fee, SEK per hour 44.00 8.01 40.00 60.00 55.00 10.01 50.00 75.00 Month, type of day
January (dummy variable) 0.42 0.49 0.00 1.00 0.24 0.43 0.00 1.00 February (dummy variable) 0.28 0.45 0.00 1.00 0.36 0.48 0.00 1.00 March (dummy variable) 0.30 0.46 0.00 1.00 0.40 0.49 0.00 1.00 Weekdays (dummy variable) 0.69 0.46 0.00 1.00 0.72 0.45 0.00 1.00 Weekend or holiday (dummy variable) 0.31 0.46 0.00 1.00 0.28 0.45 0.00 1.00 Weather
Temperature, degrees Celsius -0.64 4.84 -13.89 6.59 1.40 3.03 -4.44 11.49 Precipitation, mm 1.12 1.95 0.00 10.75 0.77 2.00 0.00 11.92 Day with rain or sleet (dummy variable) 0.20 0.40 0.00 1.00 0.15 0.36 0.00 1.00
11 3. Model
To estimate the price elasticity of demand, we consider the purchased parking hours ℎ𝑖𝑡 and parking frequencies 𝑓𝑖𝑡 in garage 𝑖 in time period 𝑡 to be given by
ℎ𝑖𝑡 = 𝑔(𝑝𝑖𝑡, ∑ 𝑥𝐾𝑘 𝑘𝑖𝑡), and
𝑓𝑖𝑡 = 𝑔(𝑝𝑖𝑡, ∑ 𝑥𝐾𝑘 𝑘𝑖𝑡) (1)
where 𝑝𝑖𝑡 is the fee for parking and 𝑥𝑘𝑖𝑡 is a vector of control variables, that is, other factors explaining the purchased parking hours and frequencies. The time periods considered comprise in total 181 days, where 91 days are January 1 to March 31 in 2016 and the next 90 days are January 1 to March 31 in 2017 (note that 2016 was a leap year). Based on the equation for purchased parking hours, we aim at estimating the effect parking fees have on the sum of the effects on the decision to park and on the decision for how long to park (effects on the extensive and intensive margin, respectively). To estimate its impact on the extensive margin, we consider the frequencies of parking, 𝑓𝑖𝑡 in equation (1). An econometric approach is used to estimate these effects. In this case for purchased parking hours, we use a double-log specification
𝑙𝑛ℎ𝑖𝑡 = 𝛼𝑖+ 𝛽𝑙𝑛𝑝𝑖𝑡+ ∑ 𝛾𝐾𝑘 𝑘𝑥𝑘𝑖𝑡+ 𝜀𝑖𝑡 (2)
where 𝛼𝑖 are garage fixed effects, 𝛽 and 𝛾𝑘 are parameters to be estimated, and 𝜀𝑖𝑡 is the error term. All our control variables (𝑥𝑘𝑖𝑡) in the estimations are dummy variables.
The frequency of parking is a discrete variable (count-data) with a distribution that is skewed right. Figures 2 and 3 below are histograms of purchased parking time and parking frequencies, respectively.
12 Figure 2: Histogram of purchased parking hours per day and garage.
13 Hence, for frequencies of parking (extensive margin), we consider a count data model in which the dependent variable is untransformed. We use the negative binomial regression model.10 Specifically,
we consider the probability of a parking frequency, given our set of control variables and a dispersion parameter 𝜑𝑖 (𝑃[𝑓𝑖𝑡│𝑙𝑛𝑝𝑖𝑡, ∑ 𝑥𝑘𝐾 𝑘𝑖𝑡, 𝛼𝑖, 𝜑𝑖]).11 The conditional mean of our count data model is
𝐸[𝑓𝑖𝑡│𝑙𝑛𝑝𝑖𝑡, ∑ 𝑥𝐾𝑘 𝑘𝑖𝑡, 𝛼𝑖] = 𝛼𝑖𝑒𝑥𝑝(𝛽𝑙𝑛𝑝𝑖𝑡)𝑒𝑥𝑝(∑ 𝛾𝐾𝑘 𝑘𝑥𝑘𝑖𝑡) (3)
where 𝛼𝑖 is the garage-specific effect. The negative binomial model is estimated with random effects, as Allison and Waterman (2002) found that the conditional fixed effects negative binomial model, proposed by Hausman et al. (1984), is not a true fixed effects estimator. However, we include dummy variables for the garages 𝑑𝑖 to control for garage fixed effects: 𝛼𝑖 = exp(𝛿𝑖𝑑𝑖).
To estimate the effect on the durations of those who choose to park (intensive margin), we use the purchased parking hours 𝑙𝑛ℎ𝑖𝑡 as the dependent variable and include the frequencies of parking 𝑙𝑛𝑓𝑖𝑡 as an explanatory variable.
𝑙𝑛ℎ𝑖𝑡 = 𝛼𝑖+ 𝛽𝑙𝑛𝑝𝑖𝑡+ ∑ 𝛾𝑘𝐾 𝑘𝑥𝑘𝑖𝑡+ 𝜇𝑙𝑛𝑓𝑖𝑡+ 𝜀𝑖𝑡 (4)
With a parameter estimate of 𝜇 equal to 1, it is similar to using 𝑙𝑛(ℎ𝑖𝑡
𝑓𝑖𝑡) as the dependent variable (however, as suggested by for example Kronmal (1993), we refrain from using such a ratio as the dependent variable). Adding the effects on the intensive margin in equation (4) with the effects on the extensive margin in equation (3), we can make a comparison with the estimates from equation (2). To test if there are differences in price elasticities between the parking garages, we use interactions between the fee variable and garage dummy variables.
10 We also tested the Poisson model with conditional fixed effects (and cluster robust standard errors), which did not perform as well as the negative binomial model: the Poisson model for frequencies with durations between 0 to 224 min had higher Akaike and Bayesian information criterions (AIC and BIC) – 14433.73 and 14477 compared to 8122.4 and 8199.3 – and its coefficient of determination (R2), based on regressing fitted values against observed values, was slightly lower (0.25 compared to 0.28).
11 The dispersion parameter is used to control for overdispersion, that is, when the the conditional mean is not equal to the conditional variance.
14 𝑙𝑛ℎ𝑖𝑡 = 𝛼0+ 𝛽𝑙𝑛𝑝𝑖𝑡+ ∑ 𝛾𝐾𝑘 𝑘𝑥𝑘𝑖𝑡+ 𝛿𝑖𝑑𝑖+ 𝜃𝑖𝑙𝑛𝑝𝑖𝑡𝑑𝑖+ 𝜀𝑖𝑡 (5)
where 𝑑𝑖 is a dummy variable for (all but one of) the garages (𝛼0 is the parameter for the baseline garage). The garage dummy variables and their interaction with 𝑙𝑛𝑝𝑖𝑡 is also included in equations (3) and (4) to test if effects on the extensive margin and the intensive margin, respectively, varies between the garages.
In the estimations, we consider different time intervals for the purchased parking time and parking frequencies. That is, we estimate our models for parking times between 0 and 60 minutes, 60 and 120 minutes, 120 and 180 minutes, 180 and 224 minutes. This implies that we have a (varying) number of observations with zero values, that is, with no parking purchased in a garage on a certain day and during a certain time interval. Specifically, using the natural logarithm, we lose 7, 17, 33, and 130 observations for the respective duration intervals. There is thus reason to consider a linear-log model in the estimations, especially for the duration interval 180 to 224 minutes which has 130 observations with no purchased parking time.
To sum up, we use equation (2) to estimate the effect the fee increase has on the number of purchased parkin hours (sum of effects on the extensive and intensive margin) and equation (3) to estimate the effect on the decision to park (effect on the extensive margin). Moreover, to estimate the effect on the intensive margin, we use equation (4) with 𝑙𝑛ℎ𝑖𝑡 as the dependent variable and 𝑙𝑛𝑓𝑖𝑡 as an explanatory variable. Garage-specific effects of the fee increase are estimated using interaction terms between 𝑙𝑛𝑝𝑖𝑡 and 𝑑𝑖 in equations (2)-(4). The models estimated are summarized in Table 5.
Table 5. Models estimated. Model Dependent
variable
Explanatory variables
Estimated effects due to fee increase
1 𝑙𝑛ℎ𝑖𝑡 𝑙𝑛𝑝𝑖𝑡, ∑ 𝑥𝐾𝑘 𝑘𝑖𝑡, Sum of effects on extensive and intensive margin
2 𝑓𝑖𝑡 𝑙𝑛𝑝𝑖𝑡, ∑ 𝑥𝐾𝑘 𝑘𝑖𝑡, 𝑑𝑖 Decision to park (extensive margin)
3 𝑙𝑛ℎ𝑖𝑡 𝑙𝑛𝑝𝑖𝑡, ∑ 𝑥𝐾𝑘 𝑘𝑖𝑡, 𝑙𝑛𝑓𝑖𝑡 Average duration (intensive margin)
4 𝑙𝑛ℎ𝑖𝑡 𝑙𝑛𝑝𝑖𝑡, ∑ 𝑥𝐾𝑘 𝑘𝑖𝑡, 𝑑𝑖, 𝑙𝑛𝑝𝑖𝑡𝑑𝑖 Garage-specific fee effects in Model 1
5 𝑓𝑖𝑡 𝑙𝑛𝑝𝑖𝑡, ∑ 𝑥𝐾𝑘 𝑘𝑖𝑡,𝑑𝑖, 𝑙𝑛𝑝𝑖𝑡𝑑𝑖 Garage-specific fee effects in Model 2
15 3.1 Endogeneity in parking fees
There is reason to believe that the fee for parking is endogenous; the total purchased parking hours in a parking garage affects the fee that is set and vice versa, meaning that both variables are jointly determined (which creates simultaneity bias). Differences in fees between parking garages that are set with respect to time-invariant factors can be captured by the parking garage fixed effects (or other control variables affecting the purchased parking time). However, situations in which the fee is set as a response to the purchased parking time (the demand) within a parking garage creates a problem for the estimation; 𝑙𝑛𝑝𝑖𝑡 will in this case be correlated with the error term 𝜀𝑖𝑡. Indeed, it is reasonable to assume that the parking garage owner Stockholm Parkering (to some extent) is responsive to the demand of their parking spots and change their fees accordingly. In fact, the stated aim of the Stockholm Parkering is to decrease the search costs and the number of cars parked at the curb sides, as well as have a high occupancy rate at the parking garages (Stockholm Parkering 2018). For example, David Bagare is the parking garage in our dataset with the highest fees. Stockholm Parking had the choice to increase its fees with either a lower, similar or higher percentage than the other parking garages downtown. A similar increase (25 per cent) would imply that the new fee would be (SEK 70*1.25=) SEK 87.5. If the parking garage owner wants to avoid decimals and fees between intervals of SEK 5, the increase had to be either lower or higher, for example 21.4 per cent or 28.6 per cent (that is, a new fee at either SEK 85 or SEK 90). The owner chose the former, resulting in an hourly fee at SEK 85. The reason for this choice might be due to a relatively low occupancy rate and/or problems with search costs in its surroundings – that is, the demand for parking in the garage. Hence, the “power” of the treatment is different in this garage compared to the other garages in our sample.
The purchased parking in our first time period (January to March 2016) may thus influence the decision on whether a parking garage will have a fee increase (selection bias) as well as the level of the fee increase. As a proper instrument for parking fees is not available to us, we restrict our analysis to parking garages with the same percentage increase in fees during daytime (25 per cent). To the extent that the choice of the new fee was due to the parking demand, it generated the same percentage increase in parking fee in these garages. In that way, we consider our estimations to be less affected by problems with simultaneity bias, however, we acknowledge that we still may have problems with selection bias.
16 4. Results
The estimation results are presented in Tables 6 to 9. The double-log models are estimated using the fixed effects estimator accounting for first order autocorrelation in the error terms (AR(1)), as we cannot reject the null hypothesis of no first order autocorrelation (F(1, 4) = 39.790, Prob>F = 0.0032) according to the Wooldridge (2002) test for panel data. The models were also estimated using a linear-log specification. However, a residual plot indicates presence of heteroskedasticity when using the linear-log specification. Moreover, the log-log specification of our preferred Model 1c (see Table 6 below) has a lower AIC and BIC (1556.8 and 1585.6 compared to 3242.2 and 3271.0) and a better model fit as measured by the coefficient of determination, R2 (0.20 compared to 0.12). Hence, we
prefer the log-log specification to the linear-log specification. Still, we note that dropping observations with a zero value of parking durations and frequencies (due to the log-transformation) may bias the results. Hence, the point estimates for the longest duration intervals using the log-log specification should be interpreted with care (note that we only lose 3 observations out of 905 when combining the duration intervals, while we lose 130 observations when considering the duration interval 180 min to 224 min).
Considering that the frequencies are count data with a distribution skewed right (see Figure 2b), the negative binomial regression is our preferred model for estimating effects on the extensive margin. Effects on the intensive margin are estimated using the log-log specification (equation 4). All estimations are carried out with Stata 12 (StataCorp. 2011).
In Table 6, we report estimations of equation (2) with successive expansion of the control dummies using 902 observations from the selected five garages (out of the 905 observations, 3 had zero purchased parking time and are dropped due to the logarithmic transformation). Five observations are dropped due to the estimator accounting for first order autocorrelation. In the same table, we also report estimations of equation (3), that is, estimations on parking frequencies using the negative binomial regression model.
The price elasticity of demand for parking hours changes slightly from -0.5635 to -0.6279 when dummy variables for month and for weekends and holidays are included. Considering that weather may have an impact on the propensity to use the car instead of other modes of transport (and varies between the periods before and after the increase in garage fees), we included a dummy variable for rain or sleet. The parameter estimate is significant and positive, and the inclusion of this variable changes the elasticity for fees slightly, which is -0.6021 (p-value 0.027). We have similar results for the effects on the extensive margin, yet, with somewhat lower elasticities (in absolute terms). The price elasticity in the preferred Model 2c is -0.4544 (p-value 0.001).
17 Table 6. Estimation results, Models 1a-1c (total parking hours per day and garage) and Models 2a-2c (parking frequencies).
F.E. estimator AR(1) disturbances Total parking hours
(intensive and extensive margin)
Model 1a Model 1b Model 1c
Coef. Std. Err. Coef. Std. Err. Coef. Std. Err. Constant 3.0553*** 0.7640 3.4867*** 0.6458 3.3764*** 0.6453 ln(fee) -0.5635* 0.3345 -0.6279** 0.2712 -0.6021** 0.2710 D.Feb - - 0.2010*** 0.0745 0.1960*** 0.0744 D.Mar - - 0.0197 0.0741 -0.0010 0.0746 D.Weekend/Holiday - - -0.8550*** 0.0438 -0.8546*** 0.0438 D.rain or sleet - - - - 0.1042** 0.0488 No. of observations 897 897 897
Neg. bin. regression, R.E. Parking frequencies (extensive margin)
Model 2a Model 2b Model 2c
Coef. Std. Err. Coef. Std. Err. Coef. Std. Err. Constant 4.1895*** 0.5641 4.0020*** 0.5524 3.8117*** 0.5562 ln(fee) -0.5162*** 0.1397 -0.5009*** 0.1366 -0.4544*** 0.1374 D.Feb - - 0.2086*** 0.0337 0.2009*** 0.0337 D.Mar - - 0.0413 0.0342 0.0143 0.0355 D.Weekend/Holiday - - -0.5180*** 0.0407 -0.5226*** 0.0409 D.rain or sleet - - - - 0.1026*** 0.0353
Garage dummies Yes Yes Yes
No. of observations 905 905 905
***, **, *: Significance at the 1%, 5%, 10% level
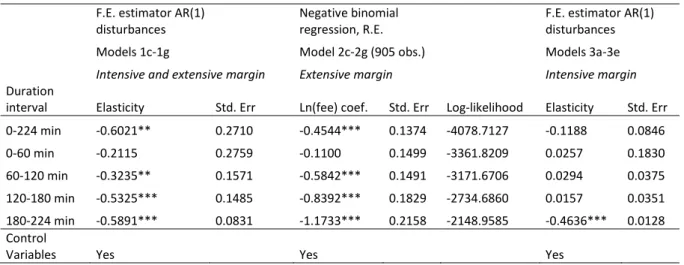
In Table 7, the estimated coefficients for parking fees for each subset of parking durations are presented together with estimates for the total duration interval (0-224 minutes, i.e. estimates from Model 1c and Model 2c), using the data from the five selected garages and the same control variables as in Models 1c and 2c. Complete estimation results are presented in Table 10 and 11 in the Appendix. Here, it can be noted that the number of observations decrease with the duration intervals. When estimating the effects on parking frequencies (the decision to park), we use the negative binomial regression in which the dependent variable is untransformed (hence, we do not lose observations), which shows that effects on the extensive margin are statistically significant (except for the duration interval 0 to 60 min).
The most important finding in Table 7 is that the price elasticity of demand is successively higher for the longer durations than for the shorter durations. The price elasticity for each duration class is statistically significant when considering the impact on parking demand (total parking hours, models 1c-1g, and parking frequencies, models 2c-2g), except for the shortest duration. When only considering
18 effects on the intensive margin (models 3a-3e), most of the elasticities are not statistically significant, except for the longest duration interval.
Table 7. Estimation results, intensive and extensive effects for different duration intervals. F.E. estimator AR(1)
disturbances
Negative binomial regression, R.E.
F.E. estimator AR(1) disturbances Models 1c-1g Model 2c-2g (905 obs.) Models 3a-3e
Intensive and extensive margin Extensive margin Intensive margin
Duration
interval Elasticity Std. Err Ln(fee) coef. Std. Err Log-likelihood Elasticity Std. Err 0-224 min -0.6021** 0.2710 -0.4544*** 0.1374 -4078.7127 -0.1188 0.0846 0-60 min -0.2115 0.2759 -0.1100 0.1499 -3361.8209 0.0257 0.1830 60-120 min -0.3235** 0.1571 -0.5842*** 0.1491 -3171.6706 0.0294 0.0375 120-180 min -0.5325*** 0.1485 -0.8392*** 0.1829 -2734.6860 0.0157 0.0351 180-224 min -0.5891*** 0.0831 -1.1733*** 0.2158 -2148.9585 -0.4636*** 0.0128 Control
Variables Yes Yes Yes
***, **, *: Significance at the 1%, 5%, 10% level
Did the average parking duration change due to the increase in parking fees? The elasticity for total parking hours being -0.60 (Model 1c), while it is -0.45 for the decision to park (Model 2c), suggests that the average parking duration decreased as a result of the fee increase. Indeed, the elasticity is -0.1188 for the effects on the intensive margin (yet, not statistically significant), and is rather close to the difference between the estimates -0.60 and -0.45. Hence, the average parking duration seems to have decreased as a result of the increase in parking fees, an effect that is attributed to the highest duration interval (180-224 min), with an elasticity at -0.4636 that is statistically significant.
Considering that we lose observations when using the log-transformation, the estimates in Models 1d-1g may be biased, while the effects on the intensive margin that only concerns the impact on those who choose to park do not suffer from this bias, as well as the effects on the extensive margin estimated with the negative binomial model. Adding the effects on the intensive margin to the effects on the extensive margin, suggests a parking demand elasticity at (-0.1188+-0.4544=) -0.5732, while it is (0.0257+-0.1100=) -0.0844 for durations between 0 and 60 min, (0.0294+-0.5842=) -0.5548 for durations between 60 and 120 min, (0.0157+-0.8392=) -0.8235 for durations between 120 and 180 min, and (-0.4636+-1.1733=) -1.6369 for the durations between 180 and 224 min.
We consider that our elasticities of demand for garage parking (purchased parking hours) can be used as proxies for the elasticities of demand for curbside parking by acknowledging that there is a willingness to pay a premium for parking on streets compared to parking in garages. In for example Kobus et al. (2013), the estimated willingness to pay a premium for curbside parking varies between €
19 0.37 to € 0.60), while it was € 0.55 per euro increase in fees in Gragera and Albalate (2016) who also use purchased parking hours in their estimations. To calculate a proxy for a curbside parking price elasticity, we consider our average elasticity estimate at -0.60. With EUR 1 = SEK 10, the curbside premium is SEK 0.55 per SEK 1 increase. Using semi-elasticities, we have 𝜕𝑙𝑛ℎ
𝜕𝑝 = −0.6 and 𝜕𝑙𝑛ℎ 𝜕𝑝∙1.55= 𝜖, where 𝜖 is the curbside parking (semi-)elasticity. Hence, we have −0.6 = 𝜖 ∙ 1.55, and thus 𝜖 = −0.39.
4.1 Estimates per garage
To estimate the price elasticity of demand for each garage, we include dummy variables and interaction terms with 𝑙𝑛𝑝𝑖𝑡 for all but one garage. The coefficients for the interaction terms (𝜃𝑖) are estimated relative to the coefficient 𝛽 for 𝑙𝑛𝑝𝑖𝑡, and the estimate per garage is thus calculated as 𝛽 + 𝜃𝑖. These estimates per garage are presented in Table 8, both for intensive and extensive margin (complete estimation results from these regressions are presented in Tables 12 to 14 in the Appendix). The price elasticities of demand for parking hours (sum of effects on the intensive and extensive margin) are negative, except for one garage (S:t Eriksplan) which has a positive, yet not statistically significant estimate. Only two garages (Vartofta and Medis) have significant estimates. Interestingly, two garages (Norra Real and S:t Eriksplan) have positive and statistically significant estimates for the decision to park.
Table 8. Effects per garage, durations between 0-224 min.
F.E. estimator AR(1) disturbances Neg. Bin. regression, R.E. F.E. estimator AR(1) disturbances
Model 4a Model 5a Model 6a
Intensive and extensive margin Extensive margin Intensive margin
Parking garage Ln(fee) coef. Std. Err. Ln(fee) coef. Std. Err. Ln(fee) coef. Std. Err. Vartofta -1.3520** 0.5938 -1.0394*** 0.2721 -0.3117* 0.1851 Kungsbron -0.0024 0.5938 -0.1038 0.3235 0.1147 0.1789 Medis -1.8733*** 0.5938 -1.5177*** 0.2069 -0.5031** 0.2021 Norra Real -0.1993 0.5097 1.0510*** 0.3342 0.0232 0.1826 S:t Eriksplan 0.3698 0.5949 0.5883** 0.2536 -0.3754** 0.1817 Estimated total effect -0.6134** 0.2621 -0.2043 0.1289 -0.2108** 0.0846
Control variables Yes Yes Yes
No. of observations 897 905 897
***, **, *: Significance at the 1%, 5%, 10% level
Turning to the estimates for the different duration intervals for each garage in Table 9 may shed some light on why some garages have positive effects on the extensive margin. The estimates show that
20 both Norra Real and S:t Eriksplan have negative and statistically significant effects for the longest duration interval (180 min to 224 min), while the effect for the shortest duration is positive (yet not statistically significant; note also that S:t Eriksplan has positive effects on the decision to park for all but the longest duration interval). The effects on the decision to park (extensive margin) for these garages are positive and statistically significant for the shortest duration interval (1.08 for Norra Real and 1.05 for S:t Eriksplan), while the effects are smaller and not statistically significant for the longest duration interval (0.40 for Norra Real and -0.48 for S:t Eriksplan). The estimation results show that there are negative effects on total parking hours for the longest duration interval, while there are positive effects on the decision to park (extensive margin) for the shortest duration interval. This pattern may be an indication of an effect similar to the results in Glazer and Niskanen (1992) – that is, the decrease in parking hours in the longest duration interval created an increased availability in parking spaces, which in turn may have generated an increase in the number of short-term parking purchases in these garages. We asked managers at Stockholm Parkering if they had indicators of occupancy to see if these were in line with the estimated patterns between the total purchased parking hours and frequencies of parking due to the price increase, or if there were other circumstances that could explain the observed responses. The answer we got was that Stockholm Parkering does not have such data on occupancy.
In general, the other garages follow the pattern of increasing elasticities (in absolute terms) for longer duration intervals, which is in line with findings in Kobus et al. (2013). Moreover, the results at this level of resolution supports the notions suggested by the management of Stockholm Parkering: The demand for parking varies considerably between locations and is influenced by changes in residential patterns, local business and employment.
21 Table 9. Effects on demand for total parking hours and effects on the decision to park, per garage and for different duration intervals.
Effects on total parking hours (sum of effects on the intensive and extensive margin) - F.E. estimator with AR(1) disturbances
Model 4b Model 4c Model 4d Model 4e
0-60 min 60-120 min 120-180 min 180-224 min
Parking garage Ln(fee) coef. Std. Err. Ln(fee) coef. Std. Err. Ln(fee) coef. Std. Err. Ln(fee) coef. Std. Err. Vartofta -0.2032 0.6267 -1.1193*** 0.4339 -1.0866*** 0.3294 -0.4628*** 0.1357 Kungsbron -0.6109 0.5423 0.0456 0.2407 -0.4240* 0.2393 -0.6634*** 0.1498 Medis -1.0817 0.6673 -1.7645*** 0.4864 -2.1826*** 0.5552 -2.2619*** 0.5571 Norra Real 0.5250 0.5940 -0.5355* 0.3245 -0.5332 0.3818 -0.6318*** 0.2426 S:t Eriksplan 0.3886 0.6288 0.6841 0.4365 0.3254 0.3465 -0.5813*** 0.2003 Estimated total effect -0.1988 0.2774 -0.5466*** 0.1792 -0.7949*** 0.1756 -0.9824*** 0.1517
Control variables Yes Yes Yes Yes
No. of observations 890 880 864 767
Effects on parking frequency (extensive margin) - Negative binomial regression, R.E.
Model 6b Model 6c Model 6d Model 6e
0-60 min 60-120 min 120-180 min 180-224 min
Parking garage Ln(fee) coef. Std. Err. Ln(fee) coef. Std. Err. Ln(fee) coef. Std. Err. Ln(fee) coef. Std. Err. Vartofta -0.4627 0.3263 -1.1438*** 0.3666 -1.9323*** 0.4462 -2.3072*** 0.7270 Kungsbron 0.1663 0.3830 -0.3441 0.3824 0.0024 0.4057 -1.1823** 0.5470 Medis -1.1755*** 0.2235 -1.6382*** 0.2044 -2.0774*** 0.2685 -2.2090*** 0.3358 Norra Real 1.0814*** 0.3813 0.8815*** 0.3166 0.8900** 0.3588 0.4004 0.4291 S:t Eriksplan 1.0508*** 0.2806 0.4357 0.2848 -0.1282 0.4038 -0.4793 0.4596 Estimated total effect 0.1321 0.1481 -0.3618** 0.1444 -0.6491*** 0.1738 -1.1555*** 0.2350
Control variables Yes Yes Yes Yes
No. of observations 905 905 905 905
Log-likelihood -3336.7819 -3140.8855 -2706.2872 -2135.1573 ***, **, *: Significance at the 1%, 5%, 10% level
5. Discussion and conclusion
In this paper, we have estimated price elasticities of demand for five parking garages in Stockholm and four intervals of parking duration. The contribution lies mainly in the use of a rich transaction dataset and panel data methods in order to estimate price elasticities for individual parking garages both on the extensive and intensive margin, based on an increase in parking fees. The results show that elasticities vary considerably according to location and mostly increase (in absolute terms) with parking duration. We consider that our elasticities of demand for garage parking can be used as proxies for the elasticities of demand for curbside parking, acknowledging that there is a willingness to pay a premium for parking on streets compared to parking in garages. In for example Kobus et al. (2013), the estimated willingness to pay a premium for curbside parking varies between EUR 0.37 to EUR 0.60), while it was EUR 0.55 in Gragera and Albalate (2016) who use purchased parking hours in their estimations.
22 Specifically, using a willingness to pay a premium at EUR 0.55 per euro increase in fees (with EUR 1= SEK 10, this premium corresponds to SEK 0.55 per SEK 1 increase,) our average price elasticity for purchased parking hours in garages (0.60) translates into a price elasticity for curbside parking at -0.39.
For two parking garages, the fee increase was followed by a decrease in parking hours in the longest duration interval while the frequency of short-term parking increased. In fact, this implied an overall increase in the frequency of parking in these garages, which is in line with the predictions made in the models by Glazer and Niskanen (1992) and by Nourinejad and Roorda (2017). Still, we do not have information on the occupancy rates and can therefore not conclude if the increase in parking fees and shorter parking durations generated an increase traffic due to more parking spaces available. Moreover, it should be noted that the difference in elasticities between different duration intervals can be due to motorists choosing not to park in the garage and/or motorists choosing shorter durations and thus sort into shorter duration intervals. We are not able to test to which extent the former or latter effect is present in our data (that is, if there is a willingness to pay a premium for shorter durations or not).
Previous theoretical and empirical research from other cities suggests that the welfare optimal curbside fee should be higher than garage fees as there is a willingness to pay a premium for curbside parking (including search costs). The curbside and garage fees in the CBD of Stockholm have the opposite relationship, even though the official parking policy goal of Stockholm city being that the price parking should be set so that 15 percent of parking spaces are free at all times (Stockholm city (2016)). Indeed, recent surveys commissioned by the city (Eliasson (2019)) indicate that the degree of occupancy in the inner city of Stockholm was above 85 percent in more than 76 percent of counted streets. This is an indication of too low curbside parking fees, especially in relation to the garage parking fees. In addition, Gragera and Albalte (2016) show a strong influence from curbside parking fees on demand for garage parking. However, the implementation of new curbside parking regulation during winter and spring in 2017 (including increases in fees) was carried out after March 31st, 2017, which is
the last date of our parking data. We are therefore not able to estimate the effect of changes in curbside parking fees. This could be subject to future research.
The estimated change in demand for garage parking due to the increase in parking fees may have resulted in more cruising for curbside parking in the CBD of Stockholm, while elasticities smaller than -1 (in absolute terms) suggest that the garage manager could increase the revenue by increasing the fees. We can note that the stated objective of the municipality’s company Stockholm Parkering is to decrease search costs and the number of cars parked at the curbsides and have a high occupancy rate at the parking garages. The company does not, however, control the fees of street parking and can
23 therefore not set all the municipal parking fees. According to Eliasson (2019), the parking fees of the municipality and the municipality’s company Stockholm Parkering are not coordinated. What the optimal course of action is for Stockholm Parkering depends on what the municipality considers as its long-term goal. Here we can also note that most cities decide to allow local residents (voters) to park at reduced fees, and Stockholm is not an exception: The area with the second highest fees for residential curbside parking were SEK 75 per day and SEK 1 100 per month respectively, which is substantially less than the curbside fee for non-residentials (SEK 26 per hour).
Suggesting an optimal course for the city of Stockholm would require further information on the occupancy rates at different points in time. Now Stockholm Parkering is contemplating a further acquisition of sensors indicating occupancy. In absence of such occupancy data, Stockholm city could consider adjusting curbside parking and residential parking fees upwards where there are indications of high occupancy and the company Stockholm Parkering could consider adjusting fees in garages downwards in garages with indications of low occupancy.
References
Allen, R.G.D., 1934. The Concept of Arc Elasticiy of Demand. Review of Economic Studies, 1, 226-230. Allison, P. D., Waterman, R. P., 2002. Fixed-Effects Negative Binomial Regression Models. Sociological
Methodology. 32, 247-265. DOI: https://doi.org/10.1111/1467-9531.00117
Arnott, R., 2006. Spatial competition between parking garages and downtown parking policy. Transport Policy, 13, 458-469. https://doi.org/10.1016/j.tranpol.2006.05.003
Arnott, R., 2014. On the optimal target curbside parking occupancy rate. Economics of Transportation, 3, 133-144. DOI: https://doi.org/10.1016/j.ecotra.2014.07.001
Arnott, R., Rowse, J., 2009. Downtown parking in auto city. Regional Science and Urban Economics, 39, 1.14. https://doi.org/10.1016/j.regsciurbeco.2008.08.001
Calthrop, E., Proost, S., 2006. Regulating on-street parking. Regional Science and Urban Economics, 36, 29-48. https://doi.org/10.1016/j.regsciurbeco.2005.04.002
Concas, S., Nayak, N., 2012. A Meta-Analysis of Parking Price Elasticity. Transport Research Board 91st Annual Meeting Compendium of Papers.
Eliasson, J., 2019. Effekter av nya parkeringsavgifter i Stockholm. Presentation at Transportforum in Linköping, 9-10th January.
24 Glazer, A., Niskanen, E., 1992. Parking fees and congestion. Regional Science and Urban Economics,
22(1), pp. 123-132. DOI: https://doi.org/10.1016/0166-0462(92)90028-Y
Gragera, A., Albalate, D., 2016. The impact of curbside parking regulation on garage demand. Transport Policy, 47, pp. 160-168. DOI: https://doi.org/10.1016/j.tranpol.2016.02.002
Hausman, J., Hall, B.H., Griliches, Z., 1984. Econometric Models for Count Data with an Application to the Patents-R & D Relationship. Econometrica. 52(4), 909-938. DOI:
https://doi.org/10.2307/1911191
Inci, E., 2015. A review of the economics of parking. Economics of Transportation, 4, 50-63.
http://dx.doi.org/10.1016/j.ecotra.2014.11.001
Kobus, M.B.W., Gutiérrez-i-Puigarnau, E., Rietveld, P., Van Ommeren, J.N., 2013. The on-street parking premium and car drivers’ choice between street and garage parking. Regional Science and Urban Economics, 43, 395-403. http://dx.doi.org/10.1016/j.regsciurbeco.2012.10.001
Kronmal, R.A., 1993. Spurious correlation and the fallacy of the ratio standard revisited. Journal of the Royal Statistical Society. Series A, 156(3), 379-392. DOI: https://doi.org/10.2307/2983064
Lehner, S., Peer, S., 2019. The price elasticity of parking: A meta-analysis. Transportation Research Part A, 121, 177-191. DOI: https://doi.org/10.1016/j.tra.2019.01.014
Madsen, E., Mulalic, I. and Pilegaard, N., 2013, A model for estimation of the demand for on-street parking, Working paper Technical University of Denmark.
Nourinejad, M., Roorda, M. J., 2017. Impact of hourly parking pricing on travel demand. Transportation Research Part A, 98, 28-45. DOI: https://doi.org/10.1016/j.tra.2017.01.023
Ottosson, D.B., Chen, C., Wang, T., Lin, H., 2013. The sensitivity of on-street parking demand in response to price changes: A case study in Seattle, WA. Transport Policy, 25, 222-232. DOI:
https://doi.org/10.1016/j.tranpol.2012.11.013
Shoup, D., 2005. The high cost of free parking. American Planning Association, Routeledge. StataCorp 2011. Stata Statistical Software: Release 12. College Station, TX: StataCorp LP. Stockholm Parkering, 2018. webpage,
http://www.stockholmparkering.se/Pages/MalOchUppgifter.aspx, accessed 2018-12-27.
Stockholm city, 2016. Parkeringsstrategi och plan för gatuparkering - Investeringar för genomförande av plan för gatuparkering, (Dnr 171-672/2016).
25 Van Ommeren, J., Russo, G., 2014. Time-varying parking prices. Economics of Transportation, 3,
166-174. http://dx.doi.org/10.1016/j.ecotra.2014.05.001
Vázquez, A., 1998. An alternative definition of the arc elasticity of demand. Journal of Economic Studies, 25(6), 553-562. Wooldridge, J. M., 2002. Econometric analysis of cross section and panel data. MIT Press, Cambridge, Mass.
Verhoef, E., Nijkamp, P., Rietveld, P., 1995. The economics of regulatory parking policies: The (im)possibilities of parking policies in traffic regulation. Transportation Research Part A: Policy and Practice, 29(2), pp. 141-156. DOI: https://doi.org/10.1016/0965-8564(94)E0014-Z
Appendix
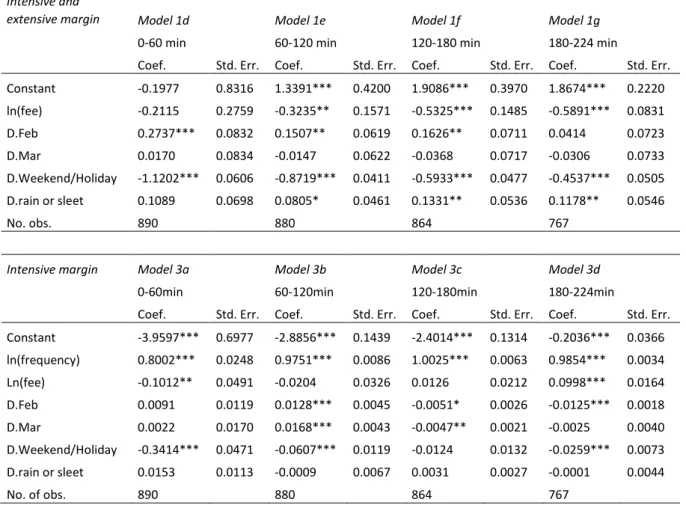
Table 10. Estimation results, intensive and extensive margin, F.E. estimator with AR(1) disturbances. Intensive and
extensive margin Model 1d Model 1e Model 1f Model 1g
0-60 min 60-120 min 120-180 min 180-224 min
Coef. Std. Err. Coef. Std. Err. Coef. Std. Err. Coef. Std. Err. Constant -0.1977 0.8316 1.3391*** 0.4200 1.9086*** 0.3970 1.8674*** 0.2220 ln(fee) -0.2115 0.2759 -0.3235** 0.1571 -0.5325*** 0.1485 -0.5891*** 0.0831 D.Feb 0.2737*** 0.0832 0.1507** 0.0619 0.1626** 0.0711 0.0414 0.0723 D.Mar 0.0170 0.0834 -0.0147 0.0622 -0.0368 0.0717 -0.0306 0.0733 D.Weekend/Holiday -1.1202*** 0.0606 -0.8719*** 0.0411 -0.5933*** 0.0477 -0.4537*** 0.0505 D.rain or sleet 0.1089 0.0698 0.0805* 0.0461 0.1331** 0.0536 0.1178** 0.0546 No. obs. 890 880 864 767
Intensive margin Model 3a Model 3b Model 3c Model 3d
0-60min 60-120min 120-180min 180-224min
Coef. Std. Err. Coef. Std. Err. Coef. Std. Err. Coef. Std. Err. Constant -3.9597*** 0.6977 -2.8856*** 0.1439 -2.4014*** 0.1314 -0.2036*** 0.0366 ln(frequency) 0.8002*** 0.0248 0.9751*** 0.0086 1.0025*** 0.0063 0.9854*** 0.0034 Ln(fee) -0.1012** 0.0491 -0.0204 0.0326 0.0126 0.0212 0.0998*** 0.0164 D.Feb 0.0091 0.0119 0.0128*** 0.0045 -0.0051* 0.0026 -0.0125*** 0.0018 D.Mar 0.0022 0.0170 0.0168*** 0.0043 -0.0047** 0.0021 -0.0025 0.0040 D.Weekend/Holiday -0.3414*** 0.0471 -0.0607*** 0.0119 -0.0124 0.0132 -0.0259*** 0.0073 D.rain or sleet 0.0153 0.0113 -0.0009 0.0067 0.0031 0.0027 -0.0001 0.0044 No. of obs. 890 880 864 767
26 Table 11. Estimation results, extensive margin, Negative binomial regression, R.E.
Extensive margin Model 2d Model 2e Model 2f Model 2g 0-60 min 60-120 min 120-180 min 180-224 min
- Coef. Std. Err. Coef. Std. Err. Coef. Std. Err. Coef. Std. Err. Constant 2.3395*** 0.6018 3.9559*** 0.5955 5.1502*** 0.7864 5.5874*** 0.8890 ln(fee) -0.1100 0.1499 -0.5842*** 0.1491 -0.8392*** 0.1829 -1.1733*** 0.2158 D.Feb 0.2025*** 0.0380 0.2022*** 0.0364 0.1691*** 0.0443 0.1675*** 0.0553 D.Mar 0.0263 0.0401 0.0187 0.0385 -0.0169 0.0472 0.0323 0.0579 D.Weekend/Holiday -0.4079*** 0.0395 -0.7360*** 0.0453 -0.5222*** 0.0582 -0.5322*** 0.0750 D.rain or sleet 0.1099*** 0.0397 0.1007*** 0.0379 0.1110** 0.0470 0.1021* 0.0574 D.Kungsbron -0.4706** 0.2404 0.0174 0.2428 -0.0271 0.3749 0.5985 0.4376 D.Medis 0.2488 0.2102 0.7347*** 0.2108 -0.0054 0.3416 0.5418 0.3920 D.Norra Real -0.8626*** 0.2232 -0.1554 0.2311 -0.5421 0.3684 0.1438 0.4073 D.S:t Eriksplan 0.0609 0.2386 0.4079* 0.2440 -0.5445 0.3590 0.5929 0.4329 No. of obs. 905 905 905 905 Log-likelihood -3361.8209 -3171.6706 -2734.686 -2148.9585 ***, **, *: Significance at the 1%, 5%, 10% level
Table 12. Estimation results, effects per garage, duration interval 0-224 min. Intensive and extensive
margin,
F.E. with AR(1) disturbances
Extensive margin, Neg. Bin. regression, R.E.
Intensive margin,
F.E. with AR(1) disturbances
Model 4a Model 5a Model 6a
Coef. Std. Err. Coef. Std. Err. Coef. Std. Err Constant 3.3708*** 0.6523 6.0763*** 1.0399 -2.0273*** 0.3535 ln(frequency) - - - - 0.9115*** 0.0483 ln(fee) -1.3520** 0.5938 -1.0394*** 0.2721 -0.3117* 0.1851 D.Kungsbron - - -4.0616** 1.7121 0.4264* 0.2562 D.Medis - - 2.1375* 1.3003 -0.1914 0.2721 D.Norra Real - - -8.6975*** 1.6414 0.3349 0.2593 D.S:t Eriksplan - - -6.1955*** 1.4188 -0.0637 0.2586 (D.Kungsbron)ln(fee) 1.3497 0.8371 0.9356** 0.4208 - - (D.Medis)ln(fee) -0.5213 0.8371 -0.4784 0.3398 - - (D.Norra Real)ln(fee) 1.1528 0.7797 2.0904*** 0.4290 - - (D.S:t Eriksplan)ln(fee) 1.7219** 0.8380 1.6277*** 0.3699 - - (D.Kungsbron) ln(frequency) - - - - 0.2081*** 0.0540 (D.Medis) ln(frequency) - - - - -0.0991 0.0782
(D.Norra Real) ln(frequency) - - - - 0.0830 0.0534 (D.S:t Eriksplan) ln(frequency) - - - - 0.1760*** 0.0600
Control variables Yes Yes Yes
No. of obs. 897 905 897
27 Table 13. Estimation results, effects per garage and duration interval.
Purchased parking hours (intensive and extensive margin), F.E. with AR(1) disturbances
Model 4b Model 4c Model 4d Model 4e 0-60 min 60-120 min 120-180 min 180-224 min
Coef. Std. Err. Coef. Std. Err. Coef. Std. Err. Coef. Std. Err. Constant -0.2121 0.8490 2.1517*** 0.4910 2.8900*** 0.4833 3.3521*** 0.4020 ln(fee) -0.2032 0.6267 -1.1193*** 0.4339 -1.0866*** 0.3294 -0.4628*** 0.1357 (D.Kungsbron)ln(fee) -0.4077 0.8273 1.1648 0.4956 0.6626 0.4074 -0.2006 0.2014 (D.Medis)ln(fee) -0.8786 0.9131 -0.6452 0.6506 -1.0960* 0.6448 -1.7991*** 0.5722 (D.Norra Real)ln(fee) 0.7282 0.8617 0.5838 0.5416 0.5534 0.5024 -0.1690 0.2770 (D.S:t Eriksplan)ln(fee) 0.5918 0.8851 1.8034*** 0.6143 1.4120*** 0.4772 -0.1185 0.2407
Control variabels Yes Yes Yes Yes
Intensive margin, F.E. with AR(1) disturbances
Model 6b Model 6c Model 6d Model 6e 0-60 min 60-120 min 120-180 min 180-224 min
Coef. Std. Err. Coef. Std. Err. Coef. Std. Err. Coef. Std. Err. Constant -3.5721*** 0.7268 -2.8466*** 0.1520 -2.5153*** 0.1415 -0.7066*** 0.0662 Ln(frequency) 0.8231*** 0.0874 0.9400*** 0.0150 0.9720*** 0.0131 0.9672*** 0.0148 Ln(fee) 0.0023 0.3973 0.0904 0.0826 0.2093*** 0.0790 -0.4979*** 0.0200 (D.Kungsbron)ln(fee) -0.4991 0.5593 -0.0303 0.1156 -0.0677 0.1086 0.0470 0.0298 (D.Medis)ln(fee) -0.0793 0.5723 -0.1735 0.1211 -0.2525** 0.1172 0.6012*** 0.0898 (D.Norra Real)ln(fee) 0.4721 0.5632 0.0200 0.1162 -0.1834* 0.1083 0.0735** 0.0408 (D.S:t Eriksplan)ln(fee) 0.0492 0.5665 -0.1415 0.1155 -0.3162*** 0.1080 -0.0070 0.0355 (D.Kungsbron)ln(freq.) 0.2473** 0.1041 0.0494*** 0.0185 0.0418** 0.0170 0.0106 0.0183 (D.Medis)ln(freq.) -0.0587 0.1457 0.0060 0.0282 0.0106 0.0267 0.0207 0.0216 (D.Norra Real)ln(freq.) 0.1305 0.1000 0.0336* 0.0193 0.0003 0.0165 0.0204 0.0173 (D.S:t Eriksplan)ln(freq.) -0.0049 0.1185 0.0099 0.0201 0.0149 0.0172 0.0136 0.0183 ***, **, *: Significance at the 1%, 5%, 10% level
28 Table 14. Estimation results, effects on the decision to park (extensive margin), per garage and duration interval.
Extensive margin, Negative binomial regression, R.E.
Model 5b Model 5c Model 5d Model 5e
0-60 min 60-120 min 120-180 min 180-224 min
Coef. Std. Err. Coef. Std. Err. Coef. Std. Err. Coef. Std. Err. Constant 3.6972*** 1.2521 6.0978*** 1.3961 9.4048*** 1.7387 9.8859*** 2.7640 Ln(fee) -0.4627 0.3263 -1.1438*** 0.3666 -1.9323*** 0.4462 -2.3072*** 0.7270 D.Kungsbron -2.9907 2.0388 -3.1457 2.1315 -7.8068*** 2.4413 -3.6834 3.6052 D.Medis 3.0594** 1.5079 2.7680* 1.5972 0.5833 2.0138 0.2672 3.0473 D. Norra Real -6.6937*** 1.9118 -7.7474*** 1.8483 -11.2393*** 2.2158 -10.0557*** 3.2116 D. S:t Eriksplan -5.5776*** 1.6461 -5.5287*** 1.7714 -7.4870*** 2.3215 -6.3392* 3.2740 (D.Kungsbron)ln(fee) 0.6291 0.5010 0.7997 0.5283 1.9347*** 0.6011 1.1249 0.9075 (D.Medis)ln(fee) -0.7128** 0.3932 -0.4944 0.4179 -0.1451 0.5185 0.0982 0.7991 (D. Norra Real)ln(fee) 1.5442*** 0.4996 2.0253*** 0.4827 2.8223*** 0.5703 2.7076*** 0.8415 (D. S:t Eriksplan)ln(fee) 1.5135*** 0.4283 1.5795*** 0.4626 1.8040*** 0.5997 1.8279** 0.8578
Control variables Yes Yes Yes Yes
No. of observations 905 905 905 905
Log-likelihood -3336.7819 -3140.8855 -2706.2872 -2135.1573 ***, **, *: Significance at the 1%, 5%, 10% level