Optimization of inbound value flow in a
manufacturing company
A case study on the bullwhip effect
RESEARCH WITHIN:Industrial Engineering and Supply Chain Management AUTHOR:Eric Lindmark & Jakob Svenningsson
SUPERVISOR:Roy Andersson July 2019
Address: Visiting Address: Phone number:
Acknowledgements
We would like to begin this thesis by taking the opportunity to thank everyone that made this possible. Thank you to all employees involved at Husqvarna Group in Orangeburg, South Carolina for your big support as well as hospitality. Sincere thank you to Mr. Charles Wylie and Mr. Joe Dupree who supported us while conducting research at Husqvarna Group. Thank you, Dr. Roy Andersson who has been, guiding us from the other side of the globe trying to communicate the best advice possible for us to succeed with our thesis. Finally, we would like to thank everyone else that has been involved with our thesis work by supporting us with feedback and input throughout this process.
Jönköping 2019-07-06
________________________________ ________________________________
Eric Lindmark Jakob Svenningsson
The thesis has been carried out at the School of Engineering in Jönköping in the subject area Industrial Engineering and Management. The authors take full responsibility for opinions, conclusions and findings presented.
Authors: Eric Lindmark & Jakob Svenningsson Supervisor: Dr. Roy Andersson
Scope: 15 credits Date: 2019-07-06
Abstract
Purpose – The purpose of the research is to explore how to reduce waste in value flows and to
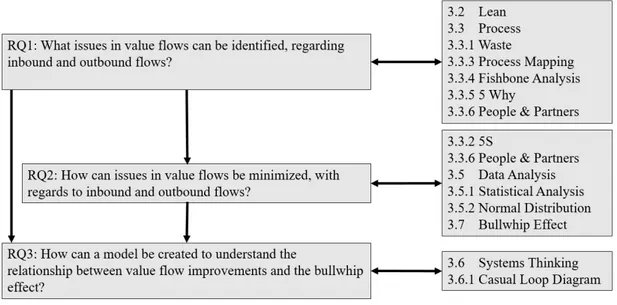
minimize the bullwhip effect within operations. To fulfill and answer the purpose of the research three questions of issue has been established:
1. What issues in value flows can be identified, regarding inbound and outbound flows? 2. How can issues in value flows be minimized, with regards to inbound and outbound flows?
3. How can a model be created to understand the relationship between value flow improvements and the bullwhip effect?
Method – To retrieve understanding of the topic that thesis involves, support of literature studies,
observations and data collection was used. The literature study created a foundation of theoretical framework. The data collected from the case company formed a base that partly facilitates the purpose of this thesis. The theoretical framework and data collection were thoroughly analyzed and discussed in order to propose solutions for improvements.
Findings – The research establishes different issues that can be identified in outbound and
inbound flows such as; waste in transportation, waste in inventory, waste in movement and waste in overproduction. Further, in order to minimize the identified issues in inbound and outbound flows it is imperative to find out the root cause for the issues. When the root cause was established, statistical approach was utilized to further explain the issue. The findings from the statistical approach elucidated a large variance between supply and demand, resulting in a bullwhip effect. In order to minimize the bullwhip effect, improvements should focus on insufficiencies such as; lack of communication, order batching and disorganization. In addition, standardization through 5s approach mitigates the waste in transportation and movement. To understand the relationship between value flow improvements and the bullwhip effect, a causal loop diagram was created to understand the phenomenon from a system perspective.
Implications – The research contributes with solutions on how to identify the bullwhip effect as
well as highlighting the issues in value flows. Furthermore, this research solidifies the importance of using lean process to improve overall productivity in value flows.
Limitations – The research was limited to one case company and one area in the case company.
The answers that are presented in this research could increase the reliability and credibility if the authors had been able to investigate several areas at the case company or several companies. Furthermore, the date that has been retrieved is based solely on one supplier at the case company.
Keywords – ‘Lean Process’, ‘Bullwhip Effect’, ‘Supply Chain Management’, ‘Continuous
Improvement’, ‘System Perspective’ and ‘Statistical Analysis’.
Table of Contents
Table of Contents
1.0 Introduction ... 1
1.1BACKGROUND ... 1
1.2PROBLEM DEFINITION ... 2
1.3PURPOSE AND RESEARCH QUESTIONS ... 3
1.4SCOPE AND LIMITATIONS ... 3
1.5DISPOSITION ... 4
2.0 Methodology ... 5
2.1WORK PROCESS ... 5 2.2RESEARCH APPROACH ... 6 2.3CASE STUDY ... 6 2.4CASE COMPANY ... 6 2.5DATA COLLECTION ... 7 2.5.1 Literature Review ... 7 2.5.2 Document Review ... 8 2.5.3 Observation ... 8 2.6DATA ANALYSIS ... 9 2.7RESEARCH QUALITY ... 10 2.7.1 Credibility ... 10 2.7.2 Transferability ... 10 2.7.3 Dependability ... 11 2.7.4 Confirmability ... 113.0 Theoretical Framework ... 12
3.1CONNECTIONS OF THEORY ... 12 3.2LEAN ... 12 3.1.2 Philosophy ... 13 3.3PROCESS ... 13 3.3.1 Waste ... 14 3.3.2 5S ... 153.3.4 Fishbone analysis ... 16
3.3.5 5 Why ... 17
3.3.6 People & Partners ... 17
3.4DATA ANALYSIS ... 18
3.5SYSTEMS THINKING ... 20
3.5.1 Causal Loop Diagram ... 20
3.6BULLWHIP EFFECT ... 21
4.0 Empirical Analysis ... 22
4.1CASE DESCRIPTION ... 22 4.2QUESTION OF ISSUE I ... 23 4.2.1 Wastes ... 24 4.3QUESTION OF ISSUE II ... 25 4.3.1 Fishbone ... 25 4.3.2 Five Why ... 26 4.3.3 Statistical approach ... 274.3.4 Supply and demand variance ... 28
4.4QUESTION OF ISSUE III ... 30
5.0 Discussion ... 31
5.1ANALYSIS DISCUSSION ... 31
5.1.2 Identifying issues in value flows ... 31
5.1.3 How identified issues can be resolved or minimized ... 32
5.1.3 Establishing a model for understanding the relationship between value flow improvements and the bullwhip effect ... 33
5.2DISCUSSION OF METHODS ... 33
6.0 Conclusion ... 34
List of Tables
List of Tables
Table 1. Literature Search ... 7 Table 2. Observations ... 9 Table 3. Wastes linked with Case Company ... 31
1.0 Introduction
This chapter introduces the background and problem formulation before presenting the thesis purpose. The purpose is then followed by questions of issue. The chapter is then narrowed down with scope and limitations followed by disposition.
1.1 Background
Organizational restructure has been a necessity for organizations the past decade. This is from the results of globalization associated with new market opportunities, competitive threats and proliferation of business models. Organizations’ attempt to improve their cost and revenue structures by changing their horizontal, vertical and spatial boundaries, in order to respond to the results of these developments. (Jones, 2002) The definition of globalization could be perceived differently throughout research, however, this papers perception of the definition is most aligned to the following:
“We define globalization as the progressive integration of financial, product and labor markets across the national boundaries” (Jones, 2002, p. 326)
The economic globalization is evolving with a rapid phase, now more than ever, which consequently results in increased competition among organizations in various industries around the world. Ricupero (1998) argue that the motive for the rapid phase is the increasing economic interdependence of countries. The industrialized markets and increasing market accessibility are influenced by significant changes. The changes create incentives for companies to improve their market strategies in order to stay competitive and viable. Furthermore, Closs and Fawcett (1993) argue that the production of delivery of high-quality and low-cost products is of one of the greatest challenges for globalization. The motive for this challenge is that competitions can surface from basically anywhere in the world. There are ways to effectively answer this challenge, one way is for manufacturers to realize how use the worlds available resources to have greater advantage. Furthermore, the competitive advantage with better use of the world's resources has to include coordinated global manufacturing strategies. Porter (1998) does also argue that abilities to take greater advantage of resources will increase competitive advantage as whole. Moreover, he also argues that this is in order for an organization to keep their market shares high and viable as well as keep growing within the competitive market they operate. In addition, competitive advantage can commonly be divided into two different strategies, time efficiency and innovativeness. Effectiveness and efficiency are terms that could be perceived differently regarding their definitions. In order to analyze how to improve efficiency as well as effectiveness the authors of this paper find it relevant to adapt a definition that qualifies for this research. According to Sink and Tuttle (1989), to simplify the meaning of the terms effectiveness is usually described as “doing the right things” while efficiency is described as “doing things right”. However, these descriptions might be too unspecified. Moreover, to be more specific efficiency is generally defined as the minimum amount of resources put into operations in order to reach the desired result compared to the amount of resources used. Furthermore, effectiveness is commonly associated with generating value for the customer and influences outputs of the productivity ratio. (Tangen, 2005).
Introduction
Several definitions of effectiveness and efficiency has been allocated and so the authors have found two that qualifies for this paper. The authors of this paper conclude that the definition that best suites the authors’ views on effectiveness is defined by Sink and Tuttle (1989) as;
“Effectiveness, which involves doing the right things, at the right time, with the right quality etc., can be defined as the ratio between actual output and expected output”
Efficiency has been concluded to also be defined by Sink and Tuttle (1989) as;
“Efficiency is an input and transformation process question, defined as the ratio between resources expected to be consumed and actually consumed”.
When establishing definitions for effectiveness and efficiency the issue of performance is also important to define. According to Tangen (2005) performance has a broad meaning and include both operational aspects as well as overall economic aspects. When it comes to nearly any objective of competition and manufacturing excellence, it is related to performance. This could include cost, flexibility, speed, dependability or quality. Slack and Lewis (2001) describes these as high-performance operations, which companies aim to accomplish. In addition, these high-high-performance operations has further on led to being performance objectives. Furthermore, a clear definition of performance is difficult for researchers to find. Although, the authors of this paper consider performance to be decided through the different performance objectives cost, speed, quality, flexibility and dependability.
1.2 Problem Definition
As the trend of increased customization has put higher demands on manufacturers, the demand pushes to innovate packaging and optimize quantities to be shipped. (Koren, Jovane, & Boer, 2007) With a trend for customization, increased competition and J-I-T deliveries to align the higher need for efficiency, lower levels of quantities per shipment is required (Twede, 1992). The problem of finding an optimal quantity delivered each time depends on several factors. These factors would include the level of transparency, trust and reliability between organizations in the supply chain but also due to lack of inter-organizational integration (Twede, 1992). The lack of integration can additionally resolve in a reduced understanding of the importance for the optimal packing, creating mistrust, misalignment and a motivational issue for continuous improvements (Dass & Fox, 2010). Furthermore, the lack of a holistic performance, whether it is inter-organizational or intra-organizational, increases the risk for sub optimizing and the bullwhip effect (Dass & Fox, 2010). This increases the inventory variance in a supply chain upstream, creating a greater risk for either a surplus or deficit of goods. Following the bullwhip effect, many organizations struggle with optimizing workshop space to avoid the ineffectiveness of expanding the properties if the area already used can be more efficiently used. (Lee, Padmanabhan, & Whang, 1997)
1.3 Purpose and Research Questions
Based on the background and problem formulation, to fully optimize value flows as well as inbound materials are complex, thus requires serious efforts and supplier involvement. Therefore, the purpose of this research is:
“To explore how to reduce waste in value flows and to minimize the bullwhip effect within operations”
In order to fulfill the purpose of this research, it has been divided into three different research questions. The authors of this paper indicate the importance of visualizing as well as obtaining more extensive understanding of the value flow, therefore RQ1 is:
1. What issues in value flows can be identified, regarding inbound and outbound flows?
When the problems in a value flow have been identified, the challenge of mitigating these will arise. In order to examine possible methods for improvements, based on the results from the previous research question, RQ2 is:
2. How can issues in value flows be minimized, with regards to inbound and outbound flows?
Following the results from RQ1 and RQ2, the consequences of improving a value flow will be examined, in a bullwhip context.
3. How can a model be created to understand the relationship between value flow improvements and the bullwhip effect?
1.4 Scope and Limitations
This study’s aim was to provide insight in how to control and optimize inbound materials in prominently two ways, quantity optimization and standardized workshop area. This study has introduced both theoretical and practical implications but limited the study to the value flow without regards to managerial challenges. The scope was set to focus on one value flow, stretching from inbound goods to production line and the work activities involved, seen in Figure 1.
Introduction
By focusing on one specific value flow, but including support functions such as Production Planning, Buyers and Suppliers the aim was to reduce sub-optimizing, increasing the total value added. Furthermore, within the specific value flow, the case company has put forward 14 articles which all is a major part of the value flow. This is to allow for a more specific research but also, as they all are supplied from one singer supplier, it gave fewer unidentified factors for issues found.
1.5 Disposition
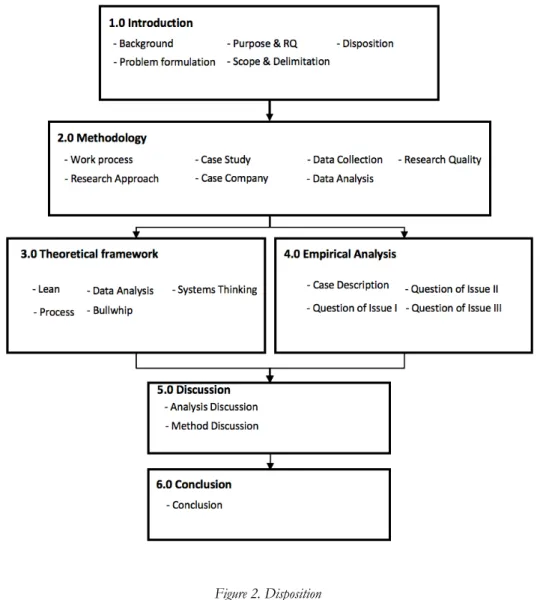
This section focus on the overview of the report, thus a disposition of every chapters is presented in Figure 2. Through structuring the thesis into different chapters where each chapter adds value, a systematic and structured report was conducted. Chapter one introduces the subject with a suitable background, problem formulation and the research questions. Further, chapter two describes the methodology behind the research which is then followed by a division between theoretical framework and the empirical analysis based on the case study. This is later discussed and concluded in the finals of this report.
2.0 Methodology
This chapter provides the various steps adopted by the authors during the research. It describes the connection between the questions of issue and research methods, including the work process, research methods, data analysis and what the authors have done to create a valid and reliable result.
2.1 Work Process
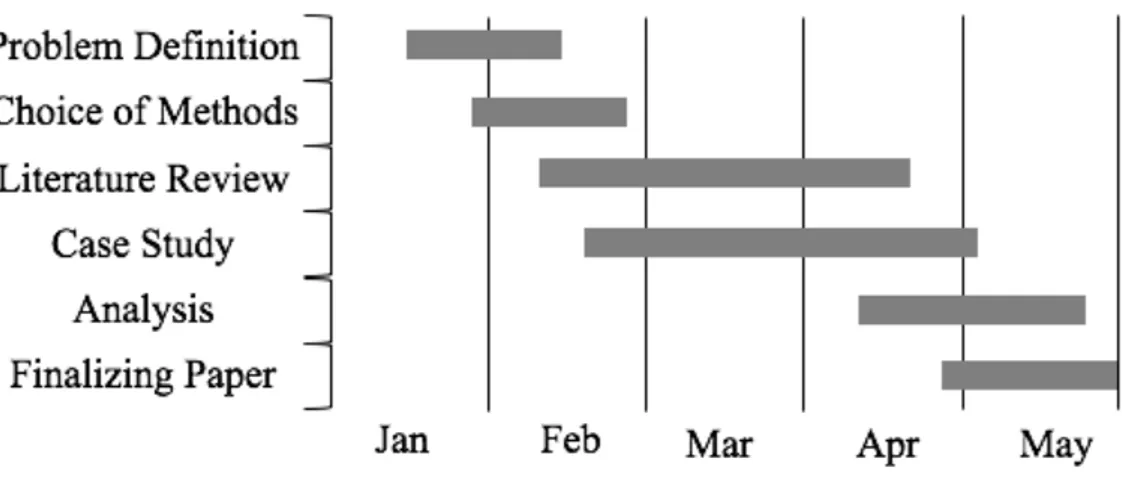
This study has been conducted at the case company Husqvarna Group in South Carolina, USA from February to May 2019. In order for this paper to have coherence and to ensure the study to be on time, the authors have used a Gantt-schedule, Figure 3. This is to reduce time wasting and to be as concrete in our relationship with the case company.
Figure 3. Work Process
The authors of this paper did not have the opportunity to initialize our case study or familiar ourselves with our problem until mid-February which delayed the timespan for observations and the case study, further increasing the importance of our Gantt-schedule. Additionally, it helped this paper to keep a right balance between company, theory and the project in general. With an agenda for each visit to always have a purpose in everything done, aligned with the research questions and time frame.
With discussion together with the case company supervisor, an understanding of the problem was established based on the project description the meeting attendees had received in beforehand. In line with a lean-approach, observations started instantly as “go and see for yourself” is one of the lean-principles (Liker, 2004). This facilitated the study to speed up the process but also the literature review as a solid theoretical framework could now be established. As the data collection had started both through the literature review and observations, a foundation was now set for deeper analysis and discussion of the subject. The work process later evolved into concrete suggestions for improvement for the case company as well as theoretical suggestions for further research.
Methodology
2.2 Research Approach
This study’s objective is to establish a connection between existing theories and information acquired at the case company, seen in Figure 4. It will allow for an objective paper but also enable the creation of new theories based on previous research (Yin, 2016). Therefore, the research questions are formulated in an inductive manner.
As a lean philosophy is commonly seen as a production paradigm, the researchers consider the lean tools to form the basis of this research. This is in order to understand the problem, root causes, project management and the basics of lean. To solidify the study and turn the theories to practice, observations are used to combine the quantitative data with qualitative data which will ultimately answer this papers three research questions (Yin, 2016).
Figure 4. Connection between Question of Issue and Research Methods
2.3 Case Study
A case study is preferred when conducting a qualitative analysis (Yin, 2007). As this paper tries to go deeper within the subject of efficiency and production improvements, the research is conducted with emphasize on depth rather than breadth (Kothari, 2004). Further, to understand a specific case and is commonly used to coop with real-life situations which underlines on a whole picture research to include all possible variables (Merriam, 1994).
This is why a case study is preferred and is of importance to this research, to broaden the understanding of the problem, challenges and implications to improve. The case study will complement the literature review in the efforts of making theory come to practice in achieving long-term results (Justesen & Mik-Meyer, 2011). The data received was later analyzed and applied with theory to generalize the findings to find improvements and a framework for the case company to apply.
2.4 Case Company
The researchers have chosen Husqvarna Group as case company for this report. Since the purpose of this report is to explore how to reduce waste in value flows, Husqvarna Group was a perfect choice due to their production and operational sections which are areas that inevitably are in need of improvements regarding optimizations. In addition, Husqvarna Group had incentives to improve the value flow in a certain area in their production. The research took place in Husqvarna Groups’ facility in Orangeburg, South Carolina, USA.
Husqvarna Group is not only a well-known outdoor power product company, they are the leaders in the market. This makes the experience even more interesting and exciting. The company has over 13.000 employees within 40 countries with 1500 people working in the South Carolina facility. At this specific facility, tractors and zero-turn raiders products are manufactured, but the Groups total product portfolio reach far more products than that, which are sold in over 100 countries all over the world.
2.5 Data Collection
The data collection of the study consisted of a literature study, document study and observations, which are explained below.
2.5.1 Literature Review
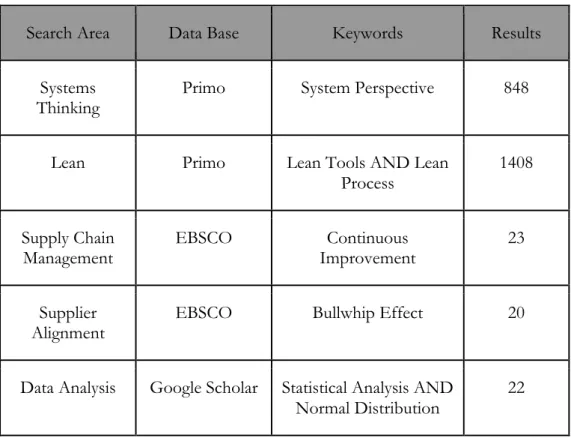
In order to understand the underlying theories and research on this subject, a literature review was conducted. It was of great importance to answer RQ2 and RQ3 but also in general as this study’s purpose is “To explore how to reduce waste in value flows and to minimize the bullwhip effect within operations”. The data collection and search engines used are accessed through Jönköping University, University of South Carolina and Google Scholar which incorporates worldwide researches and journals. Through utilizing keywords when performing the literature review, the authors were able to retrieve relevant theories which is described in Table 1. Literature SearchTable 1. Additionally, all sources comes from peer-reviewed material which solidifies the literature as it has been reviewed and examined by experts of the specific field (Bogdan, DeVault, & Taylor, 2015). Literature used has been categorized into search area as seen below, with the number of results. This would be a case of snowballing where the authors have found the most reliable source of literature by citing the original paper (Goodman, 1961).
Search Area
Data Base
Keywords
Results
Systems
Thinking
Primo
System Perspective
848
Lean
Primo
Lean Tools AND Lean
Process
1408
Supply Chain
Management
EBSCO
Improvement
Continuous
23
Supplier
Alignment
EBSCO
Bullwhip Effect
20
Data Analysis
Google Scholar Statistical Analysis AND
Normal Distribution
22
Methodology
2.5.2 Document Review
In order for the researchers to answer the research questions and fulfill the purpose of this study, document study was key. Patel & Davidson (2011) argues that a document research is considering real-time events and conditions. This method strengthens the results from the literature review but also the observations according to Yin (2016). Ultimately, this would help answer this papers RQs. Every document used by the researchers are retrieved by the case company when requested. The requested quantitative data in drawings was; supply & demand and facility dimensions. This enabled for a holistic view and transparent process could be held throughout. This gave the authors solid ground and understand about the case company for further research through additional methods. In addition, valuable documents in form of inbound and outbound data was retrieved from the case company. This enabled the researchers to carefully analyze different activities for further understanding.
2.5.3 Observation
Observation within research is often conducted in two different ways. Either it is the systematic observation approach (also called structured approach) or participation observation approach. The systematic observation approach has its basis in social psychology which means that interactional studies are made in environments like classrooms. When studying people in their natural environment it will enable the observers to obtain understanding about peoples’ perspectives (Baker, 2006). Here, quantitative data and statistical analysis are usually used for this type of observation. In addition, this type of observation approach is a research method that aims at generating data with coherency between the authors (observers) but also to eliminate the variations which are the physiological factors that affects the perception of the individual observer. Furthermore, the participation observation approach has its roots in anthropology and sociology and is generally practiced when scientists aim to examine lifestyles, cultures and beliefs or ideas in social groups. (Denscombe, 2014)
However, the authors of this report believe that due to the characteristics of a systematic observation approach as basis, it is more relevant to use for this research. During the observations, the researchers acted as complete observers which according to Baker (2006) implies that the observer put focus on examining the events occurring by listening and watching. In addition, Baker (2006) states that the researcher act as a silent observer, which means that no significant participation or interaction of the object is included in the observation. This report will include four different observations as shown in Table 2. In observation 1 the purpose was to gain broader understanding of the complete value flow of the case company that is supplier to customer flow. The 2nd observation was more detailed with purpose to map the process in the value flow from the warehouse to the paint shop, including decision gates. Observation 3 consisted documenting the “Backflow area” to understand the practical implications and the most predominant issue for the case company. Finally, the 4th observation was to complete the process mapping and to confirm the findings.
Observation Name of
Observation Duration (min) Location Purpose
1
Plant Tour 120 Full Value Flow Broader
understanding of the complete value
flow, from supplier to customer
2
Process Mapping 65 Warehouse to
Paint Shop Map the value flow
3
“Backflow Area” 30 Backflow Area Understand the
practical implications, potential for standardization
4 Process Mapping 30 Warehouse to
Paint Shop Completion of the Process Mapping
Table 2. Observations
2.6 Data Analysis
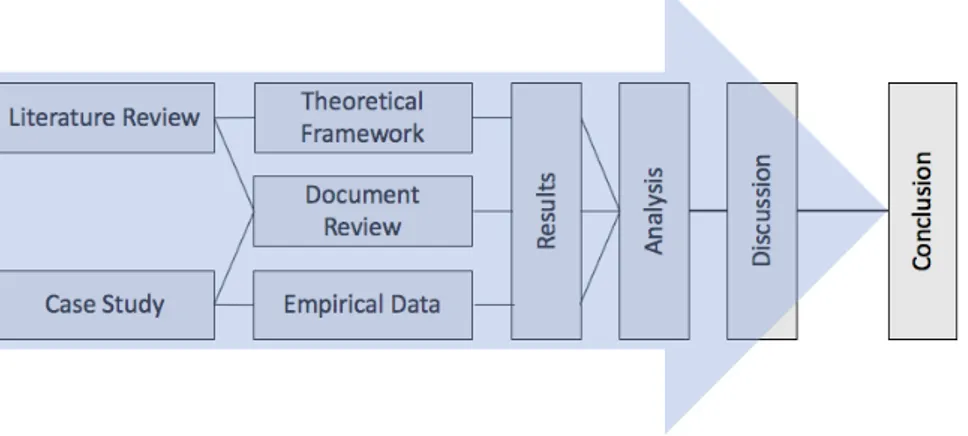
The data analysis was a continuous process as data was gathered and documented simultaneously to secure that no data was lost (Yin, 2016). As the data was retrieved, constant discussions were held to ensure the data alignment, transparency and quality in a holistic manner highlighted in this method section. Furthermore, Yin (Yin, 2016) argues that the connection between data collection and data analysis is difficult to separate, resulting in the process of analyzing the data is an iterative one. Aligned with the work process described in Figure 5, the theoretical framework, document review and empirical data will have individual results which are then analyzed. As the literature review was done through reading articles and journals with the purpose of this study in mind, together with the documents review retrieved from the company, complimented with the empirical data from observations, a broader and deeper analysis can be conducted.
Methodology
Figure 5. Data Analysis
2.7 Research Quality
According to Halldórsson & Aastrup (2003) there are several ways to view research quality which has their roots from relativist/constructivist writers. In recent years, logistics researchers has practiced quantitative approaches. However, as the use of qualitative approaches increases, several more criteria for the evaluation of research quality has been developed. The authors of this report believe that constituents of the perspective trustworthiness is the most suitable for this research since it engage credibility, transferability, confirmability and dependability. Within the quantitative research these are also known as internal validity, external validity, objectivity and reliability. (Halldórsson & Aastrup, 2003) Thus, they will constitute the research quality of this paper.
2.7.1 Credibility
Credibility involves the criteria of determining if results of the qualitative research is believable from the perspective of the attendant of the research. The purpose of the credibility stage is to establish an understanding of how the attendant or participant found the result interesting. Further, in the end it is only the participant that can decide whether the results of the report are credible or not. (Golafshani, 2003) In order to conduct the four observations in this study with intention to making it believable for the attendant, both researchers participated in the making of the observation with strong motivation behind it, as well as participation of the data collection. In addition, with solid preparation and creating a template with regards to the purpose of this study before the actual observations enhanced the credibility of the study.
2.7.2 Transferability
Transferability is the ability to replicate the study’s findings and/or methods to another paper or research, meaning the ability to achieve the same qualitative results in other contexts (Thomas & Magilvy, 2011). Transferability can be seen as the equivalent to external validity in a more quantitative research (Lincoln & Guba, 1985). It can be increased in a study through extensive descriptions of the subject, to increase the likelihood of regular occurrence of the phenomenon. Furthermore, an author of a paper cannot “claim” high transferability but describe why it is (Halldórsson & Aastrup, 2003). This papers transferability has been considered thoroughly throughout this study. The primary weakness of this study is that it is based on a single case study, at the specific case company, increasing the likelihood of lacking transferability. Despite this, the risk has been mitigated through the urgency of providing usefulness to similar cases with similar problems (Toma, 2011). Further, to increase the transferability, the authors have made thorough theoretical research with the purpose of creating a solid framework to apply at the case company but to be considered for the reader in a similar context.
2.7.3 Dependability
In a qualitative study we cannot replicate an observation in the same way as the traditional view of reliability as by definition, observing a phenomenon twice is two different measurements. Still, dependability is key in establishing trustworthiness in a study. This can be done through understanding and thoroughly describing the changes in the context and how these affected the results (Toma, 2011). Through constant discussions with the case company supervisor and the academic supervisor, the interpretations and conclusions of our data collection is constantly evaluated. According to Halldórsson & Aastrup (2003), this increases the dependability as outside researchers can explore, examine and challenge the data retrieving and analysis.
2.7.4 Confirmability
The confirmability of a study is about the level of confidence the study’s findings has, based on the narratives and words instead of a general research bias. What this means is that confirmability refers to whether the data and results can be confirmed or corroborated. A popular technique to verify a research confirmability is to utilize an audit trail. Furthermore, it’s important to have the ability to understand what the conclusions are based upon and should be traceable to the framework (Halldórsson & Aastrup, 2003). Again, through constant discussions with the supervisors, confirmability of this study has continuously been comprehensively examined and verified. Also, through the discussions between the researchers to ensure that all data were aligned with the purpose and research questions of this study.
Theoretical Framework
3.0 Theoretical Framework
This chapter encapsulates the most relevant and important theoretical frameworks that will be included in this thesis. In addition, this chapter is associated with the purpose of this thesis, as well as comprehensive information of every theory that is included.
3.1 Connections of Theory
The main focus for this thesis is to explore what kind of issues can be identified in value flows as well as how to minimize this issue. Mentioned in the background, the authors solidify the relevance and why it is important for the need for such research. To facilitate the result of this thesis the theoretical framework has been deliberately chosen. Moreover, the theoretical framework is established to be the base for theories that will be used in this thesis and in addition will support the three research question that are stated in Figure 6.
3.2 Lean
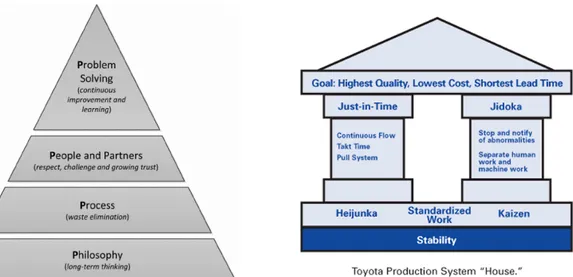
Lean is a commonly, widespread term and was first recognized in the 1980s when Toyota, a Japanese automotive manufacturer, became superior in quality and efficiency. Through the Toyota Production System (TPS), they greatly outcompeted their competitors in endurance and requiring less repair, especially in comparison with the Americans (Liker, 2004). Through their operational excellence they have put a footprint in many industries (Womack, Jones, & Roos, 1990). TPS, and the lean philosophy is built on two main foundations, continuous improvements, typically referred to as the Japanese term “Kaizen” and respect for people. Liker (2004) divides the 14 principles of the Toyota Way into four major categories which are; Philosophy, Process, People and Partners and Problem Solving. He further explains the importance of an underlying, long-term thinking philosophy to ultimately achieve continuous improvements and learning through problem solving. Lean is not only about philosophy but also includes built-in-quality (Jidoka), Just-in-Time and production systems such as Pull System and then strive towards a continuous flow (Womack, Jones, & Roos, 1990). This is visualized by Liker through two main figures, namely the lean pyramid (Figure 8) and the lean house as seen below (Figure 7) (Liker, 2004).
Lean tools and philosophy are further described below, to provide a solid framework to this paper. In alignment with the purpose of this study, the theoretical framework with regards to lean will consist of tools and principles related to the purpose and RQs. With this in mind, this framework will start by describing the foundation of the lean pyramid, the lean philosophy, further describing the “process” before exploring “People and Partners”.
3.1.2 Philosophy
Notably, lean is more than its tools, root cause analysis and problem solving. It derives from a foundation of philosophy of doing the right thing from a philanthropic standpoint. This follows through the whole concept of lean and predominantly the founders of TPS, where “The Right Process
Will Produce the Right Results” (Liker, 2004, p. 101) highlights the importance of doing the right thing
(Liker, 2004). The lean philosophy circles around a very specific point, that of thinking long-term. Long-term decision making and doing the right thing is the basis of lean production (Womack, Jones, & Roos, 1990). This long-term philosophy stretches to base all management decisions, remarkably even if short-term financials are at risk (Liker, 2004).
3.3 Process
This section elucidates different process and models that are common within lean. The purpose of lean processes is to create effective organizations with waste elimination of different practices and improving overall efficiency in production. The main focus of lean process is to improve products and services in order to achieve the proposed values and demand set by the customer. Further, achievement of reducing waste and customer satisfaction improvements will enable the lean process to save financial expenses and also improve overall profitability. (Liker, 2004)
Figure 7. Lean House Figure 8. Lean Pyramid
Theoretical Framework
3.3.1 Waste
In lean production, waste in manufacturing or production is essential to either be reduced or remove non-added activities completely. Everything that comes across as a non-value-added activity is in fact waste (Liker, 2004). The idea is to view waste as zero tolerance. If not incorporating the right processes to eliminate waste the result could subsequently lead to unnecessary costs and uncertainty in material flow (Lumsden, 2012). The founder of the TPS, Taiichi Ohno, identified seven different wastes that could occur in various manufacturing or production processes (Liker, 2004). However, Liker & Meier (2006) later on argued that one more waste could be identified as Waste in Creativity.
These are;
● Waste in Overproduction: This waste is out of all 8 wastes the one that bear most negative effect. Overproduction arise when more parts or products are produced than the customer demands and therefore are willing to purchase. Further, this waste can generate additional wastes such as Waste in Time, Waste in Inventory and Waste in Movement.
● Waste in Time: This waste refers to the time caused when there are two or more non synchronized independent processes. This could occur when part A and part B are to be assembled but part B is delayed. Thus, forces part A to wait and non-value-added time is created. The waste could also refer to the simple matter of workers being inaction and standing beside an automated machine for the next process.
● Waste in Transportation: This waste refers to the inefficiency in moving objects a longer or unnecessary distance such as finished goods to different locations between processes. Not only does this increase waste in time but it does also cause added costs.
● Waste in Process: This waste occurs when products are produced for higher quality purpose than necessary, this means taking redundant steps to process the parts than the customer values.
● Waste in Inventory: This are wastes that includes excessive raw material, redundant work in process, and finished goods that not bring any added value. In addition, Waste in Inventory can occur when a company decides to hold on to inventory just in case, this is if parts or products are defect, broken, poor quality but also when deliveries are late from suppliers, long setup times etc.
● Waste in Movement: When unnecessary motion is done in regard to what is actually needed for machinery or human work, it is seen as a Waste in Movement. This could be motions like, walking unnecessary distances, reaching for parts, stacking parts or tools.
● Waste in Defects: The Waste in Defects are the production of faulty parts, or parts that appear to have poor quality. Further, these defective or faulty parts would generally be adding additional and unnecessary cost than expected. If the parts or products were to be repaired
● Waste in Creativity: The Waste in Creativity implies that employees that acquire a set of skills or creativity but does not use it. The reason for this loss of creativity, ideas, knowledge and improvements could be due to management ignorance of listening to their employees. 3.3.2 5S
The 5S tool is not only constructed for the simple purpose of keeping production areas or workstations clean and orderly. The true purpose of 5s is set to be a visual control tool and to compile certain activities in order to eliminate wastes that subsequently might lead to errors, defects and injuries in various workplaces. Furthermore, standardization of the activities are important so that there are no uncertainties of how the workstations are to be managed, as well as facilitate the working condition (Liker J. K., 2004). To simplify the description of the 5s, they will be translated to English, these are stated below:
● Sort (Seiri): Sort out the unnecessary various items such as tools and material and dispose it. Keep only those items that are needed.
● Straighten (Seiton): Organize so that the tools needed are placed in a well accessible spot.
● Shine (Seiso): When the needed items have been used, they should be properly cleaned from dirt in order to eliminate defects and quality issues when used again. Further, they are to be placed at originate location.
● Standardize (Seiketsu): The three previous steps should be established as routine including appropriate maintenance of workstations and the various items used. Procedures and systems on how to maintain the workstation should be well visible.
● Sustain (Shitsuke): For the 5s tool to generate efficiency this has to be an ongoing process with an agreed policy throughout a whole organization in order to always strive towards continuous improvement.
Furthermore, 5s is a tool to improve safety, productivity, worker efficiency as well as creating a common ground for the overall workforce. However, with this in mind it is crucial not to forget that this tool, as any other lean tool needs commitment from everyone involved in order for it to function. (Srinivasan, 2012)
3.3.3 Process Mapping
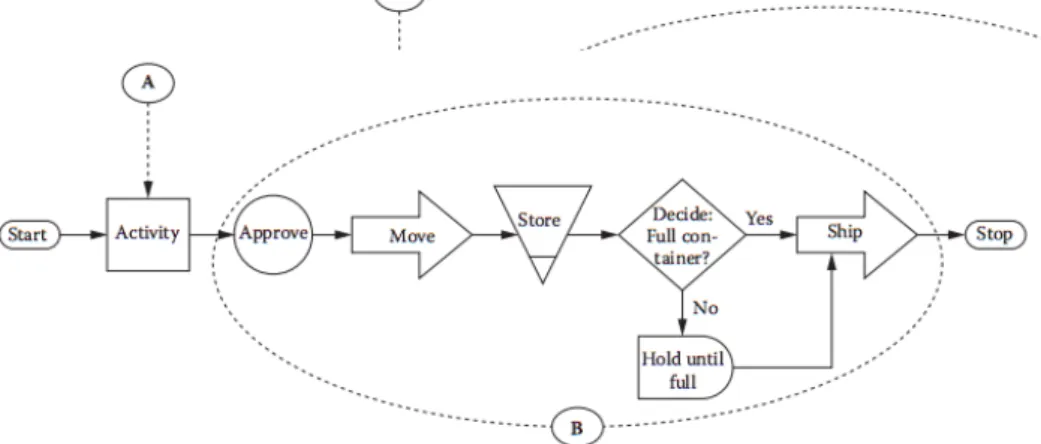
A process map is a tool that visually describes the flow of work and decisions connected to them (Damielo, 2011). It shows a series of events from start to finish for a product or service for a single specific, unique output. The tool is used for businesses and organizations to reveal areas for improvement (Jacka & Keller, 2009). Further reasons to map a process is to help achieve a common understanding of the work, members to understand the context they work within every day, improve communication and understanding and code knowledge through a collective description of the work. As seen in Figure 9 there are processes described in a workflow, with additional decision gates exemplified through ‘Full container?’. The key features of a flowchart consist of
Theoretical Framework
Moreover, to improve the current flow the wastes needs to be considered when doing a complete mapping by following the flow to when mapping the flow. Some common problems found in workflows are; path of items is too complex, path of items are not visual, items are not available when required and timing of up- and downstream activities are out of sync. (Damielo, 2011)
Figure 9. Generic Process Mapped (Damielo, 2011, p. 9)
To be defined as an activity in a flowchart, the work has to be independent and a part of a larger whole, which can be exemplified through that you need to twist the ignition key (activity) before you can start driving your car (stop). Through its relationship between other activities and their common purpose or result creates the sequential work process (Jacka & Keller, 2009). However, process mapping doesn’t tell the members everything. It doesn’t include information as how much work is required in the activities, how effective the information or work is, what set of resources are required to perform the activity nor the effectiveness of it (Damielo, 2011).
3.3.4 Fishbone analysis
A fishbone diagram, or Ishikawa diagram as the Japanese term is often referred to, seeks to structure causes of a studied issue. By structuring possible causes through categorizing them, most commonly through categories such as Human, Machine and Method among others. This is done in a team where all have their sayings in trying to find possible causes for the issue (Sörqvist, 2004). Its strengths further lie in the visualization which enhances the probability of mutual understanding of the issue. As seen in Figure 10, the possible causes can then be examined to be deemed a cause of the problem. When causes have been commonly understood and accepted, the reason for this cause has to be identified, preferable through the use of a 5-why analysis (Radziwill, 2017).
3.3.5 5 Why
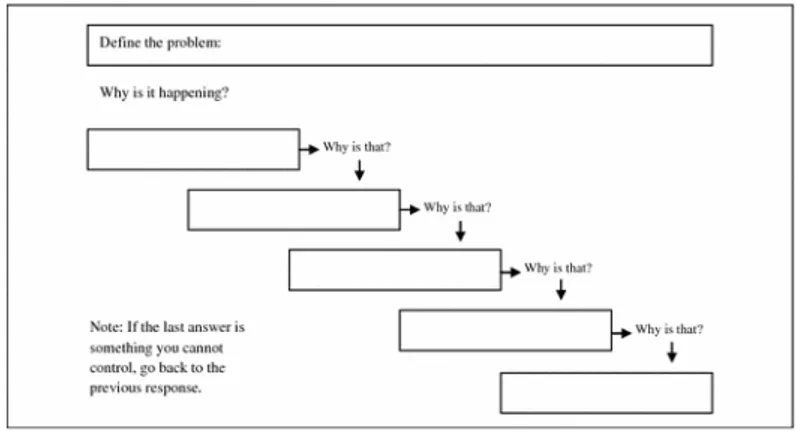
As a later step of a fishbone analysis, when one or several causes have been identified, a 5-why analysis is key in understanding the root causes of the issue, seen in Figure 11. This is key in achieving long-term improvements. Furthermore, it’s of essence for all participants of a 5-why analysis to understand that it is not people who are wrong, but the process. The process of doing a 5-why analysis starts by gathering a team of people associated with the issue and ask the first “why”, why is this issue taking place? Through documenting all answers and discussion, the different branches can be followed through by continuing to ask “why” four more times. The key thing is to follow-up on the plausible answers to achieve an identification of a root cause. When the root cause has been identified, appropriate actions is needed to ultimately remove the issue. (Serrat, 2017)
3.3.6 People & Partners
The responsibility and visibility of purchasing and materials management has in recent years increased and become a highly important process in today's manufacturing organizations. Further, increase in responsibility as well as visibility has gained realization from people in general management to be a key success factor that subsidize to sustainable competitive advantage (Krause, 1997). With the ongoing increasing volume from companies in outsourced manufacturing work across industries, the percentage will probably rise. Furthermore, as this percentage rise the importance of purchasing and materials management continues to expand. Due to this effort, it becomes imperative for companies to rely more on their suppliers for design and production. As this dependence increase, performance has to depend on the actions of the suppliers. By reorganizing the supplier base as well as managing it through the organizations manufacturing system, the firm could increase their supplier performance (Carter, 1996).
In attempt to create more effective relationships with suppliers, organizations adopt both supplier
selection criteria and supplier involvement. The supplier selection criteria focus on strengthen the process of
selecting a supplier and supplier involvement focus on the decision-making processes to achieve continuous improvements. Moreover, illustrated by Vonderembse & Tracey (1999) in Figure 12 are two supplier-related methods that both are imperative in order to subsequently improve the overall manufacturing performance.
Theoretical Framework
The first supplier-related method is the supplier selection criteria which aids the organization to identify suppliers that are able to provide with quality, performance, availability and consistency in delivery (Fawcett & Fawcett, 1995). If these objectives are identified with the supplier and subsequently selected, both supplier performance and the organizations manufacturing performance will ultimately be expected to increase. The second supplier-related method is the supplier involvement which help the organization with supplier involvement especially in product development and continuous improvement. The cooperation between customers, manufacturers and suppliers are strategic procedures that aids to build a supply chain that emphasize the needs of the final customer. Furthermore, in the establishment of long-term, strategic alliance that ties suppliers to customers is inducing the role of material management and purchasing to expand in a holistic manner. To insure that internal and external capabilities are done in ways that increase the overall performance, enhanced communication and interaction with suppliers, customers and other actors within the organization is needed. This also encompasses incorporating suppliers with the organizational design process as well as creating an arrangement of cooperation in efforts for continuous performance (Vonderembse & Tracey, 1999).
3.4 Data Analysis
When understanding and putting efforts towards improving a process, a data analysis is suitable to conduct (Xia & Gong, 2015). It is the process of interpreting data sets to understand the information, preferably visual. Data analysis can help businesses in increasing revenue, optimize market campaigns, customer service or operational efficiency (Judd & McCleland, 1989). There are different types of data analytical technologies depending on the industry or context they’re practiced within. Exploratory data analysis aims at findings patterns and relationships whilst confirmatory data analysis applies statistical techniques to find a hypothesis true or false (Xia & Gong, 2015).
3.4.1 Statistical Analysis
Statistical analysis purpose is to identify trends, e.g. to find patterns which can improve customer satisfaction for a retail firm (Walsh, 1962). Statistical analysis can be divided into 5 steps; describe the nature of the data, explore the relation of the data, create a model to summarize the data, prove the validity of the data, predict future data to help improvements. The analysis can be done through either a parametric or parametric technique. If the data is of ordinal or nominal nature, a non-parametric analysis is preferred while non-parametric is more suitable when there is normally distributed data (Conover, 1980).
3.4.2 Normal Distribution
Normal distribution is an important theory in statistics (Casella & Berger, 2001). It assumes more values to be closer to the mean then further away. This will create a smooth curve where the central line will be normally distributed if the number of data points (n) is above 30. Normal distribution is crucial in understanding different phenomenon in both society and nature and it can describe it to a high extent of accuracy. If the data collection proves to be normally distributed, the standard deviations will prove to be within the 68%, 95% respectively 99.7% tile of the mean. The standard deviation is a measure to understand how spread out the data is from the mean, exemplified through Figure 14 where the green line has a higher standard deviation than the blue line. The normal curve can still look different, depending on the stability of the data, which in the figure means that the blue curve is more stable than the green. Whilst all three curves are normally distributed, the blue one is significantly more stable than the green, yet they are both normally distributed. Additionally, data can be skewed either positive or negative Figure 14. This can be seen as either the right or left of the mean is “heavier” whilst the opposite side has a longer tail (von Hippel, 2005).
Figure 14. Normal Distribution Curves (von Hippel,
Theoretical Framework
3.5 Systems Thinking
Systems thinking is and has been growing rapidly with an exponential growth for over 60 years (Haraldsson, 2004). In the USA, the perception of systems thinking is seen as an activity that generates momentum on the circumference of system dynamics. The system dynamics are enable to perceive the unique ability to represent the real world. This means that it comprehends the complexity, nonlinearity and feedback loop structures which is immanent in physical and social systems (Forrester, 1994). Systems thinking is more extensive than thinking about systems, talking about systems, and acknowledging that systems are important. Systems thinking is the comprehensive study of systems in general. The overall goal is to describe certain principles that ultimately could be applied for different types of systems on different levels within different sciences. Moreover, systems thinking is a frequent used concept for interpreting how causal relationships and feedbacks works in daily operations (Haraldsson, 2004).
3.5.1 Causal Loop Diagram
Causal loop diagrams are models that can be used in Systems Thinking and are valuable because they help to clarify mental models as well as make reasoning behind them clearer. Causal loop diagram also help to identify common original mindsets that drive systems behavior. Causal loop diagrams consists of different variables, feelings, actions or simply different things, which then are connected with links and casual arrows together with polarities that are either negative or positive signs. The content of the causal loop diagram subsequently creates positive or negative feedback loops. (Haraldsson, 2004)
Shown in Figure 16 is an illustration of a causal loop diagram between the two variables Births and
Population. The first step is to place the variables that is intended to be examined. Then, determine
the causality between the variables, in this case higher Birth rate leads to greater Population, but important to remember is that in this case, Population links back to Births as well. Further, the polarities are to be set for the first link (Births to Population). Then, the polarity for the next link
(Population to Births), which would be the feedback. Lastly, the final step is to set behavior of the loop, which in this case would be a reinforcing (R) loop. The reinforcing loop would indicate a systematic growth or decline. However, if the loop is set to be a balancing (B) loop, it would indicate that it moves the system in direction towards symmetry or equilibrium. Furthermore, the Figure 16 would in this case illustrate a causal loop diagram that has a reinforcing system of
Population with high Birth rate and therefore an increase in Population. (Haraldsson, 2004)
3.6 Bullwhip effect
Misrepresented information from different stages within the start and end of the supply chain can contribute to profound inefficiencies. These inefficiencies can result in everything from excessive inventory investments, poor customer service, lost revenues, non-aligned capacity plans, ineffective transportation (Lee, Padmanabhan, & Whang, 1997). Furthermore, Chen et al. (2000) describe some inefficiencies within the supply chain that can lead to the bullwhip effect:
● Disorganization: Poor organization alignment between different supply chain areas can lead to ordering larger or smaller quantities of a product than is actually needed due to over or under reaction somewhere in the supply chain.
● Order Batching: Each member of different areas in the supply chain put order quantities received from the downstream customer and higher or lower the quantities in order to not having article shortages or no excessive inventory on their part. If different areas in the supply chain is following this pattern it will be more distortion in demand.
● Lack of Communication: The lack of communication between both internally within an organization as well as externally to other actors in the supply chain makes it difficult for operations or processes to run continuously. Some areas in the supply chain perceive the demand to be different in different areas, thus leads to ordering different quantities.
● Demand and Forecast Updating: This is performed individually by all areas within the supply chain. Based on the demand from the downstream customer and order received, each area updates its own demand forecast. With more areas in the supply chain updating their own demand could subsequently lead to less forecast updates that actually shows the end-customer demand.
These mislead key factors and inefficiencies can lead to something called the bullwhip effect. The bullwhip effect is a mechanism that can be described as an occurrence detected by the supply chain. Orders are delivered to the manufacturer in which the supplier are creating a larger variance than the sales to the end user or the end customer. Subsequently, the variances created tends to interrupt the continuous tranquility of the processes within the supply chain, as each activity in the supply chain will either over or underestimate the demand resulting in preposterous fluctuations as seen in Figure 16.
Figure 16. The Bullwhip Effect
Empirical Analysis
4.0 Empirical Analysis
This chapter presents collected empirical data. Empirical data has been collected from the case company located in Orangeburg, South Carolina, USA. The collected data is presented through a description of each case company. The description introduces the case company, describes the area of issue and specifies the process of issue.
4.1 Case Description
Husqvarna Groups has its focus towards various outdoor power products in which they are the world leader. They produce products such as robotic lawn mowers, ride on mowers and chainsaws to name a few. In addition, they are the European leader in watering products as well as one of the world leaders in cutting equipment and diamond tools for the construction industry. Husqvarna Group have distribution centers, factories and suppliers all over the world. Husqvarna Group has focus on innovative quality and solutions and sell their products through dealers and retailers in over 100 countries. In addition, they have over 13000 employees within 40 countries with a 39 billion SEK turnover in 2017. With Kai Wärn as president and CEO Husqvarna Groups fundamental strengths are leading market position, strong reliable brands, substantial research and development resource, global presence, strong and flexible supply chain and more than 300 years of experience. (Husqvarna Group, 2019)
The authors of this report have conducted a case study at Husqvarna Group in their Orangeburg facility in South Carolina, USA. In the facility, approximately 2000 employees work, and they assemble riding lawn mowers or “raiders”. The final products that are assembled in the facility are divided into Zero-turn radius, Stand-On mowers, Lawn riding mowers and Tractors. The annual volume of these final products amounted to 438.000 units 2018. In addition to the assembly, they also produce ingoing components. However, in large they use external suppliers for their components. Most of the components goes through the so called “paint shop” station which feeds two out of the five assembly lines in the Husqvarna, Orangeburg facility. In the “paint shop” the components are hung up on racks by workers. The racks are placed on a line that transports the component through the “paint machine” in which they are painted in different colors. Further, they are later stacked in order to dry. When dried, the components are further transported to the assembly lines. Moreover, adjacent to the “paint-shop” are an area that Husqvarna calls the “backflow area” shown in Figure 17. Here, the components are sent if the batch are not fully used. The components that are stocked in the “backflow area” have no standardized order and sometimes put together with other components in the same pallet or box. (Husqvarna Group, 2019)
4.2 Question of Issue I
In order to understand the issues in value flows, it’s important to map it (Damielo, 2011). Through theory and a case study, the authors have mapped the value flow at the case company. By observing the flow of both information and products an agreed understanding and identification about where issues can be found were made. Challenges identified includes the four out of the seven wastes and supplier integration. Figure 18 illustrates the process map over inbound goods to Paint Shop. The blue boxes indicate the start and end of the process, the grey boxes indicates an activity or a person and the yellow boxes indicates a decision point. In addition, the green dotted zone is operationally managed by the team leader in charge.
Figure 18. Process Map over Inbound Goods to Paint Shop
The case company manages all their processes through their Enterprise Resource Planning (ERP). The ERP system gives an indication to both the Purchaser and Production Planner for supply respectively demand for the articles in issue. The process mapping will be described starting from the Supply-side. As the case of this paper only refers to one supplier, the purchaser orders the required quantity based of the indication from the ERP system. The supplier then, accordingly, ships the goods which is received at “Inbound” at the case company where the decision of whether the paint shop area needs the goods at first notice or not is made. If so, the goods will be directly sent for preparation to be processed at the paint shop. Preferably, the whole batch of goods shipped is consumed which will end its flow.
However, this is not achieved nearly as often as wished by the case company. The most frequent flow of goods is when it isn’t needed as soon as it arrives, showing a lack of Just-In-Time practices. What this resolve in with the flow is that the goods are shipped to the warehouse where it will stay until the Team Leader from paint shop asks for the goods to supply their demand just for it to be prepared as normal before being processed at paint shop. If, however the full batch is consumed, the case company has a “backflow area” in which they store remainders of previous batches. This area fulfills the purpose of having small amount of goods close to their production to minimize waste through disposing the unneeded goods for paint area.
Looking at the process mapping from the demand side instead, the Production Planner receives, similarly to the Purchaser, information from the ERP. With this information, the Production
Empirical Analysis
area to visually control the quantities and articles needed. If the right quantity isn’t available at the backflow area, the Team Leader will contact the warehouse to retrieve the remainder, or complete, quantity.
Through the literature review and process mapping at the case company, the authors have identified several issues in the value flow. These issues can be divided into subgroups where Wastes and Supplier Involvement will be the headings as follows.
4.2.1 Wastes
Through the process mapping, several wastes were found. Based on theory, these will cause unnecessary costs and uncertainty in material flow (Lumsden, 2012). They distinguish from themselves as they could have different root cause but as noted, shares a common denominator of creating costs and ultimately slowing the production flow. As seen when following the value flow, these issues can be separated into the different types of waste, namely;
● Waste in Transportation: When conducting the process mapping there were clear to see the waste in transportation. This expressed itself through all goods for this value flow entering at the inbound area, designated for the purpose of shortening the transportation route in the value flow. Although a good purpose, it has led to additional transportation as the goods received wasn’t often required at first which led to them being shipped to the warehouse.
● Waste in Inventory: Waste in inventory is clearly shown through the need for a backflow area which holds excess inventory. This often hinders the value flow as the team leader doesn’t have an overview over the inventory in the area. This results in semi-finished goods being held in inventory for a longer time than necessary, ultimately increasing inventory costs.
● Waste in Movement: On a daily basis the Team Leader walks around and checks the Backflow area to get an understanding of which articles in what quantities exists there. This is considered a waste in movement as all Liker & Meier (2006) states that walking unnecessary distances is a waste.
● Waste in Overproduction: The paint shop area overproduces through painting more components than needed. This creates an uncertainty for the value flow and amplifies the non-standardized practice. Furthermore, as shown in theory and the process mapping, it creates additional wastes in time and inventory. (Liker & Meier, 2006)
4.2.2 Supplier Involvement
The process mapping also came to show the issues within supplier transparency and decision making to add value throughout the value flow. What is predominant in the value flow are both the movement of the components but also the quantity of them. If the quantity doesn’t match the demanded quantity, it will end up in the backflow area. This creates additional work and non-value-added activities and wastes as the inventory in the backflow area receives additional, for-the-moment, unwanted goods. As the supplier is a major companion and partner to the case company, the uncertainty of the supplier’s performance ultimately hampers the case company's’ performance. Furthermore, the backflow area is subject to a bullwhip effect as the uncertainty between supplier and case company causes a big variance in inventory held in the adjacent area.
4.3 Question of Issue II
For the authors to understand how to minimize the issues that are identified in value flows it is imperative to understand the different causes, more specifically the root cause of the issues. In this section various models will be presented with results that facilitate the case study of this thesis. The models follow a lean perspective that are created to understand an organizations issues in order to then implement improvements for the identified issues and thenceforth achieve well-functioning processes.
4.3.1 Fishbone
The authors of this report have conducted a fishbone diagram which is illustrated in Figure 19. This fishbone diagram includes several different categorized causes that could lead to the bullwhip effect found when conducting the process mapping. The categories are;
● Measurement: During the observation several causes could be found. There is poor clarity in specification which means that workers in the case company are not giving distinct specifications to external supplier, which in the case of this report deal with different order quantities. Furthermore, the operations at Husqvarna tends to have a silo approach, meaning that each person or department solely deal with their responsibility which can lead to sub optimization.
● Materials: At the case company, the suppliers are delivering material or components with different types of packaging which in some cases are difficult to handle if the package is open, it is impossible to seal it again. This can lead to components falling off pallets or racks and essentially be lost. To reduce the risk of part shortages, the case company both purchase additional components as well as increasing the quantity that is needed of certain components that are going in to the “paint shop” which ultimately can lead to overproduction.
● Man: The case company has a large personnel turnover due to the seasonality where some seasons demands a larger respective smaller workforce than others. The personnel turnover could result in less amount of experience. In addition, when the demand in large workforce increases the case company have to act quickly to find personnel as well as train them. Furthermore, another cause could be the use of ad hoc processes where a problem that surface is fixed with temporary solutions.
● Environment: The case company have different variances in transit time, meaning that the delivery from their supplier might vary in transportation time which could imply uncertainty in planning and delay in other processes. In the process of transporting components both externally but also internally could imply damages to the components.
● Method: The economic order quantity (EOQ) is deciding the quantity that is to be ordered from the supplier, in this situation the case company orders more than what they actually need which could generate excessive inventory. This is linked with the approach for risk of part shortage mentioned Materials.
Empirical Analysis
Figure 19. Fishbone Diagram Analysis 4.3.2 Five Why
In order to understand the root cause of the bullwhip effect for the case company, the authors have conducted a Five Why. The different causes are listed below in Figure 20, as well as the primal cause.
● Differences in order quantity: The case company have differences in order quantity which means that every other month the quantities in orders fluctuates and the supply is either higher or lower than the demand.
● Different ordering quantities: There are no minimal and maximal standardization regarding order quantities. This means that articles are being ordered with no specific supplier demand.
● Uncertainty in fluctuation in demand: Within the case company, the demand fluctuates and therefore there are uncertainties whether the supply should be increased, decreased or the same for next supply. There are difficulties in receiving historic demand for certain articles.
● Lack of demand overview: There is no thorough analysis of historic demand, thus makes it difficult to have overview of what the future demand looks like.
● Lack of a statistical approach: There are no utilization of data that shows the pattern of historic demand nor supply. The data that the case company possess from earlier purchase orders as well as historic demand should be analyzed through statistical approaches in order to decrease the uncertainty in both demand and supply.
Figure 20. Five Why Analysis 4.3.3 Statistical approach
The sum of inbound articles are illustrated in Figure 23, the articles that are delivered from the supplier and further on goes into the paint shop area, thus the supply. Further, Figure 22 illustrates the sum of outbound articles that goes through the paint shop area, this is therefore called the demand. Both graphs have data that is traced back to two years. At first glance, these graphs are perceived to have the same pattern and coherency to each other each month. The first 8 months, May 2017 to December 2017 the case company had production trails that represents the low supply and demand these months.
Moreover, in Figure 25 and in Figure 24 are the data for individual articles each month for the same inbound and outbound as the sum of all articles in Figure 23 and Figure 22. In closer look, specifically on individual supply and demand the difference between the supply and demand is quite vast. The demand in Figure 24 is stable among the articles within the same month. However, the demand fluctuates from month to month. In contrast, Figure 25 illustrates a vast spread in variation among the different articles within the same month.