1
Department of Plant Physiology SE-90187 Umeå University, Sweden
Master degree thesis in Plant and forest biotechnology 30ECTS
Screening for mutants with delayed leaf senescence in Arabidopsis
Iftikhar Ahmad
Supervisors: Per Gardeström
Agnieszka Ziolkowska
Umeå Plant Science Center
Department of Plant Physiology Umeå University SE-90187 Sweden
2
Table of contents
Abstract……….………...4
Introduction……….………..4
Chlorophyll degradation……….……….5 Protein degradation……….……….5Nutrient remobilization during senescence... .6
Senescence is a genetically controlled process……..…..………7
Definition of stay green mutants ………..………...8
Types of stay green mutants ……….………... .8
Stay green mutants……….………..8
Dark induced senescence ………..10
Aim of the project ……….11
Materials and methods……….………...11
Plant materials and growth conditions ………..11
Induction of senescence ………11
Sample collection ………..11
Chlorophyll extraction and measurement ……….12
Protein extraction ………..13
Protein quantification ………13
Gel preparation using the Bio-Rad system ………...14
Sample preparation ………...15
Electrophoresis ……….... .15
Western blotting ………16
Antibody incubation ……….……….16
Secondary antibody detection………17
Results………..
.18
Phenotypic analysis………18
Chlorophyll content………...21
Protein content………...…….24
3
Discussion……….………30
Phenotype………...……….….…..30
Chlorophyll and protein measurement………… ……….…..…...31
Rubisco LSU decrease during senescence……….…………32
Mitochondrial and Chloroplastic proteins……….32
Cosmetic stay green plants……….……34
Conclusion……….….……..…
.35
Future prospects……….….…..…..
..36
Acknowledgements………..…..……..
. .36
References……….….……..……
. .37
4
ABSTRACT
Senescence is the last stage of development in plants. During foliar senescence, the leaves experience changes in metabolism, cell structures and gene expression. In this process the limiting nutrients of leaves are relocated from senescing organs to the developing leaves, fruits and buds. The genetic screening to identify senescence mutants is of utmost importance both for scientific research and for future biotechnology because the stay green mutants could increase crop yields.
In our experimental setup, the senescence was induced by darkening the individual leaves of Arabidopsis thaliana plants with “mittens” for six days. We have screened 1064
Arabidopsis plants for the mutants with delayed senescence phenotypes (stay- green,
light- green and slightly light green plants) by measuring chlorophyll content, protein content and change in protein levels of the rubisco LSU, COXII, GS1 and GS2 during dark induced senescence. After senescence induction, the wild type plants had shown typical yellowing and drying of leaves coupled with chlorophyll and protein degradation, while the foliar senescence progresses more slowly in selected stay green mutants. The selected stay green mutants (19/29, 19/1043 and 19/531) delayed the degradation of chlorophyll and protein contents even after 6 days of dark treatment. Furthermore, the retention of chloroplast and mitochondrial protein (rubisco LSU and GS2, and COXII respectively) and their higher chlorophyll contents may suggest that 19/29, 19/531 and19/1043 plants may maintain their photosynthetic and respiratory activities. These mutants delay the functional leaf senescence and could be candidates for functional stay green mutants for upcoming experiments.
INTRODUCTION
The term senescence is basically derived from the Latin verb senescere meaning “to grow old”; generally the most obvious senescence in plants is foliar senescence (leaf senescence). In fact the leaf senescence is the last stage of leaf development during which the leaf color changes from green to yellow (Keech et al 2007). Normally leaf senescence is initiated by yellowing of the margins of the leaf blade extending towards centre of the leaf blade near the midrib, resulting in death of the leaf. Different factors affect the leaf senescence. The environmental factors influencing leaf senescence comprise of both abiotic and biotic factors. The abiotic factors involve drought, inadequate nutrition, high
5
or low temperature, oxidative stress, shading and ozone etc. while on the other hand biotic factors consist of pathogen attack. An imperative exogenous factor is light, that’s why darkness is generally considered as an inducer of senescence (Weaver and Amasino 2001, Keech et al 2007, Lim et al.2007). PCD (programmed cell death) is considered as a self-destructing cellular phenomenon governed by external or internal factors and is tightly regulated by genetic programmes. This PCD starts from mesophyll cells of leaves and proliferates to the other cell types in leaf (Lim et al.2007)
According to Lim et al (2007), the leaf senescence is a regulated process consisting of changes in leaf color, cell structure, metabolism and gene expression.
Chlorophyll degradation
When the leaves start getting yellow, the first and most apparent change is breakdown of chlorophyll. The chloroplasts migrate to the bottom of the cells and become bigger and round in shape followed by chlorophyll degradation. The chloroplast is an organelle performing photosynthesis for the cell. It absorbs light, and in combination with water and carbon dioxide, generates sugar which is raw material and energy for the cell, so to maintain life it is crucial for cell to keep working the chloroplasts efficiently. During foliar senescence, the chloroplast is the first organelle targeted for degradation. That’s why by the loss of chlorophyll, the yellowing of leaves can be observed as a prime symptom of senescence (Quirino et al 2000). In addition to it the number of chloroplast during dark induced senescence has been shown to decrease by almost one third compared to uncovered control plants of Arabidopsis thaliana (Keech et al 2007). The degradation process in senescence took place in an orderly manner starting with chloroplasts and ending with mitochondria and nucleus, the latter two organelles remain intact until the late stages of senescence (Lim et al 2003). Thus the chlorophyll degradation is a prime indication of senescence.
Protein degradation
Degradation is an important and imperative event of the senescence process. In addition to chlorophyll degradation there is a progressive loss of proteins such as ribulose-1,5- biphosphate carboxylase/oxygenase (Rubisco) and chlorophyll a/b binding protein (CAB) and massive decrease in RNA level. In particular, the chloroplastic and cytoplasmic rRNA degradation also took place during senescence process (Lim et al. 2007; Taylor et
6
al.1993). In fact more than 75% of leaf protein is situated in the chloroplast (Buchanan-Wollaston et al. 2003). During the senescence process the leaf proteins are degraded. Total protein and RNA levels decline during senescence. The nucleic acids particularly RNA, is a source of phosphorus in leaf and is degraded in order to make phosphorus available for remobilization. The total RNA levels fall dramatically with progression of senescence but the DNA is maintained until late stages of senescence (Buchanan-Wollaston et al. 2003).
During dark induced senescence, the number of mitochondria has been shown to decrease up to 70% compared to uncovered leaves. The mitochondria become larger and rounder in shape and after 6 days of darkness fusion of mitochondria is observed (Keech et al 2007). In contrast to chloroplasts, as mentioned earlier, the mitochondria and nucleus stay intact till last stages of senescence to provide energy and for gene expression to accomplish remobilization of nutrients (Lim et al 2007). In o r d e r t o maintain mitochondria functional its proteins such as COXII should not be degraded. The glutamine synthase (GS) incorporates ammonia into glutamate to form glutamine. GS has an important role in nitrogen metabolism. In plants glutamine synthase has two isoforms, the GS1 is cytosolic while GS2 is chloroplastic protein. The cytosolic glutamine synthatase (GS1) is enhanced during senescence while GS2 is degraded during senescence. Sakurai et al (1996) analyzed that the cytosolic form of GS is present in vascular bundles of rice senescing leaves which signify its role in N mobilization. Additionally, the transcript level of GS1 also enhanced during senescence (Finnemann & Schjoerring 2000). So consequently in addition to chlorophyll degradation, the protein degradation is another important marker of senescence and these degradative processes are necessary for relocation of N from senescing organs to the developing and storage organs.
Nutrient remobilization during senescence
The main purpose of senescence in plants is nutrient remobilization and recycling. In fact during growth the nutrients are accumulated in the leaves and when plants do not require leaves any more, the senescence process gets started and recycling of nutrients take place and finally the leaf dies (Buchanan-Wollaston et al. 2003; Gan and Amasino, 1997; Noode et al. 1997). During leaf senescence, the limiting nutrients of leaves like nitrogen,
7
phosphorus, sulphur, metal ions and minerals ions are relocated to other parts of the plant such as developing leaves, fruits and buds. This usually results in a visible yellowing of the leaf as the chlorophyll and the photosynthetic machinery are degraded to make these limiting nutrients accessible for relocation (Weaver and Amasino 2001; Keech et al 2007).
In Arabidopsis leaves during nutrient mobilization, the Mo, Cr, Fe, Cu and Zn contents of senescent leaves are reduced up to 50% compared to green leaves nutrient contents. Moreover, the levels of essential nutrients like N, P and K decreased up to 80% in senescent leaves compared to green ones ( Himmelblau and Amasino 2001). Thus for plants it is essential to senesce in order to make these nutrients available for relocation.
Senescence is a genetically controlled process
According to Andersson et al (2004) the gene expression of photosynthesis related genes decrease during early senescence while on the other hand the gene expression of respiration and mitochondrial electron transport is sustained or even increases during senescence. The chlorophyll degradation is documented during leaf senescence and a number of genes involved in chlorophyll pathway have been cloned and none of them have shown enhanced expression during senescence. So, for this reason it is concluded that the senescence process is tightly regulated by genetic processes.
As mentioned earlier senescence, being an extremely regulated process includes changes in cellular physiology, biochemistry and gene expression. Many genes are involved in controlling the senescence process. Several genes have been recognized which are transcriptionally up-regulated during senescence these are called senescence-associated genes (SAGs). The other categories of genes involved in initiation and progression of senescence process are: genes controlling the aging process, genes up-regulating senescence associated activities or down regulating cellular maintenance activities, genes involved in degradation processes of senescence and genes involved in nutrient recovery (Lim et al 2003). As a result it follows that senescence is a genetically controlled phenomenon. By genetic screening many mutants have been recognized with altered phenotypes, like stay green mutants and mutants with delayed leaf senesce in Arabidopsis and in other plant species.
8
Definition of stay green mutants
Thomas and Smart (1993) have defined the stay green mutants as the plants whose leaves can stay green for longer time as compared to their parental genotypes. If they can photosynthesize for a longer time than normal, they are also defined as functional stay green. They are expected to produce more grain yield. Commercially these stay green plants are of greater interest because these mutants maintain their photosynthesis for longer duration and can enhance the grain yields (Thomas and Howarth 2000), they further claimed that in Lolium temulentum the carbon fixation by plant was enhanced up to 11 % when the senescence was delayed for only two more days. So consequently, in order to cope with food requirement of growing population in the world, it is necessary to produce stay green plants especially for agronomic crops.
Types of stay green mutants
According to the definition of Thomas and Smart (1993), there are four classes of stay green phenotypes. In type A stay green mutants, the senescence starts late as compared to control plants but after its onset it keep senescing with the normal rate. In contrast, the type B stay green mutants are the opposite to type A, meaning senescence starts according to schedule but after its onset it proceeds slower. The type C mutants maintain their chlorophyll content but by measuring their photosynthetic capacity it was revealed that senescence is executing on its normal pace. Type D is stay green as they just retain the greenness of their leaves but in fact they have dead tissues because of freezing, boiling or drying, e.g. the frozen leaves of spinach. Among these types, A&B are functional stays green while types C&D are cosmetic. In functional stay green mutants the senescence process start late or progress very slowly or both events can happens. On the contrary in cosmetic stay green mutants the senescence process precede normally but yellowing process is disturbed because chlorophyll catabolism pathways may be blocked. (Ougham et al.2008; Hörtensteiner 2009; vicentini et al1995). Likewise Thomas and Howarth (2000) have also proposed the five classes of stay green and fifth one is cosmetic because of having lesions in pigment breakdown pathways.
Stay green mutants
Armstead et al. (2007) have recognized a gene homologue in Pisum sativum, Arabidopsis
9
color in senescing leaves and cotyledons. In Arabidopsis, the At4g22929 gene is up -regulated in days 45 to 50 of its life cycle, in which most probably senescence can occur. It is further confirmed that, RNAi silencing of this gene results in stay green phenotype and retention of chlorophyll in plants. Kusaba et al (2007) monitored the ultra structural changes in a stay green mutant of rice. They observed the chloroplast become rounder and swollen in shape during dark induced senescence. They further claimed that nyc1 (non yellow colouring1) mutant maintain its chlorophyll contents during dark induced senescence.
Woo et al (2001) have proposed the function of ore 9 gene in Arabidopsis, the ore9-1 mutant delays the onset of senescence in age dependent and hormone induced senescence. By observing the changes in senescence markers like chlorophyll content, photochemical efficiency and membrane ion leakage, they proposed that ore9-1 mutant delays leaf senescence compared to normal plant. They claim that ore9 is involved in degradation of substrate protein and that substrate is supposed to be negative regulatory molecule of senescence, but in ore9-1 mutant that substrate cannot be degraded properly due to having defects in LRR (leucine rich repeats) domain.
Oh et al. (1997) isolated the functional stay green (oresara1, oresara3, oresara9) mutants from Arabidopsis. T hey proved that these mutants are result of monogenic recessive mutations. They recognized three genetic loci controlling leaf senescence and mutations in these loci were analyzed by the catabolic and anabolic parameters. Delayed leaf senescence mutants retained the chlorophyll contents and relative amount of large subunit of ribulose bisphosphate carboxylase oxygenase (rubisco LSU) as an indicator of photosynthetic capacity in their leaves, while the catabolic activities like RNase and peroxidase activities are also delayed in these mutants. These two parameters reveal that mutants are functionally stay green mutants and are not just delayed in chlorophyll degradation.
By T-DNA insertion in the promoter region of plastid ribosomal protein gene PRPS17 the ore4-1 mutation was detected. The ore4-1 mutant delays the leaf senescence symptoms in Arabidopsis. Woo et al (2002) observed that ore4-1 mutant is functionally stay green mutant that delays these senescence markers like membrane deterioration, reduction in chlorophyll contents, and photochemical efficiency of PSII and expression of
10
SAGs. In ore4-1 because of disruptive mutation in ribosomal protein gene PRPS17, the expression level of this gene is decreased, while the expression level of SAG12 and SEN4 is increased during senescence.
Dark induced senescence
One of the situations in which leaf senescence is induced is when parts of the plant are darkened. This is called Dark-Induced Senescence (DIS) and can be studied using a model system in which individual leaves of the plant are covered with dark envelopes. The rest of plant was kept in normal light/dark photoperiod, and furthermore the leaves remain attached with the plant during covering. The research conducted by Weaver and Amasino (2001) has shown that senescence is induced in covered leaves and total chlorophyll and protein level is decreased and moreover, decline in CAB (chlorophyll a/b binding proteins) and increase in SAG mRNA was observed. They further reported that leaves senesce when individually darkened but not when the whole plant is darkened because in individually darkened leaf, the senescence is controlled by the light status of the rest of the uncovered plant. So it concludes that darkness is a main inducer of senescence. Furthermore, Keech et al (2007) have revealed that in IDL (individually darkened leaves) almost 75 % of genes are up-regulated or down regulated during dark induced senescence in a similar way as in age dependent senescence, revealing the fact that both senescence programmes share the several common pathways.
Arabidopsis thaliana is the best option as a plant model system to study senescence because of availability of its genomic resources, short life span, and production of many seeds and for the identification of genes involved in senescence and finding out stay green mutants (Buchanan-Wollaston et al. 2003). The genetic screening to get senescence mutants and functional analysis of senescence-associated genes in Arabidopsis can
increase our understanding of senescence and its regulatory network. In addition, the leaf mutations in Arabidopsis can help to figure out the relationship of senescence and other physiological processes of leaf (Lim et al 2003)
11
Aim of the project
The aim of this project was the selection of mutant plants with delayed senescence phenotypes (stay-green, light green and slightly light green plants ) using markers of senescence like chlorophyll contents, change in protein levels and also measurements of the RbcL, COXII, GS1 and GS2 protein levels. Leaf senescence will be induced on individually darkened leaves using the method first time described by Weaver and Amasino (2001).
MATERIALS AND METHODS
Plant materials and growth conditions
The EMS (ethyl methane sulfonate) treated seeds of Arabidopsis thaliana of ecotype Columbia (col) were obtained from Lehle Seeds (USA). These seeds were germinated in soil (soil and perlite mixture 2:1 ratio) for two weeks, after that these seedling were transferred to individual pots for screening purposes. Plants were grown in controlled-environment in growth chamber for another four weeks with a short-day photoperiod (8h light/16h dark) an irradiance of 250 µmol quanta m-2s-1, a relative humidity of 75% and a temperature cycle of 22 °C day/17 °C night.
Induction of senescence
Senescence in individually darkened leaves (IDL) was induced according to the experimental design of Weaver and Amasino (2001) and Keech et al. (2007). In this experimental setup two leaves from six weeks old plants were selected, these leaves should be healthy having similar size and preferably from same whorl of rosette. They were covered with “mittens” made up of black plastic bags, covered by aluminium foil in order to reduce heat, while the rest of the plant leaves remained in normal light/dark cycle. After 6 days of covering, the leaves were uncovered by removing these mittens. The plants with stay green, light green and slightly light green leaves were selected and pictures were taken with “Canon EDS D60 camera” for further phenotypic analysis.
Sample collection
In total 1064 Arabidopsis thaliana plants were screened, which resulted in10 stay green mutants, 42 light green mutants and 6 slightly light green mutants. After uncovering, from these three different phenotypes, the samples of leaves were collected. For each of
12
these selected plants the leaf discs samples were collected for chlorophyll and protein measurements. Each leaf was cut by special metallic tubes of three different sizes, which cuts the leaf discs of 1.3 cm, 1.1 cm, 0.7 cm in the diameter respectively. After that these cut leaf discs were put in labelled eppendorf tubes in liquid nitrogen and finally stored in -80ºC. Finally all selected plants were transferred to long day chamber for flowering and seed production.
Chlorophyll extraction and measurement
For the measurement of chlorophyll, the leaf discs from each selected plant were collected in eppendorf tubes with safe locks in liquid N2 and stored in -80°C.
The chlorophyll was extracted according to the following protocol:
First of all, the samples were taken from liquid N2 and then the lid was thawed before opening the eppendorf tube. Then cooled the eppendorf pestle in liquid N2 and put it in the sample tube, then added the 500ul of cooled buffered acetone 80% (Acetone+2.5mM phosphate buffer PH 7.8), then carefully grinded the leaf disc in eppendorf tube with cooled pestle until it will become a homogenized mixture. In case the sample is very green then added another 500ul of 80% Acetone while rinsing the pestle above the sample tubes, and placed the sample tubes on ice. After grinding 6-8 samples vortex them for 15 seconds and then centrifuged at 14000X g for three minutes. Pipette the supernatant carefully into another labeled eppendorf tube, while in the remaining pellets added another 500ul of 80% Acetone and grinded with cooled pestle, then again vortexed them for 15 seconds and then centrifuged at 14000X g for three minutes and put them on ice in a dark ice box until the actual chlorophyll measurement on spectrophotometer. In case the samples are really green like uncovered wild type and both uncovered and darkened stay green samples, these samples were diluted 3X with 80% acetone (500ul of samples+1000ul of 80% Acetone) it usually yield absorbance of 0.200-1.2 range, but if the absorbance of a samples falls out of this range then it was diluted another two times. The absorbance of the each sample was measured at 646.6, 663.6 and 750 nm. The calculation of the chlorophyll A, B and A+B contents were done according to Porra et al formula (Porra R. J.et al, 1989, Table III):
13
Formula yielding Chl/leaf area (mg/cm2) =
(17, 76*(A646, 6 -A 750) + 7, 34*(A663, 6-A750))*Total Extraction Volume*Dilution
Leaf area
The chlorophyll contents of stay green, light green and slightly light green samples were measured.
Protein extraction
To extract the protein from the sample, the protein solubilisation buffer (PSB) from Agrisera was used. In order to avoid the action of proteinases, work was done on ice and also in cold room whenever possible. First of all, diluted the 4X PSB into 1XPSB by adding 2ml of 4X PSB into 6ml of dH2O and put it on ice. Cleaned the pestle and mortars
and kept them on ice in black box. Proteins were extracted in cold room and under green safe light. For each sample took the pestle and mortar from ice, cleaned them with paper towel and then added 250ul of 1XPSB in the mortar. Took the leaf disc from liquid N2, cooled it well in liquid N2 for efficient grinding and put it in the mortar. Then started grinding thoroughly for almost 2 minutes until the tissues were homogenized into the buffer. After that pipette the all possible homogenized mixture into a new cooled labeled eppendorf tube and placed it in dark box on ice.
After homogenization of all samples, the remaining intact cells were subjected to tip sonicator in order to disrupt them effectively. For that purpose every sample was freezed in liquid N2, then sonicate the sample carefully until it became a bit slushy, repeated it twicely for every sample. Finally all samples were centrifuged at 14000 X g for 3 minutes to remove all cell debris. Then took the supernatant very carefully, avoiding any cell debris into new labeled eppendorf tubes.
Protein quantification
After the protein was extracted from samples, then protein quantities were detected in each selected samples. Bio-Rad DC Protein Assay was used to quantify the proteins in selected samples. In order to reduce the use of reagent and sample the “Microplate Assay Protocol” was followed.
14
First of all made the BSA standard curve using a 4 µg/µl BSA Stock solution (1.4mg BSA in 350ul 1XPSB) and then made a design for loading the microplate with blanks, standard curve and samples in triplet. Calculated the required amount of reagent A and reagent B. The reagent A was prepared by combining reagent A and reagent S in the proportions of 1ml: 20ul respectively. Then finally added the 5ul of each sample to the respective wells and after that added 25ul of reagent A and 200ul of reagent B. After filling all samples wells put the plate on micro plate reader and mixed the contents of wells by using the shaking options. Then after 15 minutes the plate was read by using Lowery Protein Array setting at 750nm.
Gel preparation using the Bio-Rad system
The extracted proteins from selected samples were then separated by SDS-PAGE According to the following protocol:
Cleaned the plates and fixed the right spacer thickness and mounted them on the stand and marked the glass plates 1.0cm below the comb tips.
Prepared resolving gel solution (2 gels, 12 % Acrylamide): dH2O 3400 µl
4x resolving Gel Buffer 2500 µl 30 % Acrylamide 4000 µl 10 % SDS 100 µl
APS (fresh) 50 µl TEMED 5 µl
Mixed and poured the resolving gel solution along the sides with Pasteur pipettes uptil about 1mm above the comb mark. Superimposed the gels with 95 % ethanol, and waited for 30 minutes for polymerization. Pour off the overlay and removed the final droplets of ethanol with filter paper carefully without touching the gel surface.
Prepared stacking gel solution (2 gels, 4 % Acrylamide): dH2O 3000 µl
4x Stacking Gel Buffer 1250 µl 30 % Acrylamide 650 µl 10 % SDS 50 µl
15
TEMED 5 µl
Mixed and poured the stacking gel solution, inserted the combs carefully avoiding any air bubbles especially in corner wells. Let polymerized the gel for 45 minutes.
Resolving Gel Buffer (1,5M Tris-Cl, pH 6.8)
1M Tris-Cl, pH 6.8, Stock 100ml MQ dH2O 200 ml
Stacking Gel Buffer (0.5M Tris-Cl, pH 8.8)
2M Tris-Cl, pH 8.8, Stock 150 ml MQ dH2O 50 ml
Sample preparation
Pipette the 5ul amounts of 2x Loading Buffer into 500 µl tubes, before using thawed the 2x Loading Buffer and added 50 µl of a 2M DTT aliquot to 500 µl 2x Loading Buffer. Added the 5 µl of sample, mixed them well by pipetting up and down at least 10 times. Incubated the samples for 10 minutes at 90ºC and then put them on ice before loading on gel.
Loading Buffer (2x)
(0.125M Tris-Cl, 4 % SDS, 20 % Glycerol, 0.2M DDt, 0.02 % BPB, pH 6.8, 10 ml) Glycerol 2.0 ml
Bromophenol Blue 2.0mg 4x Stacking Gel Buffer 2.5 ml 10 % SDS 4.0 ml MQ dH2O to 9.0 ml 2M DTT DTT, FW 154.2 g/mol 308.4 mg MQ dH2O to 1.0 ml
Electrophoresis
After gel preparation, now samples are ready for electrophoresis. For electrophoresis the following protocol was followed:
1. Assembled the gel in the electrophoresis equipment. 2. Then filled the chambers with 1x Runnung Buffer.
16
3. With the help of long pipette removed polymerized gel from the edges of plates and flushed the wells in the gels with 100 µl running buffer to remove pieces of gel and salt residues etc.
4. Loaded the 3ul of protein- marker and 5ul of respective samples on the gels
5. Pre-run the gels at 60 V for almost 30 minutes in order to pull the samples from wells and resolving gels, then increased the voltage to 150 V for 40-45 minutes for further resolving.
Runnung Buffer (10x) (250 mM Tris-HCl pH 8.3, 1.92 M Glycine, 1 % SDS)
2M Tris-HCl pH 8.8 125 ml Glycine, FW 75.07 g/mol 144.13 g 10 % SDS 100 ml
dH2O to 1000 ml
Western blotting
For the determination of Rubisco LSU, COXII and GS1 and GS2 in each sample the Western Blotting was done according to the following protocol:
First of all equilibrated the gel, the nitrocellulose membrane, the sponges, and the filter paper in transfer buffer for 15 minutes on shaker. Assembled the Western Blot Sandwich and order was sponge- filterpaper2X- gel- membrane- filterpaper2X-sponge, avoiding any bubbles in between sandwich layers. Then placed the sandwich in the tank, added the ice-container, filled the tank up with buffer, added stirring rod and put the lid on it. Finally connected the electrodes to power supply and Run the Western blot for 1 hour at 350 mA and then disassembled the sandwich.
Transfer Buffer
(25 mM Tris-HCl pH 8.3, 192 M Glycine, 0.1 % SDS, 20 % MeOH) 10x Running Buffer 100 ml
Methanol 200 ml dH2O 700 ml
Antibody incubation
Washed the membrane in 1XWB (Washing Buffer) for 10 min on a shaker. Then placed the membranes in Blocking Solution for overnight at 4 ºC, the blocking solution block the non specific binding of antibodies and rinsed the membranes for 30 seconds in washing
17
buffer and then further washed the membrane for another 5 minutes in Washing Buffer. Incubated the membranes with Primary Antibody Solution for 1 h at RT. Rinsed the membranes for 30 seconds in washing buffer and then further washed the membrane for another 2X10 minutes in Washing Buffer. Incubated the membrane with Secondary Antibody Solution for 1 h at RT. Rinsed and washed the membrane for 2 x 5 minutes in Washing Buffer and 1 x 10 minutes in water.
Washing buffer (10x)
(200 mM Tris-HCl pH 7.5, 1500 mM NaCl, 0.5 % Tween-20) 1M Tris-HCl pH 7.5 200 ml
5 M NaCl 300 ml
10 % Tween-20, self- made stock 50 ml dH2O 450 ml
Blocking Solution
5 % non- fat dried milk powder in 1x Washing Buffer 3 %BSA in 1x Washing Buffer
Antibody solution
2 % non- fat dried milk powder in 1x washing Buffer,
Primary antibody solution consists of 1%BSA in 1x Washing Buffer supplied with either 1/5000th for COXII and with 1/10,000th for rubisco (RbcL) and GS1 and GS2.
Secondary antibody solution consist of 1%BSA in 1x Washing Buffer supplied with1/10,000th secondary antibody(Anti- rabbit lgG, Horseradish Peroxidase linked whole antibody from donkey) for Rbcl and COX II and 1/20,000th for GS1 and GS2.
Secondary antibody detection
Secondary antibody was detected by ECL reagents after applying ECL A & B reagents mixture on membranes. Imaging was done by LAS3000 camera. Placed the tray containing membranes in dark chamber and adjusted camera setting and finally took pictures for RbcL, COXII and GS1 and GS2 bands on membranes.
18
RESULTS
In total 1064 plants of Arabidopsis thaliana were screened under the growth conditions of short-day photoperiod (8h light/16h dark) at an irradiance of 250 µmol quanta m-2s-1 , a relative humidity of 75% and a temperature cycle of 22 °C day/17 °C night. Two leaves from six weeks old plants were covered with mitten and after 6 days mittens were removed and visual scoring of leaves was done. Scoring was done according to the retention of green color. Those plants which maintained the same green color as the uncovered leaves even after 6 days of covering were categorized as stay green plants, while plants having a bit light green colored leaves were grouped as light green plants and finally plants maintaining a slightly light green color but in fact not yellow were classified as slightly light green plants. After screening, 10 stay green mutants, 42 slightly light green and 6 light green mutants were identified and these mutants were subjected to further analysis.
Selected mutants were evaluated by measuring the different senescence associated physiological markers, such as phenotypic observation, chlorophyll contents, protein contents and chloroplastic and mitochondrial proteins.
Phenotypic analysis
After 6 days of covering the leaves were uncovered and screened visually for stay green, light green and slightly light green leaves. In wild types plant, the covered leaves turned completely yellow with prominent marks of dryness and death after 6 days of covering, while on contrary, the stay green plants maintained green color of their leaves similar to wild types uncovered leaves as shown in figure 1.
As yellowing being indication of loss of chlorophyll is a first symptom of senescence induction, so by looking at phenotypes of stay green plants it was assumed that they maintained their chlorophyll content even after the dark incubation period. These plants were denoted as stay green 19/29, 19/190, 19/192, 19/776, 19/722, 19/727, 19/987, 19/1043, 19/456 and 19/531 as shown in figure 1. The following plants were denoted as light green: 19/179, 19/47, 19/206, 19/762, 19/732, 19/668, 19/721, 19/911, 19/953, 19/810, 19/871, 19/860 and 19/815, and these plants retained the light green color even after 6 days of dark induced senescence. Among these light green plants 19/179, 19/668 and 19/732 are shown in figure 1. Slightly light green plants retained the slightest green
19
color among selected plants but were indeed not yellow after uncovering as it is clearly visible from 19/100, 19/112 and 19/167 plant pictures shown in figure 1. In stay green plants the delay in chlorophyll loss is obvious as they still retain the green color of their leaves after 6 days of dark period. In addition to this, in stay green plants the covered leaves were healthy and fresh like the uncovered leaves of the same plants without having any signs of dryness or death on it even after 6 days of the covering as shown in figure 1. The 19/1043 stay green plant has quite a different phenotype with incised edges of its leaves, rather smaller plant but comparatively much greener than other plants. After transferring in long day chamber, it was observed that all the stay green plants particularly 19/29, 19/192, 19/776, 19/1043 and 19/531 delayed the senescence process. In fact, they started yellowing, drying and flowering much later than wild type plants. Stay greenness of mutants was evaluated by measuring the senescence associated physiological markers like chlorophyll contents, protein contents and Rubisco LSU (large subunit), as well as COXII, GS1and GS2 proteins. Furthermore, it was also observed that wild type plants flower earlier than stay green plants. Moreover, stay green plants maintained green leaves until later stages of flowering and seed productions. In some cases even emergence of new leaves were observed.
A. (Experimental setup: covering and uncovering of mittens)
20 C. (Stay green)
21 D. (Light green)
E. (Slightly light green)
Figure1: Photographs demonstrating covering and uncovering of individual leaves with mittens (A) and phenotypes of
WT (B) stay green (C), light green (D) and slightly light green plants (E) after dark induced senescence. Two leaves of each plant were covered with mittens for 6 days in order to induce senescence and after uncovering the mittens, the plants retaining green color of their covered leaves were selected. After 6 days in darkness the wild types plants had yellow leaves, while stay green, light green and slightly light green plants had maintained the green color of their leaves even after 6 days of covering. The leaves which were uncovered after dark incubation period are marked with yellow tags.
Chlorophyll contents
The chlorophyll loss is a primary symptom of senescence induction and plants start getting yellow. In general the stay green lines maintained a considerable higher amount of chlorophyll content even after 6 days of covering while wild types plants show significant loss of chlorophyll content in darkened leaves as shown in figure 2A. All stay green lines and in particular 19/29, 1 9 /456 and 19/531 lines retained almost similar amount of chlorophyll content in their uncovered and darkened samples. Even after 6 days of dark treatment, the 19/1043 plant was able to maintain the highest total chlorophyll content among all stay green lines. The chlorophyll content of 19/1043 plant was much higher than wild type darkened samples as shown in figure 2A.
22
Figure2. Chlorophyll contents in leaves of stay green plants of uncovered leaves and leaves after 6 days in darkness.
In figure (2A) the green bars represent total chlorophyll content of uncovered leaves, while yellow bars show the total chlorophyll content of darkened leaves. Figure (2B) represents the proportion of dark/uncovered of Chlorophyll and protein content of stay green plants measured after 6 days of covering. The green bars represent the relative chlorophyll content, while the red bars stand for the relative proteins content. The chlorophyll and proteins content were measured on leaf area basis.
The proportion of chlorophyll of darkened leaves to uncovered leaves was calculated for stay green and light green plant (figure 2B&3B). On the whole, after dark treatment the stay green lines retained more chlorophyll than light green lines and wild type. The wild type plants were able to retain only 12% of chlorophyll as compared to 19/29 and 19/456 stay green plants which maintained 92% of chlorophyll content. Moreover the stay green
0 5 10 15 20 25 30 35 40 45 chl/leaf area ug /cm 2
Chlorophyll content of stay green
plants
uncovered darkened2A
0 10 20 30 40 50 60 70 80 90 100Relative chlorophyll and protein
content(%)
Stay green lines
chlorophyll protein
23
lines 19/776 and 19/531 maintained 85% chlorophyll as shown in figure2B. On average all other stay green lines preserve about 60% of chlorophyll. The 19/727 plant had 55% of chlorophyll which was minimum among all classified stay green lines.
The total chlorophyll content in dark treated leaves of light green lines was significantly higher than wild type dark treatment but lower than stay green lines as shown in figure 3A.
Figure 3: Chlorophyll content in leaves of light green plants of uncovered leaves and leaves after 6 days of dark
treatment. In figure 3A, the green bars designate the total chlorophyll content of uncovered leaves; while yellow bars show the total chlorophyll content of darkened leaves. While in figure 3B, the green bars refers to chlorophyll dark/uncovered proportion while red bars indicate the proteins dark/uncovered proportion in light green samples.
0 5 10 15 20 25 30 35 40 WT 19/179 19/47 19/206 19/762 19/732 19/668 19/721 19/911 19/953 19/810 19/871 19/860 19/815 chl/leaf area ug/ cm 2
Chlorophyll content of light green
plants
uncovered darkened3A
0 10 20 30 40 50 60 70 80 90 100 WT 19/179 19/47 19/206 19/762 19/732 19/668 19/721 19/911 19/953 19/810 19/871 19/860 19/815Relative chlorophyll and protein
content(%)
Light green lines
chlorophyll protein
24
The relative chlorophyll content in wild type plants was predominately lower than stay green plants and light green after dark incubation period. In light green plants, the 19/668 was able to maintain highest proportion of chlorophyll (68%) while only two other lines 19/810 and 19/911 have chlorophyll above 60%. All other lines retained on average about 40% chlorophyll and the line 19/47 maintained only 25% of chlorophyll as shown in figure 3B. These results show that in terms of chlorophyll content there is a significant difference among wild type, stay green and light green leaves.
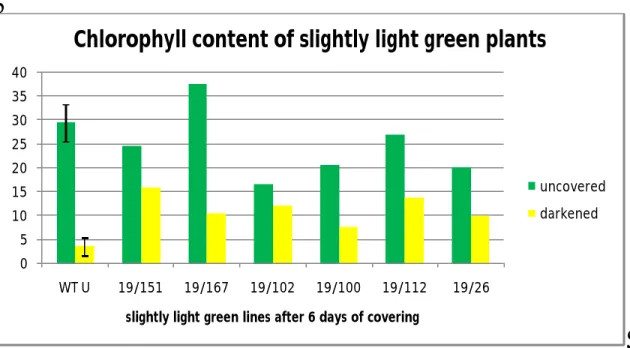
The chlorophyll content of slightly light green plants was also measured and it was observed that their chlorophyll content was comparatively lower than stay green and light green plants as shown in figure 7(Appendix I). Probably this may correspond to their slightly light green phenotype which was also “less green” than stay green and light green plants (The absolute values of total chlorophyll content of slightly light green plants are shown separately in appendix I as a supplementary data).
The yellowing of leaves and chlorophyll degradation are simple and of discrete significance for leaf senescence. However, on the basis of chlorophyll content alone, it is not possible to identify a functional stay green mutant, as there are some cosmetic stay green plants that maintain the green color of their leaves because of having lesions in their chlorophyll catabolism pathway so they cannot degrade chlorophyll (Hörtensteiner 2009). So as a first step to differentiate functional and cosmetic stay green plants, the protein content of stay green and light green lines was measured.
Proteins
content
The protein quantification assay was carried out to calculate the concentration of the total protein in each sample. The stay green plants maintained relatively higher protein content in contrast to light green and wild type plants. In general, the protein content showed similar pattern of retention as chlorophyll content. The total protein content of 19/29, 19/192 19/1043 and 19/531 stay green lines were significantly higher than other stay green and light green lines as shown in figures 4A&4B.
The wild type plants retained only 25% of relative protein compared to 19/29 stay green line, which maintained almost 90% of protein (figure2B). Besides that, the stay green lines 19/1043 and 19/531 maintained 82% and 76% of protein respectively, that was significantly higher than other plants as shown in figure 2B. All other stay green lines
25
preserved almost 60% of protein, which is same as in chlorophyll ratio in their respective samples.
In contrast, all the light green lines retained on average 47% of relative protein content. The 19/815 light green plant had 87% of relative protein while its respective chlorophyll D/U proportion was just 35 % which was unexpected as shown in figure 3B.
Figure 4: Total protein content of stay green (4A) and light green (4B) plants measured on leaf area basis after 6 days
of dark incubation period. The green bars symbolize the total protein content in uncovered samples, whereas the yellow bars stand for total protein content in darkened samples.
Comparing both parameters, all the stay green lines had higher retention of chlorophyll than protein except two stay green lines; 19/1043 and 19/727, which had higher relative protein than chlorophyll in their samples. As a consequence, the stay green and light
0 0.5 1 1.5 2 2.5 3 3.5 protein content ug/ul
Protein content of stay green plants
uncovered darkened
4A
0 0.5 1 1.5 2 2.5 3 3.5 protein content ug/ulProtein contents of light green plants
uncovered darkened
26
green lines sustained considerably higher chlorophyll and protein content than wild types plants.
Chloroplastic and mitochondrial proteins
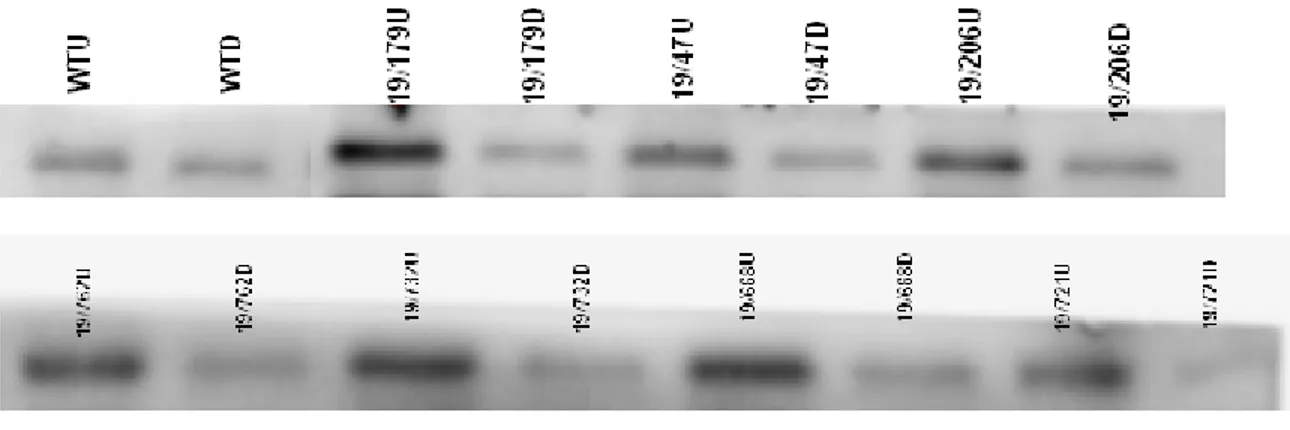
Retention of green color and protein was not sufficient to distinguish between functional and cosmetic stay green plants; subsequently it was decided to analyze the individual protein like Rubisco LSU (large subunit), COXII, GS1 and GS2 a s an indication of photosynthetic and respiratory capacity in stay green plants. Rubisco LSU and GS2 are chloroplastic proteins; COXII is a mitochondrial protein while the GS1 is a cytoplasmic protein.
As it is clearly visible from figures 5&6 that all stay green and light green dark treatments had shown relatively more intense bands of rubisco LSU and GS2 than wild type dark samples, whereas the COXII protein is retained considerably in all wild type, stay green and light green dark treatments. Moreover, in wild type plants after dark treatment, the GS1 bands turned out to be more intense than stay green and light green GS1 bands. In the wild type, dark treatment caused degradation of the chloroplast proteins (RbcL and GS2) whereas COXII and GS1 decreased much less. In contrast to wild type dark treatment, the stay green lines particularly 19/1043 and 19/531after dark treatment have shown significant retention of chloroplast and mitochondrial protein (RbcL and GS2 and COXII respectively) than other stay green lines. Furthermore, their cytosolic protein (GS1) bands are less intense than their corresponding GS2 bands as shown in figure5C. The stay green lines (19/29, 19/192, 19/722, 19/987, 19/1043 and19/531) have shown almost the equal intensity of RbcL bands in their both uncovered and dark treated samples as compared to other stay green lines shown in figure 5A. While for COXII, GS1 and GS2 proteins, only19/1043 and 19/531 lines were able to retain their bands intensities to a significant level after dark treatment (figures 5B&5C). The 19/1043 and 19/531 covered samples have shown almost same amount of protein, as in wild type uncovered samples (figure 5). The stay green dark treated plants had maintained higher level of proteins than wild type and light green dark treatment. On the whole, based on intensity of protein bands, the stay green uncovered samples contained comparatively higher protein contents than their respective covered samples.
27
(5A) Rubisco LSU
(5B). COXII
(5C) GS1 and GS2
Figure 5: Relative Rubico LSU (5A), COXII (5B), GS1and GS2 (5C) content in stay green plants on leaf area basis.
For the relative level of RbcL, COXII, GS1 and GS2 the total proteins from leaf discs were extracted, and separated by SDS-PAGE and then transferred to nitrocellulose membrane by western blotting. The target proteins were identified by respective antibodies. The “U” stands for uncovered samples while “D” refers to the dark treatment for 6 days.
28
In general, after dark treatment the light green plants had degraded more protein content than stay green plants (figure6). Similarly as in stay green lines; in light green lines the rubisco LSU protein bands were relatively more intense than their corresponding COX II, GS1and GS2 proteins bands (figures 5&6). The 19/815D plant retained higher level of chloroplast and mitochondrial proteins (RbcL, GS2 and COXII respectively) than other light green lines. In 19/47, 19/206 and 19/668 darkened samples, the GS1 bands were as intense as in wild type darkened GS1 bands. Moreover, their GS1 bands were more intense than their corresponding GS2 bands.
During senescence, in wild type dark samples the level of Rubico, COXII, and GS2 decreased noticeably, whereas the GS1 level increased considerably after senescence initiation. On the other hand, stay green and light green lines have maintained these proteins contents to a certain level. These results depict that stay green mutants delayed the chloroplastic (RbcL and GS2) and mitochondrila (COXII) proteins degradation.
Light green
29
(6B). COXII
(6C) GS1 and GS2
Figure 6: Changes in relative Rubico LSU (6A), COXII (6B), and GS1and GS2 (6C) content in light green plants
during dark induced senescence. Relative proteins were measured on leaf area basis both for stay green and light green plants samples. For SDS-PAGE the equal volume (5ul) of each sample was loaded per lane.
30
DISCUSSION
I n t h i s project mutants that showed delayed leaf senescence under dark induced senescence were isolated. In our experimental setup two leaves of each plant were covered with “mittens” for 6 days in order to induce senescence and after uncovering mittens the plants, where the covered leaves were still green were selected for further analysis. These stay green mutants showed delay of different senescence symptoms like loss of chlorophyll content resulting in retention of green color during dark incubation and loss of total protein content. The mutants having ability to stay green longer than their parental types are defined as stay green plants (Thomas and Smart1993) The plants which retain the photosynthetic activity are functional stay green while, cosmetic stays green are unable to retain their photosynthetic activity. In different species like in
Arabidopsis thaliana, Triticum aestivum and Zea mays functional stay green mutants are
identified till date (Hörtensteiner 2009). Moreover, the functional stay green plants can be of applied interest since they can enhance the grain yield in agronomic crops by maintaining photosynthetic activity for longer time compared to wild type (Thomas and Howarth 2000).
Phenotype
On the basis of phenotypic analysis the wild type covered leaves after dark incubation period showed clear symptoms of senescence like complete yellowing of leaves with apparent signs of dryness and death at their leaf margins as demonstrated in wild type pictures in figure1. On the other hand, the stay green plants had shown the retention of green color in their covered leaves after dark period; their covered leaves have similar level of apparent greenness as with uncovered wild type leaves.
After 6 days of dark incubation period, these plants (19/29, 19/190, 19/192, 19/776, 19/722, 19/727, 19/987, 19/1043, 19/456 and 19/531) had retained their green color. These are probably stay green plants as shown in pictures of figure 1. We also found a number of light green plants 19/179, 19/47, 19/206, 19/762, 19/732, 19/668, 19/721, 19/911, 19/953, 19/810, 19/871, 19/860 and 19/815, which appear a bit lighter in greenness than stay green plants.
The 19/1043 stay green plant, had distinct phenotype as compared to the other stay green plants. Its uneven leaves, more green color and its smaller size than wild type plants may
31
suggest that it has low rate of energy metabolism, which can cause a delay in senescence process. The ore4-1 delayed leaf senescence mutant exhibits lower growth rate compared to wild type, so it must have lower rate of energy metabolism (Woo et al 2002), and this reduction in metabolism is accountable for its longer life span. This T-DNA- insertional mutation confines different chloroplast functions including photosynthesis which results in plant’s lower growth rate.
In stay green plants, the senescence process was delayed but after prolonged darkness they started to senesce. In the stay green plants 19/29, 19/192, 19/776,19/1043 and 19/531 the process of senescence was delayed but ultimately it does occur. In ore1, ore3 and ore9 stay green mutants the senescence was only delayed but finally it started during flowering and seed production. Their leaves were turned yellow coupled with dryness and death signs (Oh et al. 1997). In conclusion, it was notable that leaf senescence was only delayed but ultimately does occur.
Chlorophyll and protein measurement
The parameters related to photosynthesis such as chlorophyll content and relative amount of the large subunit of rubisco were measured in order to look for photosynthetic activity of stay green and light green plants to differentiate whether these are functional or cosmetic stay green. Green color loss is a noticeable sign of senescence, which can be analyzed by measuring amount of chlorophyll, so chlorophyll catabolism and yellowing of leaves are biomarkers of senescence (Ougham, et al 2008). Buchanan-Wollaston et al (2005) further reported that during senescence there is increased expression of genes involved in pathways of chlorophyll breakdown.
All stay green plants and particularly 19/29, 19/776, 19/1043, 19/456 and 19/531 have shown very limited degradation of chlorophyll and proteins contents compared to wild type plants, even after dark incubation period of 6 days as shown in figure 2A,2B &4A. Yoshida et al (2002) reported that the dls mutant isolated from Arabidopsis has the same stay green phenotype as the oresara 1 and oresara 9. The best known functionally stay green mutants like dls, ore1, ore3 and ore 9 maintain their stay green phenotypes both under age dependent and dark induced senescence and they delay the degradation of chlorophyll and proteins content as well (Woo et al 2001 ;Oh et al. 1997).
32
On the other hand light green plants have shown significant degradation of chlorophyll and protein content after dark incubation. Except 19/668 all other light green plants have shown notably higher degradation of chlorophyll and protein contents as compared to stay green plants as shown in figures3A, 3B&4B. The 19/47 light green plant has shown almost similar chlorophyll degradation as in wild type dark treatment (figure3A).
Rubisco LSU decrease during senescence
Rubisco is a major leaf protein and a source of nitrogen during senescence. Rubisco being a chloroplastic protein starts degrading during earlier stages of senescence. T he rubisco nitrogen is transferred from senescing organs to growing parts like leaves or fruits via phloem in the form of amino acids or peptides (Feller et al 2008). The stay green lines 19/29, 19/192, 19/987, 19/1043 and 19/531 have retained higher level of LSU of rubisco which is an indicator that their leaves are potentially photosynthetically active. The stay green plants had shown different levels of rubisco LSU in their samples and the level of rubisco represents the photosynthetic capacity of leaf tissues.
By measuring chlorophyll content, photochemical efficiency and membrane ion leakage it was concluded that ore9 is a positive regulator of senescence and it may act upstream of senescence cascade pathway. The ore9 mutants retain higher level of rubisco small subunit during natural and hormone induced senescence while it decline considerably in control plants (Woo et al 2001)
Mitochondrial and chloroplastic proteins
Mitochondria remain intact until late stages of senescence in order to provide energy for remobilization of nutrients. Due to this reason the wild type plants had shown retention of COXII bands even after dark incubation period (figures 5B&6B). This may suggest that, even though the senescence process has started but mitochondria will remain intact until the last stages of senescence. The stay green lines 19/29, 19/722, 19/1043 and 19/531 had maintained significantly higher levels of COXII in their respective dark samples than wild type darkened samples, which symbolize that the mitochondria could be still functional and is not yet degraded even after dark incubation for 6 days. On contrary in light green plants like 19/47, 19/762, 19/732, 19/668 and 19/721, darkened samples had shown significant degradation of COXII as shown in figure6B; taking into account that might be mitochondrial degradation has started.
33
The protein degradation is one of the most distinctive markers of senescence. However there is an exception of GS1 which increased during senescence while its counterpart GS2 levels reduced considerably during senescence. The l e v e l o f G S 1 ( cytosolic glutamine synthase) increased gradually and then remained at constant level in rice. A similar pattern was observed in mRNA level of GS1during senescence (Kamachi et al 1991; Sakurai et al 1996). In wild type plants after 6 days in darkness, the GS1 (a lower band of 41Kda) bands become more intense than GS2 (upper band of 44 Kda) bands, showing that GS1 level has increased during dark induced senescence (figures 5C&6C). Likewise, the light green lines 19/47, 19/206 and 19/668 after dark treatment had also shown the increased level of GS1, similar as in wild type dark treatments suggesting that the senescence process has initiated as these plants are not true stay green plants. While at the same time, in the stay green plants (19/1043 and 19/531) after dark treatment, the GS2 upper band of 44 Kda is comparatively more visible than lower GS1 band which is similar as in wild type uncovered plants, proposing that the senescence process is delayed. This concludes that the level of GS1 is increased during senescence and total GS level is decreased in senescence, while the stay green lines maintain GS1 and GS2 in their darkened samples and follow the same pattern as in wild type uncovered plant. To summarize the above described results, the wild type dark treatment had shown a significant degradation of chloroplast proteins (RbcL and GS2) whereas they were able to maintain mitochondrial (COXII) and cytosolic(GS1) proteins to a certain level. This can be explained by the fact that during senescence, the chloroplast is the first organelle to be degraded and subsequently the chloroplast proteins (RbcL and GS2) have started degradation. The mitochondria, on the other hand remained intact until late stages of senescence so mitochondrial protein (COXII) is retained to a certain level (Keech et al 2007). In wild type dark treatment, the GS1 level is increased as a typical symptom of senescence (figures5&6).
The stay green lines (particularly 19/29, 19/1043 and 19/531) even after dark treatment maintained the chloroplastic and mitochondrial proteins (RbcL, GS2, and COXII respectively) to considerable level and cytosolic proteins (GS1) to a certain level, same as in wild type uncovered plants. This may suggest that in these lines, the chloroplasts and mitochondria are still intact and the senescence process is delayed. In addition to this,
34
these lines had also higher chlorophyll contents as described earlier in figure 4A. So, there can be a correlation existing in between chlorophyll contents and chloroplast protein (RbcL and GS2) and these lines could be competent to sustain their photosynthetic capacity. On the other hand light green lines retained comparatively more RbcL than other proteins in their dark treated leaves. After dark treatment, the light green lines (19/47D, 19/206D 19/762D, 19/668D and 19/721D) had shown a significant degradation of chloroplast and mitochondrial proteins (GS2 and COXII respectively) almost similar as in wild type dark samples. This may propose that chloroplast and mitochondria degradation had been taking place during dark induced senescence. Furthermore, in 19/47D, 19/206D and 19/668D the cytosolic protein (GS1) level is increased similar as in wild types dark treatment which is a typical characteristic of senescence induction. These results may suggest that these light green lines could be the candidates for cosmetic stay green.
Cosmetic stay green plants
Cosmetic stay green phenotypes can only retain green color due to lesion in chlorophyll catabolism pathways but lose their photosynthetic activity (Spano et al 2003). In contrast to the stay green plants, the light green mutants 19/47D, 19/206D 19/762D, 19/668D and 19/721D have shown significant degradation of Rubisco, COXII and GS2 and they could be the candidates for cosmetic stay green plants. In cosmetic stay green plants the loss of photosynthetic activity can be due to several factors including degradation of proteins, particularly rubisco and PSII, and membranes damage during senescence processes (Thomas 1987).
According to Thomas et al (2002) generally rubisco degradation is coupled with chlorophyll catabolism during senescence process, but in some exceptions, like in cosmetic stay green plants, this correlation does not exist due to of lesions in chlorophyll catabolism pathways; the chlorophyll cannot be degraded properly so it shows stay green phenotypes. Likewise, the light green plants 19/47D, 19/206D 19/668D and 19/721D could be cosmetic stay green plants as they only show delay in green color and chlorophyll loss, while showing degradation of other proteins such as GS2 and COXII and RbcL to some extent. Accordingly, these mutants have probably lesions in their chlorophyll degradation pathway.
35
The results obtained by Sato et al (2007) also support this idea. According to them the sgr mutant (cosmetic stay green mutant) demonstrate a stay green phenotype during dark induced senescence. These sgr mutants maintain 58% and 66% of chl a and chl b contents even until later stages of senescence. The sgr mutants cannot retain Fv/Fm ratio and membrane ion leakage was also not delayed. In addition the Rubisco large subunit was also degraded normally resulting in that sgr is nonfunctional stay green mutants. Spano et al. (2003) claimed that the stay green mutants in wheat retain green color of leaves after dark incubation period; they delay the loss of chlorophyll and maintain Fv/Fm ratio longer time than control plants so they are functional stay green plants. The stay green lines 19/29, 19/1043 and 19/531 had shown the delayed phenotype not only in chlorophyll degradation but also in protein degradation. Furthermore, the retention of chloroplastic and mitochondrial proteins content, especially in 19/1043 and 19/531 stay green lines, can suggest that probably they do maintain their photosynthetic and respiratory capacity and could be candidates for functional stay green plants. Oh et al (1997) have got the same comparable results in Arabidopsis; they identified the three
ore1, ore3 and ore9 stay green mutants in Arabidopsis by measuring chlorophyll
contents, photochemical efficiency of PSII and rubisco LSU. In 19/47D, 19/206D, 19/668D and 19/721D plants on basis of phenotypes, chlorophyll and protein contents it may suggest that they might have lesions in progression of senescence process so they can be the cosmetic stay green.
Conclusion
Above described experiment conclude that
1. In this experiment, plants with delayed leaf senescence were selected and categorized
as stay green, light green and slightly light green plants.
2. Functional stay green plants delay total chlorophyll and protein contents, rubisco
LSU, COXII and GS2 degradation, while the cosmetic stay green plants only delay chlorophyll degradation.
3. There are no significant differences in chlorophyll and protein content of the
potentially functional stay green like 19/29, 19/1043 and 19/531 dark leaf samples and wild type uncovered leaf samples.
36 4. There is a correlation between chlorophyll content and chloroplastic proteins (rubisco
and GS2) of potentially functional stay green plants suggesting that they may maintain their photosynthetic capacity
5. The selected 19/29, 19/531 and 19/1043 stay green plants delay the leaf senescence
and possibly could be the candidates for the functional stay green plants.
6. During senescence induction, the cytosolic GS1 protein level increased. The
candidates for cosmetic stay green lines such as 19/47, 19/206 and 19/668 had similar level of GS1 as in wild types dark samples.
Future prospects
There could have been more possibilities to confirm the functional stay green mutant, for instance the photosynthetic capacity of stay green plants could have been measured. Matthieu Bagard has measured the photosynthetic activity of 19/727, 19/192, 19/722 and 19/776 lines and has shown that these lines have higher photosynthetic activity after dark treatment than wild type plants. The photosynthetic activity of selected 19/29, 19/531 and 19/1043 stay green plants will be measured in upcoming experiments. The future experiments involve the cleaning up of selected stay green and light green plants by back crossing with wild type in order to create a mapping population. The goal is to identify the genes involved in senescence process.
Acknowledgements
I wish to thank the people who helped and supported me during my degree project. First of all I would like to pay a bundle of thanks to my supervisor Per Gardeström for giving me a chance in his lab to accomplish this project and also for being such a calm and cooperative supervisor. Secondly I am very grateful to my group members Bastian Brouwer and Matthieu Bagard for their kind support and guidance and especially Agnieszka Ziolkowska for her help and guidance for all experimental work with out her this work could not have been done.
Last but not the least; I would like to thank all the people at the department for being so helpful and friendly.
37
References
1. Andersson A, Keskitalo J, Sjödin A, Bhalerao R, Sterky F, Wissel K, Tandre K, Aspeborg H, Moyle R, Ohmiya Y, Brunner A, Gustafsson P, Karlsson J, Lundeberg J, Nilsson O, Sandberg G, Strauss S, Sundberg B, Uhlen M, Jansson S, Nilsson P (2004) A transcriptional timetable of autumn senescence. Genome Biology 5: R24
2. Armstead I, Donnison I, Aubry S, Harper J, Ho¨rtensteiner S, James C,Mani J, Moffet M, Ougham H, Roberts L, Thomas A, Weeden N, Thomas H, King I (2007) Cross-species identification of Mendel’s I locus. Science 315:73
3. Buchanan-Wollaston V, Earl S, Harrison E, Mathas E, Navabpour S, Page T, PinkD (2003). The molecular analysis of leaf senescence – a genomics approach. Plant Biotechnology Journal 1, 3-22
4. Buchanan-Wollaston V., Page T., Harrison E., Breeze E., Lim P.O., Nam H.G., Lin J.F., Wu S.H., Swidzinski J., IshizakiK., Leaver C.J. (2005) Comparative transcriptome analysis reveals significant differences in gene expression and signalling pathways between developmental and dark / starvation induced senescence in Arabidopsis. Plant Journal 42, 567–585
5. Feller U., Anders I., and Mae T. (2008) Rubiscolytics: fate of Rubisco after its enzymatic function in a cell is terminated. Journal of Experimental Botany, 59, 1615–1624.
6. Finnemann, J. and Schjoerring, J.K. (2000) Post-translocational regulation of cytosolic glutamine synthetase by reversible phosphorylation and 14-3-3 protein interaction. Plant J. 24, 171–181.
7. Gan, S. and Amasino, R.M. (1997) Making sense of senescence.Plant Physiol. 113, 313–319
8. Himelblau, E. and Amasino, R.M. (2001) Nutrients mobilized from leaves of Arabidopsis thaliana during leaf senescence. J. Plant.Physiol. 158, 1317–1323 9. Hörtensteiner, S (2009) Stay green regulates chlorophyll and chlorophyll binding
protein degradation during senescence. Trends in plant sciences Trends Plant Sci.14 (3):155-62.
38
10. Kamachi K, Yamaya T, Mae T, Ojima K (1991). A role for glutamine synthetase in the remobilization of leaf nitrogen during natural senescence in rice leaves. Plant Physiol 96:411–417
11. Keech O., Pesquet E., Ahad A., Askne A., Nordvall D., Vodnala S. M., Tuominen H., Hurry V., Dizengremel P., Gardestrom P. (2007) The different fates of mitochondria and chloroplasts during dark-induced senescence in Arabidopsis leaves. Plant Cell and Environment 30: 1523–1534.
12. Kusaba, M. et al. (2007) Rice non yellowing coloring 1 is involved in light-harvesting complex II and grana degradation during leaf senescence. Plant Cell 19, 1362–1375.
13. Lim P. O., Kim H. J., Nam H. G (2007). Leaf Senescence. Annual Review of Plant Biology 58:115–36.
14. Lim PO, Woo HR, Nam HG (2003). Molecular genetics of leaf senescence in
Arabidopsis.Trends Plant Sci. 8:272–78
15. Noode´ n, L.D., Guiame´ t, J.J. and John, I. (1997) Senescence mechanisms. Physiol Planta., 101, 746–753
16. Oh, S.A., Park, J.-H., Lee, G.I., Paek, K.H., Park, S.K., and Nam, H.G. (1997). Identification of three genetic loci controlling leaf senescence in Arabidopsis
thaliana. Plant J. 12, 527–535.
17. Ougham, H. et al.(2008). The control of chlorophyll catabolism and the status of yellowing as a biomarker of leaf senescence. Plant Biol. 10(Suppl. 1), 4–14
18. Porra R. J., Thompson W. A., Kriedemann P. E. (1989) Determination of accurate extinction coefficients and simultaneous equations for assaying chlorophylls a and
b extracted with four different solvents: verification of the concentration of chlorophyll standards by atomic absorption spectroscopy. Biochimica et Biophysica Acta 975:384-394.
19. Quirino BF, Noh YS, Himelblau E, Amasino RM (2000) Molecular aspects of leaf senescence. Trends in plant Science 5:278-282.
20. Sakurai, N., Hayakawa, T., Nakamura, T. and Yamaya, T. (1996) Changes in the cellular localization of cytosolic glutamine synthetase protein in vascular bundles of rice leaves at various stages of development. Planta, 200, 306–311.