http://www.diva-portal.org
Postprint
This is the accepted version of a paper published in Measurement science and technology. This paper has been peer-reviewed but does not include the final publisher proof-corrections or journal pagination.
Citation for the original published paper (version of record):
Khademagha, P., Aries, M., Rosemann, A L., Loenen, E J. (2018)
A multidirectional spectral measurement method and instrument to investigate non-image-forming effects of light
Measurement science and technology, 29(8): 085902
https://doi.org/10.1088/1361-6501/aac937
Access to the published version may require subscription. N.B. When citing this work, cite the original published paper.
Permanent link to this version:
1
A multidirectional spectral measurement method and instrument to investigate
non-image-forming effects of light
P. Khademaghaa*, M.B.C. Ariesa,b, A.L.P. Rosemanna, and E.J. van Loenena,c
a Building Lighting Group, Department of the Built Environment, and Intelligent Lighting Institute, Eindhoven University of Technology, Eindhoven, The Netherlands b School of Engineering, Department of Construction Engineering and Lighting Science, Jönköping University, Jönköping, Sweden
c Philips Research, Eindhoven, the Netherlands
*Corresponding author
Abstract
Light directionality, spectrum, and relevant radiometric or photometric quantity are believed essential factors influencing the magnitude of non-image-forming effects. In this paper, a measurement method and an instrument (the multidirectional spectroradiometer – MuS) is proposed, which considers different light incidents and spectra simultaneously, therefore, enables measurement of light characteristics relevant for non-image-forming effects. The MuS consists of four spectroradiometers measuring in different directions. Four spectrometers using optical fibers were configured to measure the spectral irradiance within a wavelength range from 200 to 1100 nm with ~5.7 nm pixel resolution. Application of the MuS facilitates a better understanding of the non-image-forming light characteristics of spaces. The MuS is tested with stable electric lighting as well as with dynamic daylight conditions and proven reliable to perform continuous spectral measurements for different directions simultaneously. Results of test measurements in dynamic daylight conditions show differences in spectral distribution and measured irradiance of up to 30 times in different directions.
Keywords: light incident, spectrum, (day)lighting design, health and well-being
1
Introduction
Accurate measurement is an essential part of any (day)lighting professional’s life. Without correct measurements, design, research, and improvements are hardly feasible. Light falling on the retina is not only essential for its Image-Forming (IF) effects enabling humans to perform visual tasks, but also for its Non-Image-Forming (NIF) effects [1] influencing health and well-being through a set of short-term (acute) or long-term (e.g., circadian) biological and behavioral effects. Intrinsically photosensitive Retinal Ganglion Cells (ipRGCs) provide primary input for stimulation of the NIF effects [2–5].
Six factors influencing the stimulation of the NIF light effects have been reviewed [6]. When daylight is the primary light source, factors such as directionality, spectrum, and relevant radiometric or photometric quantity of light reaching indoor are influenced mainly by façade design and interior design of spaces (e.g., office rooms), whereas factors like time of the day, duration of exposure to daylight, and exposure history
2
depend mostly on the user behavior in buildings [6]. That is to say, when characteristics of illumination in indoor spaces (e.g., office rooms) are concerned with regard to the NIF light effects, relevant radiometric or photometric quantity in context with directionality and spectrum are to be studies and measured. The term directionality refers to the incidents of radiation. The relevant radiometric quantity to be determined when the NIF light effects are concerned is the weighted irradiance at the eye [7–9].
To quantify NIF light effects, the spectral sensitivity of the NIF system, which differs from that of an IF system (photopic vision) should be considered. Since the spectral sensitivity of the NIF system is not standardized yet, one can weigh the measured spectral irradiance with the spectral sensitivity of all photoreceptors (ipRGCs, rods, and cones) involved in the stimulation of NIF effects or with the spectral sensitivity of a biomarker for the respective NIF effects. For instance, in laboratory experiments with human subjects, nocturnal suppression of melatonin, the hormone that regulates the sleep-wake cycle, has often been chosen as a biomarker for the NIF system. In doing so, one can choose the spectral sensitivity of melatonin suppression at night e.g., C(λ) [10] and determine weighted irradiance with respect to C(λ) instead of illuminance when the NIF light affects are concerned.
The majority of commercially available lighting measurement instruments are designed to measure light with respect to its IF effects. This is due to the fact that current standards for (day)lighting design are solely based on the IF system. As the attention to NIF light effects amongst (day)lighting professionals and the attempts to include these effects in (day)lighting design and evaluation [11–14] is increasing, so does the need for a correct measurement method and instrument. The existing wearable devices that measure illuminance and weighted irradiance are designed to characterize the personal light history [15]. They do not record the NIF characteristics of illumination in a given space.
Directionality of light is another key factor for the stimulation of NIF effects. In studies that have investigated light directionality [16–19], four distinct retinal areas have been distinguished: inferior (lower side), superior (upper side), nasal (on the nose side), and temporal (on the ear side) areas. Relative to a point of gaze, retinal areas have an inverse relationship with the visual fields as shown in Figure 1. These areas in the retina or visual field are not strict regions but rather a rough indication.
3
Figure 1. The reverse relationship between the visual fields and the retinal areas. The inferior retina corresponds to the upper visual field (orange color), the superior retina to the lower visual field (green color). For the right eye,
the nasal retina corresponds to the outer visual field (blue color) and the temporal retina to the inner visual field (red color).
Findings from nighttime laboratory experiments on light directionality have shown that melatonin suppression was significantly higher (p<0.05) when the inferior [16,17] and the nasal [18,19] human retinal areas were illuminated compared to the superior and the temporal ones. Whether the inferior and nasal areas are more sensitive when NIF effects are concerned or contain a higher density of ipRGCs and thus are more effective is still unknown [16].
Light directionality and spectrum has been considered in different measurement methods and instruments for outdoor applications in which the aim was to perform multidirectional spectral measurements of sky radiance [20–24]. In some methods, fish-eye-lenses have been applied to improve the spatial and temporal resolution at the cost of a low spectral resolution [25–27]. Although some filtering methods have been introduced to improve the spectral resolution of such systems [28,29], the improved spectral resolution is lower compared to measurements with spectroradiometers.
Directionality of light, in addition to its spectrum, has not been considered in describing the NIF characteristics of the illumination in indoor spaces yet. Including light directionality in measurements is particularly important for spaces where the light directionality changes constantly and fast. This is the case for day-lit environments, as daylight is dynamic in the spectrum as well as in the radiance distribution [20]. Recently, an instrument is developed particularly for spectral radiance measurement of the sky simultaneously in 113 directions [27]. Although the spectral and directional (spatial) resolution provided by this method is high, such directional resolution may not be needed for investigation of the ocular NIF characteristics of the illumination inside a space. Therefore, in this paper we introduce a measurement method for NIF light effects including a simpler instrument for investigation of the ocular NIF characteristics of the illumination indoor.
4
2
Proposed measurement method and instrument design
An instrument called Multidirectional Spectroradiometer (MuS) is developed including four spectrometers to enable simultaneous multidirectional spectral measurements. Doing so, in a most simplified manner, it mimics the retina. Four spectrometers (Ocean Optics USB4000) using optical fibers (Ocean Optics QP400-2-SR-BX) were set up to measure the spectral irradiance within a wavelength range from 200 nm to 1100 nm with the pixel resolution of ~5.7 nm. Because of their placement in the MuS, each fiber (see Figure 3) is assumed to represent a visual field/retinal area, but can also unravel lighting conditions, such as with daylight, that have a high variety in incident radiation as well as its spectral and spatial distribution. Spectrometers often receive some stray light especially in the ultraviolet spectral range [30]. Sophisticated methods have been developed to correct for such phenomena [31]. Since the focus in this paper is on the visible radiation in indoor spaces, the influence of stray ultraviolet radiation is not further investigated. A schematic drawing of the MuS is shown in Figure 2. The instrument consists of a black coated aluminum ring (D=240 mm) designed to house the spectrometers without bending. The ring is fixed on a tripod allowing a position with different heights and orientations. For simultaneous measurements, spectrometers are connected to a computer via a USB extension hub. The MuS can be rotated by 90° to cover both horizontal (nasal, temporal) and vertical (superior, inferior) visual fields. The angle of rotation is controlled with the help of two levelers, which are placed on the ring and the tripod. Changing from the vertical to the horizontal positions, care should be taken to avoid significant bend. The influence of bending has not been investigated as in this study as the MuS is used only for measurements in the vertical position.
5
Figure 2. Schematic design of the multidirectional spectroradiometer (MuS) in a vertical position.
By attaching the fibers to different openings within the ring, each fiber looks at a different direction (area in the visual field), without an overlap between their field of view (FOV) (25°, specified by the manufacturer) to probe and cover the visual field. This result in fibers mounted at positions -25°, 0°, 25° and 50°, as shown in Figure 2. A control measurement has been performed to measure the actual practical FOV of the fibers (see section 3.1).
Figure 3 shows the areas of the visual field probed by the fibers on a binocular visual field after Boyce [5] for the horizontal and vertical orientation of the MuS. For its horizontal orientation, the fiber placed at -25° represents the inner (nasal) visual field; the fiber positioned at +-25° and +50° represent the outer (temporal) field. For the vertical orientation, the fiber placed at -25° represents the lower visual field; the fiber placed at +25° represents the upper visual field. The fourth fiber placed at +50° above the reference meter represents the extended upper visual field. It was decided to have a larger upper visual field instead of lower visual field to better record dynamic spectral radiance distribution of the sky in daylight measurements. Moreover, one fiber is placed at 0° to serve as a reference point when the ring is rotating.
6
Figure 3. The areas of the visual field probed by the fibers (estimated 25o FOV) shown on the human visual field
after Boyce [5] (with permission of CRC Press) with net and diagonal hatches for respectively the horizontal and vertical orientations of the MuS.
Figure 4 shows pictures of the MuS in the vertical and horizontal positions, in addition to the configuration of the fibers in those positions. Prior to the actual measurements, all spectrometers with the fibers attached were calibrated with the Ocean Optics radiometric calibration light source (HL-2000-CAL) using OceanView software in absolute irradiance measurement mode. The irradiance calibrated light source irradiates the full FOV of the fibers. Calibration results are given in the unit of irradiance [32]. To start the measurements, for every spectrometer, the dark spectrum was acquired and the calibration file was uploaded.
7
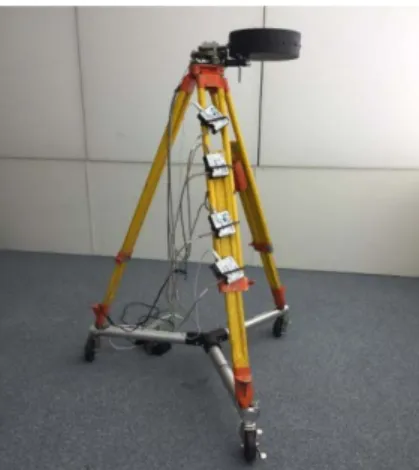
Figure 4. The multidirectional spectroradiometer (MuS) in vertical (above-left) and horizontal (above-right) position, as well as the configuration of the fibers in vertical (below-left) and horizontal (below-right) positions. The integration time during which light is captured should be adjusted for a constant and correct spectral measurement of rapidly changing daylight conditions (e.g., partly cloudy sky conditions with moving clouds). Therefore, a custom-made software has been developed using Microsoft Visual Studio 2015 and Ocean Optics spectrometer libraries (NETOmniDriver-NET40.dll and NETSpam-NET40.dll). The software enables an automated adjustment of the integration time for any specified time step to avoid saturation. As a result, the integration time is a dynamic variable. The initial integration time is set to 500 milliseconds. Integration time adjustments occur in steps of ±10% of the latest integration time. The integration time was adjusted when the maximum photon count is not within the defined limits of 55000 (upper) and 45000 (lower) count. The limits were set respectively at the 85% and 70% of spectrometer’s capacity of 65000 counts. In between sampling time (60 seconds), it was checked (every 5 seconds) whether the integration time corresponds to the rapidly changing daylight conditions. If the integration time was not within the defined boundaries, it was adjusted accordingly.
Table 1 shows the data acquisition parameters, their description, and implemented input. Spectral data were saved every minute in a .txt file and gathered simultaneously for all spectrometers. Data files included a header and three columns of results showing the absolute power and the photon count information per wavelength (ranging from 200 to 1100 nm in 3648 pixels). In the header, the adjusted integration time is included as well as a saturation message in case the adjustment of the integration time was not fast enough to avoid saturation.
Table 1. Data acquisition parameters used in the software, their description, and implemented input.
Parameters Description Value
Integration time Time length of a spectral acquisition (s) Automated* Scans to average Number of discrete spectral acquisitions that the driver collects
before averaging the outputted spectral data
3 Boxcar width Width of an averaging window that is used for smoothing
spectral data to reduce noise and increase the optical resolution (measurement points)
5
Sampling time Data recording repeat interval (s) 60 * Checked and adjusted (if necessary) every 5 seconds for the dynamic daylight measurements
8
3
Tests procedure
Three tests have been performed in this study to evaluate the performance of the proposed measurement method and the instrument:
1) Test to investigate the practical FOV of the spectrometers used in the MuS,
2) Test to evaluate the alignment of the MuS relative to measured surfaces as well as the influence of direct and indirect lighting on measurements, and
3) Test the performance of the MuS in a dynamic lighting condition (daylight).
The first and second tests were conducted in a windowless test room (test room 1) located at the Eindhoven University of Technology, the Netherlands. Figure 5 shows the measurement set-up designed for the test 1. The set-up includes a black flat surface with a semi-cylindrical shape with a radius of 0.62 m, which was placed at 0.62 m horizontal distance from the center of the MuS (0.50 m from the endpoints of the fibers). A small LED light source (XLamp XB-D Series/Royal blue/465 nm) was used as a point source and was mounted on the black surface. The light source was powered with a stabilized power supply at constant electric current (0.170 A ± (<= 0.5% + 5mA)). The LED was moved along the black surface in steps of one-degree (shown with black lines in Figure 5) from each individual fiber’s head. The FOV of the fibers can be spectral dependent [27]. However, the choice for LED light was made such that it coincide with the peak of C(λ) at ~ 460 nm. The expected 25° FOV of every fiber is shown in Figure 5 with dashed lines. For every fiber, 31 measurement points were recorded (-15° to +15°). This test was performed in dark and the LED light was the only light source switched on in the room.
Figure 5. Set-up for measuring the practical FOV of the fibers (left) and its graphical representation (right). Test room 1 (dimensions 3.6 m x 4.8 m x 2.8 m) was equipped with electric lighting, which was used to perform the second test. The lighting in the test room consisted of luminaire tiles (dimensions 1.2 m x 1.2 m) with a uniform diffuse cover (Philips Strato Sky TPH710 4*2*TL5 28W/827/865). Twelve luminaires in a three by four grid covered the ceiling, and three walls held three luminaires each at a height of 0.8 m. Every luminaire tile consisted of 4 x 2 TL5 lamps of 28W each with two different color temperatures (CCT
9
= 2700 K and 6500 K). The walls were white (luminous reflectance ρ = 0.83) and the floor was covered with a blue carpet (ρ = 0.20). Two lighting scenarios were implemented in test 2.
For the first lighting scenario, one wall luminaire (LumW) was used with 2700 K lamps to represent a
virtual window and a direct light source. In the second lighting scenario, two luminaires were used: one wall luminaire (LumW) with 2700 K lamps and one ceiling luminaire (LumC) with 6500 K lamps. The
ceiling luminaire was added to represent a virtual skylight and an indirect light source. The MuS (0o fiber)
was set at a height of 1.4 m, facing the middle of the wall luminaire, and placed in the middle of the room at 1.0 m distance (desk width) from the wall. Other furniture in the room were an office table, a chair, and computer equipment with two monitors, located behind the setup. Figure 6 shows a floor plan and a cross-section of test room 1 including the MuS and the furniture.
Figure 6. The floor plan (left) and cross-section (right) of test room 1 including the positioning of the
multidirectional spectroradiometer (MuS). Dimensions are given in m.
For test 3, the MuS was moved to test room 2, which has access to daylight. The room (dimensions 3.8 m x 5.2 m x 2.7 m) has a wall with two West-facing daylight openings (1.6 m x 1.8 m and 1.8 m x 1.8 m) placed at a distance of 0.2 m from the building’s fully glazed façade (double pane low E). The daylight openings were placed at 0.8 m height. Figure 7 shows the floor plan and a cross-section of test room 2 including the placement of the MuS. The walls were white (ρ = 0.83) and the floor was covered with a blue carpet (ρ = 0.20). The MuS (0o fiber) was set at a height of 1.2 m (eye height at sitting position), placed at
10
Figure 7. The floor plan (left) and cross-section (right) of test room 2 including the positioning of the multidirectional spectroradiometer (MuS). Dimensions are given in m.
4
Results
For post-processing, data from the multidirectional spectral measurements were analyzed using Python 3.5.1 (Anaconda3 4.0.0 64-bit) and MATLAB (R2016a). Total irradiance depends on the incident radiation (radiant flux) and the angle of incidence coming from all directions (π rad). Because measurements in this paper were performed with (bare) fibers with a limited FOV, we report the relative contributions to the total irradiance from each fiber.
The measured spectral data were averaged over 5 nm intervals for the visible wavelength range from 380 nm to 780 nm. Reported spectral data are result of a typical (single scan) measurement with scans to average and boxcar width of 3 and 5 respectively. Moreover, the relative contributions to the total irradiance values from each fiber were weighted by three action spectra: the C(λ) curve which represents an action spectrum for the NIF system [10], the melanopic curve that represents the action spectrum of ipRGCs [7], and the V(λ) curve as the action spectrum for photopic vision. By doing so, the contributions to the total irradiance from each fiber as well as the contributions to the weighted total irradiance with respect to the C(λ), the melanopic, and the V(λ) curves were calculated. Contributions to the weighted irradiance from the FOV (with respect to the effect X) were calculated using the following formula.
𝐸𝐸𝑒𝑒,𝑥𝑥= � 𝐸𝐸e,λ∙ 𝑋𝑋(λ) dλ
780 380
11
4.1 Practical field of view (FOV)
Knowing the practical FOV of the fibers is essential for reasoning about the differences in the relative contributions from each fiber to the total irradiance and thus the validation of the results. Figure 8 shows the result of the practical acceptance angle measurements for all fibers.
The results show a similar trend: a rising edge when the light source enters the FOV of the fiber, a peak when the light source falls fully within the FOV of the fiber, and a falling edge when the light source exits the FOV of the fiber.
Figure 8. The result of the practical FOV measurements for all fibers. Dashed lines show the practical FOV of each fiber.
The practical FOV of every fiber is defined as the area at which 99% of the light is collected. As a result, the FOV of the fibers positioned at +50°, +25°, 0°, and -25° was found to be 17°, 18°, 18°, and 20° respectively. Note that these FOVs are smaller than the commercially reported FOV of 25°, which has been determined by projecting light through the fiber and measuring the maximally visible size of the projected disk. If the practical FOV was larger than 25o, adjustments had to be made to avoid overlap
between the FOV of the fibers. This is not the case for the FOV smaller than 25o as the aim is that every
fiber represents an exclusive visual field/retinal area.
4.2 Alignment of the MuS
Two static lighting scenarios were implemented in the test room 1, to test the alignment of the MuS with measured surfaces (e.g., wall luminaires) and to study the influence of direct and indirect light on measurements. 0,0 0,5 1,0 -15 -10 -5 0 5 10 15 R el ativ e c o n tr ib u ti o n to th e to ta l ir rad ian ce Angle (degree) Series2 0,0 0,5 1,0 -15 -10 -5 0 5 10 15 R el ativ e c o n tr ib u ti o n to th e to ta l ir rad ian ce Angle (degree) Series3 0,0 0,5 1,0 -15 -10 -5 0 5 10 15 R el ativ e c o n tr ib u ti o n to th e to ta l ir rad ian ce Angle (degree) Series4 0,0 0,5 1,0 -15 -10 -5 0 5 10 15 R el ativ e c o n tr ib u ti o n to th e to ta l ir rad ian ce Angle (degree) Series5 +50o fiber +25o fiber 0o fiber -25o fiber
12
Figure 9 shows the lighting scenario with both LumW and LumC switched on (second lighting scenario),
the placement of the MuS, and the measuring station as well as the reported practical FOV of every spectrometer. This configuration was chosen such that the +25° and -25° fibers' distances from the wall were identical. The reference fiber (0°) faced the LumW entirely, while the +25° and -25° fibers partially
faced the LumW and partially the wall above and below the luminaire respectively. The +50° fiber faced
the wall above the LumW and a part of the LumC. Our first hypothesis was that in the first lighting scenario
with only the LumW switched on, the +25° and -25° fibers collect similar relative contributions to the total
spectral irradiances. Our second hypothesis was that for the +25° and -25° fibers the influence of indirect light when the second lighting scenario is applied is small compared to that of the direct light (first lighting scenario). Measurements were carried out after the fluorescent lamps were stabilized which was 30 minutes after the luminaires were turned on (differences in three sequential measurements were below 5%).
Figure 9. The lighting scenario in test room 1 with both luminaires (LumW&C) switched on t (left) and the measured
practical FOV of every fiber (right).
Figure 10 compares the relative contributions to the total spectral irradiance measured by the +25° and -25° fibers when the first lighting scenario was applied. In the case that only LumW was switched on, it was
expected to observe a slight increase of the relative spectral data measured by the -25o fiber due to its
slightly higher practical FOV. However, the results show that the slight increase in the relative spectral data belongs to the +25o fiber. This might be due to a minor misalignment of the MuS relative to the
luminaire wall. Note that, for example, a misalignment of the vertical axis of only 2 degrees would already result in approximately 24% difference in the relative contribution to the total spectral irradiance.
13
Figure 10. Relative contributions to the total spectral irradiance from the FOV of the +25° and -25° fibers compared when LumW was switched on.
In order to evaluate the influence of indirect light, the second lighting scenario was tested with both LumW
and LumC switched on as shown in Figure 11. Comparing Figure 11 and Figure 10 show that the influence
of indirect light (Lumc) with different spectral characteristics on the relative contributions to the spectral
irradiance of the +25° and -25° fibers is very small. The very small spectral influence of the LumC with a
high power in the wavelength range around 460 nm, can be seen in the Figure 11. Moreover, comparing the relative spectral data of these two fibers, one can also observe the influence of distance from the indirect light source on the spectral measurements.
Figure 11. Relative contributions to the total spectral irradiance from the FOV of the +25° and -25° fibers compared when both luminaires (LumW&C) were switched on.
Figure 12 shows the post-processed data for all fibers when both LumW and LumC were switched on. The
data show that whereas the +50o fiber does not have the highest contribution to the irradiance (E e) and
weighted irradiance with respect to V(λ) (Ee,v), it does have the highest contribution to the weighted
irradiance with respect to C(λ) (Ee,c) and melanopsin (Ee,m). This is a direct result of the fact that the +50o
fiber looks at the LumC with a higher CCT (2700 K).
0,0 0,5 1,0 350 400 450 500 550 600 650 700 750 800 R el ativ e c o n tr ib u ti o n s to th e sp ec tr al irra d ia n ce (W /m 2/n m) λ (nm) +25° fiber_Lum W -25° fiber_Lum W 0,0 0,5 1,0 350 400 450 500 550 600 650 700 750 800 R el ativ e c o n tr ib u ti o n s to th e to ta l sp ect ral i rr ad ian ce ( W /m 2/n m) λ (nm) +25° fiber_Lum W&C -25° fiber_Lum W&C +25o fiber _ Lum W -25o fiber _ Lum W +25o fiber _ Lum W&C -25o fiber _ Lum W&C
14
Figure 12. Contributions to the total irradiance (Ee) and weighted irradiance values with respect to C(λ),
melanopsin, and V(λ) (Ee,c, Ee,m and Ee,v) form a FOV for all fibers in the second lighting scenario (LumW&C).
4.3 Dynamic lighting condition
The proposed measurement method and instrument were tested for its performance in a dynamic lighting condition, by placing the MuS in test room 2, see Figure 13. The MuS was located in the middle of the daylight opening on the right side with an unobstructed view of the sky. By doing so, three of the fibers were facing a nature view. The view of the 0° fiber contained mainly vegetation, while the sky was the main scenery for the +25° fiber. The +50° fiber partially faced the sky and the ceiling. The -25° fiber faced the windowsill and the wall below the daylight opening. The measured practical FOV of every fiber and the approximated viewing area are also shown in Figure 13.
Figure 13. Test set-up in test room 2 with daylight openings on the West orientation (left) and the measured practical FOV of every fiber and the approximated viewing area (right).
Figure 14 shows an example of the relative contributions to the total spectral irradiance measured simultaneously in four directions on a day (December 2nd, 2016) with an overcast sky condition at three
times: 9:00, 12:30, and 15:00 local time in Eindhoven. The relative contribution of each fiber varied depending on the time of the day and the outside view.
0,0E+00 2,5E-02 5,0E-02 7,5E-02
Ee Ee,c Ee,m Ee,v
C o n tr ib u ti o n s to th e to ta l i rr ad ia n ce (W /m 2/n m) Post-processed values +50° fiber +25° fiber 0° fiber -25° fiber
15
Figure 14. Relative spectral irradiance contributions from the FOV of all fibers measured simultaneously on December 2nd ,2016 (overcast sky) at 9:00, 12:30, and 15:00 hour’s Eindhoven local time (from top to bottom).
The relative spectral distribution of the +50o and +25° fibers show the characteristic spectrum of daylight,
as they both colelcted visible radiation from the sky. The maxima in the spectral distribution of these two fibers compared to the 0o and -25o fiber is considerably higher. The +50o and +25° fibers colelcted direct
visible radiation from the sky whereas the -25o fiber collected indirect radiation from the internal
reflections. The maxima in the spectral distribution of the 0o fiber is shifted towards the longer wavelength
range because of the landscape influence.
0,0 0,5 1,0 350 400 450 500 550 600 650 700 750 800 R el ativ e c o n tr ib u ti o n to th e to ta l sp ect ral i rr ad ian ce ( W /m 2/n m) λ (nm)
Multidirectional spectral multieasurement on December 2nd, 2016 with overcast sky condition at 9:00
+25° fiber -25° fiber +50° fiber 0° fiber 0,0 0,5 1,0 350 400 450 500 550 600 650 700 750 800 R el ativ e c o n tr ib u ti o n to th e to ta l sp ect ral i rr ad ian ce ( W /m 2/n m) λ (nm)
Multidirectional spectral measurement on December 2nd, 2016 with overcast sky condition at 12:30
+25° fiber -25° fiber +50° fiber 0° fiber 0,0 0,5 1,0 350 400 450 500 550 600 650 700 750 800 R el ativ e c o n tr ib u ti o n to th e to ta l sp ect ral i rr ad ian ce ( W /m 2/n m) λ (nm)
Multidirectional spectral measurement on December 2nd, 2016 with overcast sky condition at 15:00
+25° fiber -25° fiber +50° fiber 0° fiber
16
Figure 15 shows the relative contributions from every fiber to the total irradiance at three hours (9:00, 12:30, and 15:00) on a day with overcast sky (December 2nd, 2016). Regardless of the time, the highest
contributions to irradiance belong to the +25o and fibers with +25o fiber being superior. The -25o and 0o
fibers, however, have considerably lower relative contributions to the total irradiance. The +50o fiber has
its highest relative contribution to irradiance at 12:30, due to the sun position in the sky. The relative contribution of the +25o fiber is highest in the afternoon due to the sun position in the sky and the West
orientation of the daylight openings.
Figure 15. Relative irradiance contributions from every fiber, on December 2nd, 2016 (overcast sky) at 9:00, 12:30,
and 15:00 hour’s Eindhoven local time.
Figure 16 shows an example for the relative spectral irradiance contributions from the FOV of all fibers measured simultaneously on a day (December 3rd, 2016) with a clear sky condition for the same hours
(9:00, 12:30, and 15:00 local time). The highest relative contribution to the spectral irradiance, on a day with a clear sky, belongs to the +25o fiber throughout the day.
In general, the differences between the relative spectral distribution of the +25o and +50o fibers at 12:30 is
higher on the day with clear sky compared to the day with overcast sky. The relative spectral distribution of the 0o fiber is influenced by the landscape and the relative spectral irradiance contribution is higher on
the day with clear sky condition compared to the overcast sky day. At 15:00, the contribution of longer wavelengths in the relative spectral distribution of the -25o, 0o, and +50o fibers is noticeable. This can be
due to the sunset time on December 3rd ,which was around 16:30 local time in Eindhoven.
0,00 0,50 1,00 09:00 12:30 15:00 R el ativ e c o n tr ib u ti o n to th e to ta l irra d ia n ce (W /m 2) time (hour) -25° fiber 0° fiber +25° fiber +50° fiber
17
Figure 16. Relative spectral irradiance contributions from the FOV of all fibers, measured simultaneously on December 3rd, 2016 (clear sky) at 9:00, 12:30, and 15:00 hour’s Eindhoven local time (from top to bottom).
Figure 17 shows the relative contribution of every fiber at three hours (9:00, 12:30, and 15:00) on a day with clear sky (December 3rd, 2016). Similar to the day with overcast sky, the highest contribution to
irradiance belongs to the +25o fiber. The time of the highest contribution of this fiber, however, shifted
from the 15:00 during overcast sky day to 9:00 and 12:30 during the clear sky day. The lowest irradiance contribution belongs to the -25o fiber except at 15:00 when the 0o fiber has the lowest contribution.
0,0 0,5 1,0 350 400 450 500 550 600 650 700 750 800 R el ativ e c o n tr ib u ti o n to th e to ta l sp ect ral i rr ad ian ce ( W /m 2/n m) λ (nm)
Multidirectional spectral measurements on December 3rd, 2016 with clear sky condition at 9:00
25 degree -25° fiber +50° fiber 0° fiber 0,0 0,5 1,0 350 400 450 500 550 600 650 700 750 800 R el ativ e c o n tr ib u ti o n to th e to ta l sp ect ral i rr ad ian ce ( W /m 2/n m) λ (nm)
Multidirectional spectral measurements on December 3rd, 2016 with clear sky condition at 12:30
+25° fiber -25° fiber +50° fiber 0° fiber 0,0 0,5 1,0 350 400 450 500 550 600 650 700 750 800 R el ativ e c o n tr ib u ti o n to th e to ta l sp ect ral i rr ad ian ce ( W /m 2/n m) λ (nm)
Multidirectional spectral measurements on December 3rd, 2016 with clear sky condition at 15:00
+25° fiber -25° fiber +50° fiber 0° fiber
18
Figure 17. Relative irradiance contributions from every fiber to the total irradiance, on December 3rd, 2016 (clear
sky) at 9:00, 12:30, and 15:00 hour’s Eindhoven local time.
At 15:00 the -25o fiber shows notably higher contribution to the irradiance on 3rd of December compared
to that of the 2nd December. This can be due to the reflections on the windowsill that is within the FOV of
the -25o fiber. The sky condition has positively influenced the contribution of the 0o fiber throughout the
day during the clear sky day compared to the overcast day. This is not the case for the +50o as its
contribution decreases on the clear sky day compared to that of the overcast sky day.
For all collected data, contributions to the irradiance, as well as the weighted irradiance values with respect to C(λ) (Ee,c), melanopsin (Ee,m), and V(λ) (Ee,v), were calculated. Figure 18 shows the post-processed data
for all fibers at 12:30 on a clear sky day. In general, the contributions to the irradiance and weighted irradiance values are significantly higher for the +25° fiber compared to that of other fibers. The Ee,c and
the Ee,m values are 42% and 35% higher than the Ee,v value for the +25o fiber as this fiber collected most of
its contribution to the irradiance from the sky.
Figure 18. Contributions to the irradiance (Ee )and weighted irradiance values with respect to C(λ), melanopsin,
and V(λ) (Ee,c, Ee,m and Ee,v) from the FOV of all fibers on December 3rd , 2016 (clear sky) at 12:30.
The 0° fiber, however, collected its contribution to the irradiance mostly reflected from the vegetation in front of the window. As a result, the Ee,v value is 20% and 15% higher for this fiber compared to the Ee,c
0,00 0,50 1,00 09:00 12:30 15:00 R el ativ e c o n tr ib u ti o n to th e to ta l irra d ia n ce (W /m 2) Time (hour) -25° fiber 0° fiber +25° fiber +50° fiber 0,0E+00 1,0E+01 2,0E+01 3,0E+01
Ee Ee,c Ee,m Ee,v
C o n tr ib u ti o n s to ir ra d ia n ce ( W /m 2) Post-processed values +25° fiber 0° fiber -25° fiber +50° fiber
19
and Ee,m values respectively. The irradiance and weighted irradiance contributions are the lowest for the
-25° fiber as it faced mainly the wall below the daylight opening. Although the Ee,c and theEe,m contributions
from the +50° fiber are higher (79% and 61%) compared to that of the 0° fiber, the Ee,v contributions from
these two fibers with 5% difference is comparable.
Figure 19 shows the contributions to the irradiance (Ee) from the FOV of all fibers during office hours
(9:00 to17:00) on a clear sky day (December 3rd, 2016). The +25o fiber has the highest contribution to the
irradiance. The lowest contribution to the Ee belongs to the -25o fiber except for two hours (14:00 and
15:00) during which the contributions by this fiber exceeds that of the 0o fiber. This is due to the sun
position in the sky and the internal reflections during those two hours. During the morning, the irradiance contributions from the 0o and the +50o fibers are very similar. These readings drifted apart in the afternoon
when the contribution from the +50o fiber is up to 82% higher compared to that of the 0o fiber.
Figure 19. Contributions to irradiance (Ee) from the FOV of all fibers during office hours on December 3rd , 2016
(clear sky).
The influence of light spectrum and directionality on NIF impact during office hours using the contributions of every fiber to the weighted irradiance with respect to C(λ) (Ee,c) as an indicator is shown
in Figure 20. The contributions to the Ee,c are highest for the +25o fiber throughout the clear sky day
followed by the +50o, 0o, and -25o fibers. Comparing Figure 19 and Figure 20 shows that although in the
morning the Ee contributions from the 0o and +50o fibers are similar, the Ee,c contributions from these fibers
are different with the +50o fiber being superior (up to 2 times higher).
0,E+00 1,E+01 2,E+01 4,E+01 08:00 09:00 10:00 11:00 12:00 13:00 14:00 15:00 16:00 17:00 18:00 C o n tr ib u ti o n s to ir ra d ia n ce ( W /m 2) Office hours +50° fiber +25° fiber 0° fiber -25° fiber
20
Figure 20. Contributions to weighted irradiance with respect to C(λ)(Ee,c) From the FOV of all fibers during office
hours on December 3rd , 2016 (clear sky).
5
Discussion
The abovementioned results show the contributions to the irradiance and weighted irradiances from the FOV of all fibers in different directions. The MuS results can be used for evaluating what a human eye fixed in one position and orientation would receive. However, we are aware that in practice the human gaze is not fixed. Nevertheless, each fiber on the MuS represented a retinal area/visual field. From the data collected by each fiber, one can get an estimation on how much radiation might fall into different areas of the retina when different lighting scenarios (static and dynamic) are implemented. Knowing how much light falls into different retinal areas is important when the NIF light effects are concerned because these areas are known to respond differently.
When the MuS is in the vertical position, the -25° fiber represent the superior retina while the +25° and +50 fibers represent the interior and extended interior retina respectively. In the experiment with daylight as the primary light source, the inferior retina received the highest radiation throughout the day with maxima at wavelengths between 400 and 500 nm that may positively influence the magnitude of NIF effects. The superior retina, on the contrary, received the lowest radiation, mostly from internal reflections. The spectral characteristics of the radiation received by the superior retina are typically representative of the objects outside the window or inside the room, with less pronounced maxima at the shorter wavelengths. In such a setup, they possibly have less impact on the NIF effects.
A continuous multidirectional spectral measurement shows that the magnitude and the spectral characteristics of radiation received by the superior and inferior retina throughout the day depend on the weather condition and the outside view. The post-processed data from pilot daylight measurement showed that the contributions to the irradiance and the weighted irradiances received by the inferior retina compared to the superior retina were up to 26 times higher. Therefore, in this setup they may have the higher impact on the NIF effects.
0,E+00 5,E+00 1,E+01 2,E+01 08:00 09:00 10:00 11:00 12:00 13:00 14:00 15:00 16:00 17:00 18:00 C o n tr ib u ti o n s to w ig h te d ir ra d ia n ce w ith r es p ec t to C (λ ) (W /m 2) Office hours +50° fiber +25° fiber 0° fiber -25° fiber
21
6
Conclusions and recommendations
The proposed measurement method and instrument enables a better understanding of NIF characteristics of illumination in indoor spaces by taking into account light directionality, spectrum, and relevant radiometric quantity. The MuS is capable of performing spectral measurements in four directions in seconds rather than couple of minutes if only one spectrometer was used for sequential measurements. In doing so, it is possible to study the spectral and directional characteristics of fast changing daylight. Results from pilot daylight measurements showed, that the MuS is a fast and reliable to perform spectral measurements for different directions for indoor daylight measurements under overcast and clear sky conditions. The adjustments of the integration time were done accordingly. Moreover, the practical FOV of the fibers is small enough to exclude overlap of the fields of view, and to show the influence and thus the importance of simultaneous multidirectional spectral measurements. The MuS can be used for long-term lab or field measurements to align NIF effects with measured spectral data from different directions.
7
Acknowledgement
This research was performed within the framework of a strategic joint research program between TU/e and Royal Philips N.V. within the Intelligent Lighting Institute. We thank our colleagues J. Diepens and H. Smulders from the Building Physics and Services laboratory of the TU/e Department of the Built Environment for their great help in the laboratory and in developing the data acquisition software.
References
[1] J.A. Veitch, G. van den Beld, G. Brainard, and G.E. Roberts, Ocular lighting effects on human physiology and behavior (2009) CIE Technical Report ISBN 9783901906763
[2] D.M. Berson, F. a Dunn, M. Takao, Phototransduction by retinal ganglion cells that set the circadian clock., Science. 295 (2002) 1070–1073.
[3] S. Hattar, H.W. Liao, M. Takao, D.M. Berson, K.W. Yau, Melanopsin-containing retinal ganglion cells: architecture, projections, and intrinsic photosensitivity., Science. 295 (2002) 1065–70. [4] D.M. Berson, Strange vision: Ganglion cells as circadian photoreceptors, Trends Neurosci. 26
(2003) 314–320.
[5] P.R. Boyce, Human Factprs in Lighting, Third edition, CRC Press, 2014.
[6] P. Khademagha, M.B.C. Aries, A.L.P. Rosemann, E.J. van Loenen, Implementing non-image-forming effects of light in the built environment: A review on what we need, Build. Environ. 108 (2016) 263–272. doi:10.1016/j.buildenv.2016.08.035.
22
[7] R.J. Lucas, S.N. Peirson, D.M. Berson, T.M. Brown, H.M. Cooper, C.A. Czeisler, M.G. Figueiro, P.D. Gamlin, S.W. Lockley, J.B. O’Hagan, L.L.A. Price, I. Provencio, D.J. Skene, G.C. Brainard, Measuring and using light in the melanopsin age, Trends Neurosci. 37 (2014) 1–9.
[8] J.A. Veitch, Principles of healthy lighting: highlights of IE TC6-11’s forthcoming report, final report, in: 5th EPRI Light. Res. Off. Symp. "Light Hum. Heal., 2002: p. 9.
[9] P. Blattner, Relating Photochemical and Photobiological Quantities to Photometric Quantities, CIE Technical Note 002:2014 (2014).
[10] D. Gall, V. Lapuente, Aspects involving illumination in the selection of an effective lamp spectrum, in: Licht 7-8, 2002: pp. 860–871.
[11] P. Khademagha, J.F.L. Diepens, M.B.C. Aries, A.L.P. Rosemann, E.J. van Loenen, Effect of different design parameters on the visual and non-visual assessment criteria in office spaces, in: Proc. Int. Conf. CISBAT 2015 “Future Build. Dist. – Sustain. from Nano to Urban Scale, Lausanne, Switzerland, 2015: pp. 363–368. doi:10.5075/epfl-cisbat2015-363-368.
[12] M.L. Ámundadóttirm, S.W. Lockley, M. Andersen, Unified framework to evaluate non-visual spectral effectiveness of light for human health, Light. Res. Technol. 0 (2016) 1–24.
doi:10.1177/1477153516655844.
[13] M. Andersen, S.J. Gochenour, S.W. Lockley, Modelling “non-visual” effects of daylighting in a residential environment, Build. Environ. 70 (2013) 138–149.
[14] J. Mardaljevic, M. Andersen, N. Roy, J. Christoffersen, A framework for predicting the non-visual effects of daylight - Part II: The simulation model, Light. Res. Technol. 46 (2013) 388– 406.
[15] M.P.J.; Aarts, J.; Van Duijnhoven, C.; Aries, A.L.P. Rosemann, Performance of personally worn dosimeters to study non- image forming effects of light: assessment methods, Build. Environ. 117 60–72 (2017). doi:10.1016/j.buildenv.2017.03.002.
[16] G. Glickman, J.P. Hanifin, M.D. Rollag, J. Wang, H. Cooper, G.C. Brainard, Inferior retinal light exposure is more effective than superior retinal exposure in suppressing melatonin in humans., 2003.
[17] T. a Lasko, D.F. Kripke, J. a Elliot, Melatonin suppression by illumination of upper and lower visual fields., J. Biol. Rhythms. 14 (1999) 122–5.
[18] M. Rüger, M.C.M. Gordijn, D.G.M. Beersma, B. de Vries, S. Daan, Nasal versus temporal illumination of the human retina: effects on core body temperature, melatonin, and circadian phase., J. Biol. Rhythms. 20 (2005) 60–70.
23
[19] E.K. Visser, D.G. Beersma, S. Daan, Melatonin suppression by light in humans is maximal when the nasal part of the retina is illuminated., J. Biol. Rhythms. 14 (1999) 116–21.
[20] R. Zuber, A. Stührmann, A. Gugg-Helminger, G. Seckmeyer, Technology for detecting spectral radiance by a snapshot multi-imaging spectroradiometer, Meas. Sci. Technol. 28 (2017) 125903. doi:10.1088/1361-6501/aa9409.
[21] F. Sigernes, Y. Ivanov, S. Chernouss, T. Trondsen, A. Roldugin, Y. Fedorenko, B. Kozelov, A. Kirillov, I. Kornilov, V. Safargaleev, S. Holmen, M. Dyrland, D. Lorentzen, L. Baddeley, Hyperspectral all-sky imaging of auroras, Opt. Express. 20 (2012) 27650.
doi:10.1364/OE.20.027650.
[22] N. Hagen, M.W. Kudenov, Review of snapshot spectral imaging technologies, Opt. Eng. 52 (2013) 90901. doi:10.1117/1.OE.52.9.090901.
[23] A. Wagadarikar, R. John, R. Willett, D. Brady, Single disperser design for coded aperture snapshot spectral imaging, Appl. Opt. 47 (2008) B44. doi:10.1364/AO.47.000B44.
[24] L. Gao, R.T. Kester, N. Hagen, T.S. Tkaczyk, Snapshot Image Mapping Spectrometer (IMS) with high sampling density for hyperspectral microscopy, Opt. Express. 18 (2010) 14330.
doi:10.1364/OE.18.014330.
[25] R. Román, M. Antón, A. Cazorla, A. de Miguel, F.J. Olmo, J. Bilbao, L. Alados-Arboledas, Calibration of an all-sky camera for obtaining sky radiance at three wavelengths, Atmos. Meas. Tech. 5 (2012) 2013–2024. doi:10.5194/amt-5-2013-2012.
[26] K. Tohsing, M. Schrempf, S. Riechelmann, H. Schilke, G. Seckmeyer, Measuring high-resolution sky luminance distributions with a CCD camera, Appl. Opt. 52 (2013) 1564.
doi:10.1364/AO.52.001564.
[27] S. Riechelmann, M. Schrempf, G. Seckmeyer, Simultaneous measurement of spectral sky
radiance by a non-scanning multidirectional spectroradiometer (MUDIS), Meas. Sci. Technol. 24 (2013) 125501. doi:10.1088/0957-0233/24/12/125501.
[28] J.Y. Hardeberg, F.J.M. Schmitt, H. Brettel, Multispectral color image capture using a liquid crystal tunable filter, Opt. Eng. 41 (2002) 2532. doi:10.1117/1.1503346.
[29] M. Pisani, M.E. Zucco, Compact imaging spectrometer combining Fourier transform spectroscopy with a Fabry-Perot interferometer, Opt. Express. 17 (2009) 8319. doi:10.1364/OE.17.008319.
[30] S. Nevas, J. Gröbner, L. Egli, M. Blumthaler, Stray light correction of array spectroradiometers for solar UV measurements, (2014). doi:10.1364/AO.53.004313.
24
[31] D.R. Taubert, R. Friedrich, J. Hartmann, J. Hollandt, Improved calibration of the spectral responsivity of interference filter radiometers in the visible and near infrared spectral range at PTB, Metrologia. 40 (2003) 35–38.
http://iopscience.iop.org/article/10.1088/0026-1394/40/1/309/pdf (accessed December 12, 2017).
[32] Y. Juang, Consistent spectral irradiance measurements with optical fibers (Technical tip from Ocean Optics radiometric calibration lab), n.d. https://oceanoptics.com/wp-content/uploads/App-Note-Consistent-Spectral-Irradiance-Measurements-with-Optical-Fibers.pdf (accessed November 30, 2017).