SKI Report 98:30
Failure Rates in Barsebäck-1 Reactor
Coolant Pressure Boundary Piping
An Application of a Piping Failure Database
ISSN 1104-1374 ISRN SKI-R--98/30--SE
Bengt Lydell
SKI Report 98:30
This report concerns a study which has been conducted for the Swedish Nuclear Power Inspectorate (SKI) and Barsebäck Kraft AB (BKAB). The conclusions and viewpoints presented in the report are those of the author and do not necessarily
coincide with those of the SKI or BKAB.
Bengt Lydell
RSA Technologies, 1736 Promenade Circle,
Vista, CA 92083-6172, USA
May 1999
SKI Project Number 97258
BKAB Project Number 1998-8113
Failure Rates in Barsebäck-1 Reactor
Coolant Pressure Boundary Piping
Summary
SKI Report 98:30 documents an application of a piping failure database to estimate the frequency of leak and rupture in reactor coolant pressure boundary piping. The study used Barsebäck-1 as reference plant. The study tried two different approaches to piping failure rate estimation: 1) ‘PSA-style’, simple estimation using Bayesian statistics, and 2) fitting of statistical distribution to failure data. A large, validated database on piping failures (like the ‘SKI-PIPE’ database) supports both approaches. In addition to documenting leak and rupture frequencies, the SKI report describes the use of piping failure data to estimate frequency of medium and large loss of coolant accidents (LOCAs). This application study was cosponsored by Barsebäck Kraft AB and SKI Research. Urho Pulkkinen and Kaisa Simola (Technical Research Centre of Finland; VTT Automation) performed an independent peer review of the final manuscript to this report.
Sammanfattning
[Summary in Swedish]Sedan 1994 har enheten för anläggninssäkerhet på SKI bedrivit ett FoU-projekt inom området rörtillförlitlighet. En viktig del av projektet har varit insamling och bearbetning av erfarenhetsdata från kärnkraftverk i Norden såväl som utomlands. Statistisk utvärdering av dessa data har möjliggjort bestämning av läckage- och brottfrekvenser för bl.a. böjar, svetsar och T-stycken ingående i rörsystem innan- och utanför reaktorinneslutningen. Projektet avslutades under 1998 med en tillämpningsstudie avseende prediktering av brottsfrekvenser i rör innanför inneslutningen i Barsebäck-1. Tillämpningsstudien under 1998 samfinansierades av Barsebäck Kraft AB och SKI. VTT Automation (Urho Pulkkinen och Kaisa Simola) utförde oberoende granskning av det slutgiltliga manuskriptet till SKI Rapport 98:30.
Table of Contents
1. Introduction... 1
1.1 Background... 1
1.2 Conventions & Definitions... 2
1.3 Objectives... 3
1.4 Report Organization ... 4
2. Data on Piping Failures... 6
2.1 Summary of the BWR-Specific Failure Data ... 6
2.2 Piping Failures in ABB-Atom BWR Units... 9
2.3 Data Interpretation Guidelines ... 12
2.4 Organization of the Application Study ... 16
3. Models of Piping Reliability ... 21
3.1 Basic Models & Classification of Pipe Failures... 21
3.2 Time-dependence of Crack Growth ... 25
3.3 Time-dependence of Thermal Fatigue Damage... 26
4. Brief Description of Barsebäck-1 RCPB Piping... 27
4.1 RCPB Piping Design Features ... 27
4.2 Operating Experience ... 28
4.3 RCPB Piping Design Database ... 29
5. Weld Leak & Rupture Frequency Due to IGSCC ... 32
5.1 Reviewing the Service Data ... 32
5.2 Parameter Estimation... 36
5.3 Parameter Estimation - A Different Perspective ... 39
6. Rupture Frequency Due to Thermal Fatigue ... 43
6.1 Reviewing the Service Data ... 43
6.2 Thermal Fatigue Issue Summary ... 45
6.3 Parameter Estimation... 46
7. Barsebäck-1 Piping Reliability Database ... 48
7.1 Base Values versus Adjusted Values... 48
7.2 Barsebäck-1 Piping Reliability Database ... 50
7.3 Weld ‘Location-Dependency’ - Limitations & Pitfalls ... 51
8. LOCA Frequencies in Barsebäck-1 PSA ... 52
8.1 LOCA Categories in Barsebäck-1 PSA ... 52
8.2 New LOCA Frequencies... 53
8.3 Study Insights... 54
9. Review of Technical Issues ... 56
9.1 Issues in Sensitivity & Uncertainty Analysis ... 56
9.2 Justifications for Detailed Modeling ... 57
9.3 PSA Methods & Material Sciences ... 58
9.4 Direct Estimation versus PFM ... 58
9.5 Location Dependency of Weld Failures... 59
10. Conclusions and Recommendations... 60
10.1 Conclusions ... 60
10.2 Recommendations on Future R&D Directions... 60
A. Abbreviations, Acronyms & Notation
……….…..……… 62B. Barsebäck-1 RCPB Piping Components
……….……… 65C. SKI-PIPE - The Database Content
……….……… 72D. Database Structures - PSA_VER2 & SKI-PIPE
……… 76E. Vibration-Fatigue in Small-Diameter Piping
………...………..… 79F.
Erosion-Corrosion in RCPB Piping
……….……… 80List of Tables
Table 2-1 Summary of SKI-PIPE - BWR & PWR Data ……….…… 6
Table 2-2 ABB-Atom BWR Design Generations ………..………… 8
Table 2-3 Barsebäck-1 RCPB Piping Systems ……….……….…… 16
Table 2-4 The Main Steps in Piping Reliability Data Analysis ……….…… 17
Table 5-1 Weld Failures in Medium-diameter RCS Piping ………..…..… 32
Table 5-2 Weld Failures in Medium-diameter RCS Piping (US)……..….…… 32
Table 5-3 Weld Failures in Medium-diameter SIR Piping ……….…….……..…… 32
Table 5-4 Weld Failures in Medium-diameter SIR Piping (US) ……..….…… 32
Table 5-5 Weld Failures in Large-diameter RCS Piping ………..………….. 32
Table 5-6 Weld Failures in Large-diameter RCS Piping (US) ……… 33
Table 5-7 Weld Failures in Large-diameter SIR Piping ……….……… 32
Table 5-8 Weld Failures in Large-diameter SIR Piping (US) ……… 33
Table 5-9 RCS Weld Crack & Leak Frequencies Due to IGSCC …….………. 33
Table 5-10 SIR Weld Crack & Leak Frequencies Due to IGSCC ……...… 34
Table 5-11 Baseline Rupture Frequencies Due to IGSCC in Welds ….…..… 35
Table 5-12 Example of Rupture Frequencies in Different Welds ……… 35
Table 5-13 Distribution Parameters for IGSCC-Susceptible Piping ….…..… 37
Table 5-14 Through-wall Cracks in Large-diameter RCS Piping ……… 38
Table 6-1 Summary of Thermal Fatigue Events ……….……… 41
Table 6-2 Thermal Fatigue Failures by Pipe Size ………..………42
Table 6-3 Thermal Fatigue in Nordic Plants ………..……… 42
Table 6-4 Baseline Leak and Rupture Frequencies ………..………44
Table 7-1 Barsebäck-1 Plant System Names and the System Groups ……… 45
Table 7-2 Excerpt from Barsebäck-1 Database ………..……… 48
Table 7-3 Comparison of Pipe Rupture Frequencies ………..………48
Table 8-1 Proposed LOCA Frequencies ……….……… 50
Table 8-2 Comparison of LOCA Frequencies ……….……… 51
Table B-1 Main Steam Piping System Components ……….………..………. 65
Table B-2 Main Feedwater Piping System Components ………..……... 66
Table B-3 Recirculation Piping System Components………. 66
Table B-4 Main Steam Pressure Relief Piping System Components ….………... 67
Table B-5 Residual Heat Removal Piping System Components …..…………. 68
Table B-6 Core Spray Piping System Components ………..….………. 69
Table B-7 RPV Head Cooling Piping System Components ………..……. 69
Table B-8 Auxiliary Feedwater Piping System Components ……...………. 70
Table B-9 Standby Liquid Control Piping System Components ……..………. 70
Table C-1 Database Coverage by Country ……….…………. 74
Table C-2 Summary of IGSCC Data in SKI-PIPE ……….…….75
Table D-1 PSA_VER2 - Description of Data Fields ……….……….76
Table D-2 SKI-PIPE - Description of Data Fields ……….……….77
Table E-1 Weld Counts in Small-Diameter RCPB Piping ………. 79
Table E-2 Service Data on Small-Diameter RCPB Piping ………. 79
List of Figures
Figure 2-1Failure Definitions Based on Manifestations of IGSCC ………....…… 7
Figure 2-2Piping Failures in LWRs by Year of Operation ………...….. 7
Figure 2-3Piping Failures in BWRs by Year of Operation …………..………... 8
Figure 2-4Piping Failures in ABB-Atom Plants by Year of Operations ……….... 9
Figure 2-5Piping Failures in ABB-Atom Plants by Size & Year ……….…… 10
Figure 2-6BWR Population by Years of Commercial Operations ….…….……. 11
Figure 2-7Criteria for Classifying ISI Results ………..……… 12
Figure 2-8Conditional Rupture Probability Given IGSCC ………...………..… 13
Figure 2-9Conditional Rupture Probability According to PFM ………….………… 14
Figure 2-10 The Databases of the R&D Project ……….….……… 15
Figure 2-11 Guide to SKI Report 98:30 ………..…… 18
Figure 3-1Location-Dependency of Weld Failures ………..….….. 21
Figure 3-2Location-Dependency of Weld Failure in SIS Piping ………..…...… 21
Figure 3-3Location-Dependency of Weld Failures in RHR Piping …………....… 22
Figure 3-4Location-Dependency of Weld Failures in RCS Piping …..………..… 22
Figure 3-5Hypothetical Crack Growth Histories ………..….….. 23
Figure 3-6Crack Growth in DN700 Recirculation System Piping ………..…….. 24
Figure 4-1Recirculation System Loop in ABB-Atom BWR-1, 2 & 3 ……….…25
Figure 4-2Overview of the PSA_VER2 Access Database ………..………….. 28
Figure 4-3Example of Database on Attribute Data ………..……….….. 29
Figure 5-1Weld Failures in RCS Piping ………….………..….….. 30
Figure 5-2Weld Failures in SIR Piping ……….…….……… 31
Figure 5-3Conditional Rupture Probability ………..…… 35
Figure 5-4Hazard Functions for IGSCC-Susceptible Piping ……….……… 37
Figure 5-5Hazard Plot of RCS Weld Failure Data ……….…….………38
Figure 6-1Thermal Fatigue in BWRs Worldwide ………..…....………40
Figure 6-2Hazard Functions for Piping Susceptible to Thermal Fatigue…….... 44
Figure 7-1Information on IGSCC Sensitivity of Welds ……….... 46
Figure 8-1Medium- and Large LOCA Categories ………….…...…..…….. 49
Figure 8-2Contributors to Large LOCA ……….…….... 51
Figure 8-3Contributors to Medium LOCA ………..…...……… 52
Figure 8-4Contributors to Large LOCA by Degradation Mechanism ……….... 52
Figure C-1 Overview of SKI-PIPE Database ………..…………....72
Figure C-2 Examples of Data Sources in SKI-PIPE ……….……….... 73
Figure C-3 The Coverage of SKI-PIPE - Operating BWR Units ……… 73
Figure G-1 Hazard Plot of RCS Piping Failure Data ………..……..…… 82
Figure G-2 Hazard Plot of Thermal Fatigue Data ……….…… 82
Figure G-3 Hazard Plot of CRD Piping Failure Data ………..…..….…… 83
Acknowledgments
The author provides special thanks to Ralph Nyman (SKI project manager) for his strong commitment to bring the 4-year program to successful completion. Special thanks are also extended to Ingemar Ingemarson (BKAB) for his foresight to commission the application study. The excellent work by Lennart Åström1 (BKAB) in developing PSA_VER1 was key to performing the application study with Barsebäck-1 as reference plant. Mr. Harald Gmeiner (Enconet Consulting Ges.m.b.H.) assisted with the review and enhancement of PSA_VER1.
The author would like to acknowledge the invaluable contributions to the piping failure database by Walter Burchardt (Energie-Versorgung Schwaben AG), Tinko Gantchev (Bulgarian Nuclear Safety Authority), Rudolf Häussermann (Kernkraftwerk Leibstadt AG), Kalle Jänkälä (IVO International, Ltd.), Bernd Schubert (Hamburgische Electricitäts-Werke AG), Ralph-Michael Zander and Adelbert Gessler (Kernkraftwerke Gundremmingen Betriebsgesellschaft mbH), Caroline Lauron and Louise Lund (U.S. Nuclear Regulatory Commission).
Finally, the author provides special thanks to Karl Fleming (ERIN Engineering and Research, Inc.) who graciously shared insights and results from his work on piping reliability with applications to risk-informed in-service inspection.
The final version of SKI Report 98:30 was peer reviewed by Urho Pulkkinen and Kajsa Simola (VTT Automation). The work to finalize the study documentation benefited greatly from their review comments.
1
1. Introduction
This summary report presents an application of a database on piping failures to estimate frequencies of leaks and ruptures in medium- and large diameter reactor coolant pressure boundary (RCPB) piping. Together with a description of the technical approach, the report includes an overview of results and insights of a plant-specific analysis of piping reliability with Barsebäck-1 as reference plant.
1.
1
Background
Of limited or unproved usefulness, several databases on piping failures exist. Factors such as accessibility (e.g., proprietary data), incompleteness or lack of validation significantly impacts their usefulness. Initiated in mid-1994, the R&D leading to the application study included the development of a validated, comprehensive database on piping failures in commercial nuclear power plants worldwide. Consistent with the data collection standard ISO 14 224 “Collection of Reliability and Maintenance Data for Equipment,” the database development program specified the following characteristics:
• Verification of the completeness of data sources through reviews of full-text
event reports and in-service inspection (ISI) reports.
• Verification that data sources have the proper information and that basic
information (population, material composition, diameter, wall thickness, installation data, operating period) on the piping is available.
• Well documented set of failure definitions against which the service data are
collected.
• Accurate input of service data, and handling of the data using quality principles (e.g., document control).
A framework for interpreting and analyzing service data on piping evolved with the database development effort. According to that framework, the statistical parameter estimation should be performed on the basis of carefully defined piping reliability attributes and reliability influence factors. Interim results of the R&D were published as SKI Reports 95:58 (SKI, 1995a), 95:61 (SKI, 1995b) and 97:26 (SKI, 1997) and conference papers (e.g., Lydell and Nyman, 1996, 1998). Limited to ASME Class 1, 2 and 3 piping systems, the database currently (end of December, 1998) includes well over 3,000 event reports addressing significant degradations (cracks in the through-wall direction) and failures (small to major leaks and ruptures). The database also includes an additional 400 event reports addressing water hammer events leading to piping system damage (e.g., failure of hangers or supports), leaks or ruptures.
Historically, different technical approaches have been applied to estimate the frequency of pipe leaks and ruptures. These approaches have ranged from direct statistical estimation using the available service data to application of probabilistic fracture mechanics models. In the subject application, statistical estimates of leaks and ruptures were obtained through consideration of trends in event frequencies correlated to the length of service time. The statistical estimation process was intimately coupled to a framework for interpreting and analyzing service data on occurred flaws (e.g., cracks) and leaks. The reader is referred to SKI Report 97:26 for additional background information.
1.
2 Conventions & Definitions
Piping failures occur because of degradation and failure mechanisms not accounted for in the original piping system design, fabrication and installation. Collecting quality data on degradations and failures enable direct statistical estimation of pipe leak and rupture frequency. Requirements for reliability data analysis differ significantly between active components and passive components, however.
Since no major RCPB piping failures in BWRs have occurred, piping reliability analysis builds on interpretations of data on incipient and degraded failures. The completeness of databases on piping failures is particularly important when estimating reliability parameters for rare events such as large leaks or ruptures. The SKI-PIPE database2 contains detailed data on degradation and failure mechanisms, root cause evaluations and operating conditions for piping failure events during 1970-1998. It is a periodically updated database on failures in carbon steel and stainless steel piping in commercial nuclear reactors worldwide. This study only considered service data relevant to boiling water reactors (BWRs). It used an archived version of the database (SKI-PIPE, Revision 98:4).
All failure event records in the database are mutually exclusive events. While a single weld could contain multiple cracks, even multiple pinholes, for each such instance the database only records one weld failure representative of the most significant crack. The term ‘weld’ encompasses the weld metal and the weld heat-affected zone (HAZ).
Degradation mechanisms addressed by the application study included forms of degradation mechanisms specific to BWR operating environments. Examples of such mechanisms are intergranular stress corrosion cracking (IGSCC) in weld heat affected zones (HAZ), transgranular stress corrosion cracking (TGSCC) in cold worked pipe bends, and thermal fatigue in piping system branch points.
2
Several recent industry reports on piping reliability, including NUREG-1661 (U.S. NRC, 1999) and EPRI TR-112657 (Dimitrijevic et al, 1999), refers to a database developed for SKI in 1995 (SKI Report 96:20; Bush et al, 1996). It should be recognized that the SKI-PIPE database is independent of the database documented in SKI Report 96:20.
As recorded in SKI-PIPE, the failures are classified as either ‘crack’, ‘pinhole leak’, ‘leak’ or ‘rupture’. An event classified as ‘crack’ implies that the crack tip did not penetrate the pipe wall. By contrast, welds containing pipe wall penetrating cracks of limited with and length but with visible water seepage or drop leakage are classified as pinhole leaks. Events involving at-power leaks discovered through normal global or visual leak detection systems are classified simply as ‘leaks’. Finally, the term ‘rupture’ implies a sudden, major piping failure having a significant effect on plant operations. The consequence could be a large release of process medium (say, 50 kg/s, depending on size and location), or complete separation of pipe-ends (e.g., double-ended guillotine break).
The term ‘failure’ implies that a corrective action was taken to refurbish a piping system. Examples of corrective actions include repair by using the weld overlay repair technique, replacement using piping component of same type and material composition as the original design, replacement using piping component of same size and schedule but of different layout or material composition, and replacement of an entire piping system using a material composition different from the original design. The term ‘failure’ also has a risk connotation. Depending on risk significance, failures are classified as incipient, degraded or complete failures.
Derived weld leak and rupture frequencies build on data interpretations and not on application of physical models of failure. The data interpretations assume weld crack
initiation to be a function of the quality of piping fabrication and installation. Crack propagation is assumed to be a function of plant thermal transient history and operating
conditions. Hence, the occurred weld cracks as recorded in the database represent manifestations of quality deficiencies during plant construction, and of plant thermal transient histories. Throughout the report, all pipe diameters are quoted as nominal diameters (DN) in millimeters. Also, the report uses the terms ‘small-’, ‘medium-’ and ‘large-diameter’ piping to mean piping of diameter < DN100, 100 ≤ DN ≤ 250, and > DN250, respectively.
1.
3 Objectives
The application study was concerned with the estimation of RCPB piping leak and rupture frequencies in Barsebäck-1, a third design generation ABB-Atom BWR unit. These leak and rupture frequencies were input to a component-by-component model of the RCPB piping representing loss of coolant accident (LOCA) initiating events. In Barsebäck-1, the RCPB consists of the following ten piping systems; the plant-specific system IDs are given in parentheses:
1. Main steam system (System 311) up to the outside containment isolation valves. 2. Main feedwater system (System 312) from the outside containment isolation valves
to the reactor pressure vessel (RPV).
4. Nuclear steam pressure relief system (System 314).
5. Residual heat removal system (System 321) from the recirculation system and to the outside containment isolation valves, and from the outside containment isolation valves to the System 312 branch connections.
6. Emergency core cooling system (System 323) from the outside containment isolation valves to the RPV.
7. RPV head cooling system (System 326) in its entirety. This system connects to the recirculation pump discharge side of the main recirculation loops.
8. Auxiliary feedwater system (System 327) from the outside containment isolation valves to the System 312 branch connections.
9. Standby liquid control system (System 351) from the outside containment isolation valves to the RPV.
10. Hydraulic control rod insertion system (System 354) from the outside containment isolation valves to the respective control rod group.
The evaluation was limited to typical piping components (bends/elbows, nozzles, pipes, tees and welds). Failures of other types of passive components (e.g., pump casings, rupture discs, valve bodies) were not addressed by the study. In Barsebäck-1, the RCPB piping nominal diameter ranges from DN650 (recirculation system; System 313) to DN25 (hydraulic scram system; System 354). The impact of breaks in instrument sensing lines (DN8-DN10), sample lines and vent lines (DN20) was also accounted for.
Consideration of statistical uncertainty is an integral part of risk and reliability analysis. It is recognized that uncertainty analysis is particularly important when modeling rare events such as medium- and large-diameter pipe ruptures. The work scope did not include a comprehensive uncertainty analysis, however. Instead, the study included a qualitative evaluation of the impact by model and data uncertainties on the overall insights and results. Also, uncertainty propagation was selectively performed to illustrate the confidence intervals of derived leak and rupture frequencies.
1.
4 Report Organization
This report documents the data analysis methodology together with results and insights of a plant-specific application of derived piping component leak and rupture frequencies. It is a summary report of a data analysis effort performed over a relatively long time. The report is divided into eleven chapters and seven appendices as follows:
Chapter 1 Introduction, study conventions and objectives.
Chapter 2 Service data on piping failures, description of SKI-PIPE; time-dependent failure rates; service data specific to Barsebäck-1/2; basic data analysis considerations; technical organization of application study.
Chapter 4 Description of the Barsebäck-1 Reactor Coolant Pressure Boundary piping systems and description of the Barsebäck-1 LOCA initiating event model.
Chapter 5 Estimation of ‘baseline’ weld leak and rupture frequencies due to IGSCC. The impact of corrective actions on leak and rupture frequencies.
Chapter 6 Estimation of ‘baseline’ leak and rupture frequencies in piping susceptible to thermal fatigue.
Chapter 7 Development of a piping component reliability database for Barsebäck-1 and quantification of piping system leak and rupture frequencies.
Chapter 8 Medium and large LOCA frequencies in Barsebäck-1 PSA.
Chapter 9 Results & insights including a discussion of the sensitivity and uncertainty analysis results. Review of technical issues in piping reliability parameter estimation.
Chapter 10 Conclusions and recommendations.
Chapter 11 References.
Appendix A Abbreviations, Acronyms & Notation
Appendix B Barsebäck-1 RCPB piping component populations.
Appendix C SKI-PIPE - database content as of 12/31/98. Appendix D Database Structures - PSA_VER2 and SKI-PIPE. Appendix E Vibration-fatigue in small-diameter piping.
Appendix F Note on the potential for flow-assisted corrosion (FAC) in RCPB Piping.
Appendix G Note on the statistical analysis of censored data. Hazard plots for a
selection of piping systems.
Numerous MS-Excel spreadsheets, spreadsheet programs and MS-Access databases were developed to facilitate the plant-specific application of service data on piping failures. These spreadsheets, spreadsheet programs and databases are not included in the report. All charts and tables displaying service data were based on queries in the archived version of SKI-PIPE. The ‘model’ of the Barsebäck-1 RCPB piping (PSA_VER2) is proprietary to the plant operator, BKAB (a division of Sydkraft), and therefore not included with the report.
2. Data on Piping Failures
Section 2 presents the piping failure database with data interpretation guidelines. Approximately 50% of the failures in SKI-PIPE apply to piping in BWR units. This BWR-specific service experience includes documented evidence of about 1400 piping failures in BWR plants worldwide. The database content influenced the approach to data analysis.
2.
1 Summary of the BWR-Specific Failure Data
As documented in SKI-PIPE, the overall service experience with piping systems in light water reactors is summarized in Table 2-1. The data are organized according to types of degradation and failure mechanisms and pipe size. Next, Figures 2-2 and 2-3 show the BWR-specific database content.
Table 2-1: Summary of SKI-PIPE (Version 98:4) - BWR & PWR Data.
Failure Mechanism ≤≤ DN50 > DN50
I.D. Description Type of Failure Type of Failure All Crack Leak Rupture All Crack Leak Rupture
SC Stress Corrosion Cracking 152 20 132 0 794 587 207 0
TF Thermal Fatigue 36 7 27 2 63 31 32 0
E-C Erosion-Cavitation 3 0 3 0 7 0 7 0
CF Corrosion-Fatigue 9 0 9 0 11 4 7 0
E/C Erosion / Flow Accelerated Corrosion
208 2 193 13 236 11 180 45
COR Corrosion Attack / MIC 84 1 80 3 80 3 74 3
VF Vibration Fatigue 670 14 592 65 96 6 85 5
D&C Design & Construction Defects
148 2 140 6 68 5 61 2
WH Water Hammer 71 7 47 17 89 14 31 44
HEc Human Error 45 0 44 1 16 0 15 1
UNR Unreported Cause 103 0 102 1 86 0 83 3
All Mechanisms 1530 53 1369 108 1546 661 782 103
All failure data in Table 2-1 are for piping components external to the reactor pressure vessel (RPV). Also, the database is limited to events involving damage to piping components in the through-wall direction of base or weld metal. For welds the database is limited to failures of ‘Type 1’ per Figure 2-1.
Crack
- UT indication confirmed by destructive testing or second party NDE - Repair by weld overlay or replacement
Leak
- Detection during routine power operation (e.g., via TV camera in drywell or leak detection system)
- Replacement of failed weld component Pinhole (P/H) leak
- Detected during ISI (e.g., upon completion of IHSI) as water seepage - Replacement of failed weld component
Type 1a Type 2
Type 1.b Type 1c
IGSCC / TGSCC Crack indication
- No independent verification of presence of IGSCC/TGSCC - No weld repair
Figure 2-1: Failure Definitions Based on Manifestations of IGSCC & TGSCC.
Specifically, the definitions in Figure 2-1 apply to welds susceptible to IGSCC in BWR operating environments. Often, weld cracks originate in the transgranular mode and propagate in the intergranular mode.
In Figure 2-2 the service data on cracks, leaks and ruptures are differentiated by plant type (BWRs and PWRs) and by year of commercial operation. The piping failures are strongly time-dependent, showing a decline after the first 10 to 15 years of operation. The population of operating PWR plants is about twice that of BWRs.
0 50 100 150 200 250 300 350 1 2 3 4 5 6 7 8 9 10 11 12 13 14 15 16 17 18 19 20 21 22 23 24 25 26 27 28 29 30 31 32 33 34
Year(s) of Commercial Operation
Number of Piping Failure Events
All BWR PWR
Figure 2-2: Piping Failures in BWR & PWR Plants by Year of Operation.
Figure 2-3 (page 8) shows service data specific to ASME Class 1, 2 and 3 piping systems in BWR plants. The data are organized in two groups: (1) Small-diameter piping failures by year of operation; and (2) Medium- to large diameter piping failures by year of operation. Again, this data summary emphasizes the strong time dependency of piping failures. For medium- to large-diameter piping, a sharp decline occurs after the 13th year of operation. Figures 2-4 through 2-6 summarize the worldwide BWR-specific
service experience with piping susceptible to flow-assisted corrosion (FAC), IGSCC and vibration-fatigue, respectively. The vibration-fatigue data almost exclusively relates to failures in small-diameter piping such as instrument lines, drain lines, sample lines and vent lines. The number of operating BWR units is not constant for each year. In Figures 2-4 through 2-6 the number of failures is scaled according to the number of operating plants for each year.
0 20 40 60 80 100 120 1 2 3 4 5 6 7 8 9 10 11 12 13 14 15 16 17 18 19 20 21 22 23 24 25 26 27 28 29 30 31 32 33 34
Year(s) of Commercial Operation
Number of Piping Failure Events
≤ ∅50 > ∅50
Figure 2-3: Piping Failures in BWR Plants by Pipe Size and Year of Operation.
0 0.05 0.1 0.15 0.2 0.25 0.3 0.35 0.4 0.45 0.5 1970 1972 1974 1976 1978 1980 1982 1984 1986 1988 1990 1992 1994 1996 1998
Number of FAC Events / BWR Unit
0 0.5 1 1.5 2 2.5 3 3.5 1970 1971 1972 1973 1974 1975 1976 1977 1978 1979 1980 1981 1982 1983 1984 1985 1986 1987 1988 1989 1990 1991 1992 1993 1994 1995 1996 1997 1998
No. IGSCC Events
Per BWR Unit
Figure 2-5: IGSCC in BWR Units Worldwide.
0 0.1 0.2 0.3 0.4 0.5 0.6 0.7 1970 1972 1974 1976 1978 1980 1982 1984 1986 1988 1990 1992 1994 1996 1998 Number of Vibration-Fatigue Events / BWR Unit
Figure 2-6: Vibration-Fatigue in BWR Units Worldwide.
An important aspect of data analysis involves grouping failure data according to reliability attributes and influence factors representative of a type of piping system for which failure parameters are to be estimated. Grouping of data could reduce the statistical significance. Therefore, the grouping should be done using sound technical justifications to ensure appropriate consideration of service.
2.
2Piping Failures in ABB-Atom BWR Units
Per Table 2-2, nine units of five design generations currently operate in Sweden. The first three generations, comprising five units, have external recirculation loops,
while the BWR-4 and 5 units have internal recirculation pumps without large-diameter piping connected to the reactor pressure vessel below top-of-active fuel (TAF).
Table 2-2: ABB-Atom BWR Design Generations. Unit
Design
Generation Main Technical Design Features
Oskarshamn-1 BWR-1 External recirculation loops. Only unit with internal feedwater riser pipes. Diversification by auxiliary condenser. Fine-motion control rods, diversified shutdown system.
Ringhals-1 BWR-2 Similar to BWR-1 but improved physical separation of the electrical systems. Diversification by steam-driven emergency core cooling and auxiliary feedwater pumps.
Barsebäck-1/2 Oskarshamn-2
BWR-3 Stronger requirements on physical separation of the safety systems. Full two-train electrical separation. Improved electrical supply reliability instead of diversification.
Forsmark-1/2 BWR-4 Full four-train electrical separation. Internal recirculation pumps; no external recirculation piping. Pipe-whip restraints. Forsmark-3
Oskarshamn-3
BWR-5 Complete physical separation of safety systems. Internal recirculation pumps. Consideration of seismic safety.
Figure 2-7 summarizes service data on piping failures in ABB-Atom units (including the two BWR-4 units in Finland; TVO-1/2). The time-dependent failure trends differ from the industry-wide data shown in Figures 2-2 and 2-3. The shape of the failure trends and its impact on parameter estimation will be addressed in more detail in Chapters 5 through 7. 0 5 10 15 20 25 30 1 2 3 4 5 6 7 8 9 10 11 12 13 14 15 16 17 18 19 20 21 22 23 24 25 26 27 28
Year(s) of Commercial Operation
Total Number of Piping
Failure Events
ABB-Atom (All Units) Barsebäck-1 / 2
Figure 2-7: Piping Failures in ABB-Atom Plants by Year of Operation.
In-service inspection (ISI) during the cold shutdown plant state is the main method of detecting failures in medium- and large-diameter Class 1 and 2 piping. In part, the time-dependent piping failures reflect inspection practices as much as the impact of corrective actions on susceptibilities to degradation and failure mechanisms. Further, as much as the patterns and trends in Figure 2-7 reflect the ABB-Atom plant-specific
piping reliability they also reflect the Nordic regulatory domains and the ISI program plans as implemented by the plant operators.
During the mid to late 1980’s, the RCPB portions of the residual heat removal systems of TVO-1 and 2 were replaced with piping of nuclear grade material. Oskarshamn-1, the oldest unit, was in an extended outage during 1993-95. The outage work included modifications to the emergency core cooling system and partial replacement of RCPB piping, welds and nozzles.
The 1997 annual refueling and maintenance outage of Ringhals-1 included the replacement of the RCPB-portion of the residual heat removal system piping. The new piping material is of low carbon content austenitic stainless steel. Also, the work included the replacement of a total of 81 nozzles belonging to the six external main recirculation loops. The 1998 annual refueling and maintenance outage of Barsebäck-2 included replacing the RCPB-portion of the residual heat removal piping with nuclear grade austenitic stainless steel. Use of pre-formed piping sections reduced the weld count.
In Figure 2-8, the service data on piping systems in ABB-Atom plants are organized in two groups: (1) Small-diameter piping failures by year of operation; and (2) Medium- to large diameter piping failures by year of operation.
0 2 4 6 8 10 12 14 16 18 20 1 2 3 4 5 6 7 8 9 10 11 12 13 14 15 16 17 18 19 20 21 22 23 24 25 26 27 28
Year(s) of Commercial Operation
Total Number of Piping
Failure Events
ABB-Atom (all) <= DN50 ABB-Atom (all) > DN50 Barsebäck-1 / 2 <= DN50 Barsebäck-1 / 2 > DN50
Figure 2-8: Piping Failures in ABB-Atom Plants by Pipe Size and Year of Operation.
For each failure record in SKI-PIPE detailed information on root causes, operating conditions, material, crack morphology, etc. is given by the sixty-one data fields in the database (Appendix D). Many of the data fields are filters for database queries performed to group the data according to reliability attributes and influence factors.
2.
3 Data Interpretation Guidelines
Failures of piping system components are location dependent. This means that cracks, leaks or ruptures occur at the weakest points in piping systems. Examples of failure locations include bends or elbows thinned to the point of rupture due to flow-assisted corrosion, and welds cracked by stress corrosion mechanisms. An essential step in data analysis involves organizing the failure data according to reliability attributes and influence factors. Justifications for prior distributions and likelihood functions rest on data interpretations that acknowledge the why-where-how of occurred failure events. Evaluations of degradation and failure mechanisms determine the piping component boundary, which in turn determine the form of the failure rate estimators. The dimension of failure frequency could be failure per weld and hour, or failure per piping section and hour. A basic expression for calculating failure frequency is:
fFAILURE = (Number of Failures) / (Time × Extension) (2.1)
where ‘Extension’ = Component boundary; e.g., number of welds as defined by a <attribute-influence> set.
In Equation (2.1), the value of the numerator is a function of the database coverage and completeness, which entails capturing all relevant failure events. Accurate event classifications and descriptions enable database queries producing accurate failure event counts. The denominator is a function of the completeness of the piping system design information. It asks for information on the component population of a specific attribute (e.g., material, diameter) known to be susceptible to an influence (e.g., IGSCC). This basic failure frequency estimator requires information on component populations and plant populations (i.e., BWR units having a system representative of a selected attribute). Figure 2-9 shows the number of BWR units covered in SKI-PIPE.
0 10 20 30 40 50 60 70 80 90 100 1 2 3 4 5 6 7 8 9 10 11 12 13 14 15 16 17 18 19 20 21 22 23 24 25 26 27 28 29
Year(s) of Commercial Operation
Number of Operating
BWR Units
BWR - All
Both the numerators and denominators used in calculating failure frequencies are attribute-sensitive parameters and therefore sources of statistical uncertainties. As indicated by Figure 2-9, not all BWR units have external (to the reactor pressure vessel) recirculation loops. Hence, the denominator should account for plants with external loops when calculating main recirculation weld failure frequencies.
Optimum utilization of a failure event database follows on having a well-defined analysis objective. The database contains no rupture events in medium- to large-diameter Class 1 and 2 BWR pipes. Consequently, the ways of interpreting and grouping incipient and degraded failure events influence the parameter estimates.
The database includes information on incipient and degraded failures; from shallow cracks to through-wall cracks (TWCs). For a TWC to become unstable and possibly rupture, at least 40% of the inside pipe circumference must be cracked (Figure 2-7) at a depth of 100% through-wall or 100% of the inside circumference at a depth of 70% through-wall. Of the data records on IGSCC-induced weld failures, 490 records (circa 65% of total data-base content) include crack sizing data (crack depth and/or crack length). Most of the events fall below, at or slightly above the ‘Repair Criteria’ limit line. A selection of actual data from SKI-PIPE are included in Figure 2-10. None of the events in the database were determined to lie above the ‘Collapse’ limit line.
0.00 0.10 0.20 0.30 0.40 0.50 0.60 0.70 0.80 0.90 1.00 0.00 0.20 0.40 0.60 0.80 1.00 l/ID Crack Length / ID a/t
Crack Depth / Wall Thickness
a/t (Actual Data) Collapse Line Repair Line
Figure 2-10: Criteria for Classifying ISI Results - Typical Interpretations.
Given the nature of the piping failure data, the statistical parameter estimation begins by defining failure mode criteria. The parameter estimation includes the following analysis steps:
2. Define the failure mode (crack, P/H-leak or leak). Depending on the intended application, it could be the combination of all modes or ‘leak’ only in the case of rupture frequency estimation supporting the modeling of LOCA events.
3. Define prior distribution (e.g., informative versus noninformative prior, or empirical Bayes). The choice of prior should reflect the piping reliability state-of-knowledge.
4. Determination of population data (i.e., total number of welds).
In this study, the approach to calculating the conditional probability of rupture given weld failure uses the Jeffrey’s noninformative prior distribution. The updating of this distribution uses the number of occurred cracks, pinhole leaks and leaks for specified sets of attributes and influence factors. Each event occurrence is assumed to be a function of the thermal transient history of respective plant. Figure 2-11 displays examples of conditional rupture probabilities for IGSCC-susceptible welds.
1.00E-03 1.00E-02 1.00E-01 ≤ ∅ 50 50 < ∅ ≤ 100 100 < ∅ ≤ 250 ∅ > 250 Nominal Diameter [mm] pR|F
Jeffrey's rule: Noniniformative; all data Jeffrey's rule: Noninformative; leaks only Beta:Informative prior; all data; mean = 0.1 Beta:Informative prior; leaks only; mean = 0.1
Beta:Informative prior; all data, mean = 2.5/DN (Beliczey, 1995)
Figure 2-11: Conditional Probability of Rupture Given Weld Failure Due to IGSCC.3
A source of uncertainty as well as debate, the definition of prior distributions affects the numerical results. A good overview of practical aspects of Bayesian statistics is found in a recent paper by Siu and Kelly (1998). As indicated in Figure 2-11, this study addressed the topic of defining an appropriate prior through a limited sensitivity analysis using two different distributions. The choice of prior distribution is less critical than the data interpretation approach, however. As shown, the conditional rupture probabilities become insensitive to pipe size when using leak data only.
In the opinion of the author of this report, the conditional rupture probability is strongly dependent on the combination of reliability attributes and influence factors. Conversely, a derived conditional rupture probability should reflect a unique
3
combination of piping diameter and material as well as unique degradation/failure mechanism. Again, this technical opinion points to the importance of having a database of sufficient depth (i.e., coverage and completeness). As an example, for IGSCC-susceptible piping very few at-power leaks exist in the database. Mostly, the P/H-leaks were induced by ISI-preparations (e.g., pipe surface preparations through grinding) or stress improvement treatment processes (e.g., induction heat stress improvement, IHSI). Unrealistically high conditional rupture probabilities would result if only the at-power leak events were to be used in the calculations. Chapter 5 includes more details on the estimation of conditional rupture probabilities.
As the database development process matures, more research should be directed to the methods and techniques for statistical analysis of piping failure data. In the absence of a scientifically developed basis for data interpretation and analysis, this application study used the Jeffrey’s noninformative prior throughout to facilitate parameter estimation. The conditional rupture probabilities as shown in Figure 2-11 built on data interpretation. By contrast, Figure 2-12 shows results from a recent fracture mechanics evaluation (Rahman et al, 1995) of recirculation system piping in a General Electric boiling water reactor.
1.00E-14 1.00E-12 1.00E-10 1.00E-08 1.00E-06 1.00E-04 1.00E-02 1.00E+00 0.001 0.01 0.1 1 10 Leak Rate [kg/s] pR|L DN250 weld in recirculation riser DN250 recirculation riser - base metal
Figure 2-12: Conditional Rupture Probability According to Fracture Mechanics.
The largest IGSCC-induced leak rate recorded in SKI-PIPE is for the U.S. plant Duane Arnold. On June 17, 19784, a containment entry was made to identify a primary system leakage which had existed for about three days. The leak rate was determined to be approximately 0.2 kg/s coming from a through-wall crack in a DN250 safe-end weld. In February 1980, the Spanish plant Santa Maria de Garona experienced a 0.05 kg/s leakage due to IGSCC damage in recirculation system piping.
4
2.
4Organization of the Application Study
The data parameter estimation needs (c.f. Equation 2.1, page 12) and data interpretation guidelines determined how the technical work was organized. First, a detailed review of isometric drawings, and fabrication and material data provided the necessary design information on the RCPB piping systems. This evaluation produced an extensive database (in MS-Access) containing reliability attribute data for each of the circa 4,000 piping components comprising the ten Barsebäck-1 RCPB piping systems. Second, reviews of the industry-wide and plant specific service data applicable to the ten systems provided the reliability influence factors used to create queries in SKI-PIPE as well as a basis for grouping of failure data. Finally, the attribute and influence data were pooled to facilitate the calculation of leak and rupture frequencies. The total work scope was accomplished in five steps as described below (and Figure 2-13).
Steps 1 & 2:
Chapter 4 + Appendices A & E
Step 3: Chapters 5 & 6
Chapters 7 & 8 Step 4:
Chapter 9 Step 5:
Barseback-1 RCPB Piping Design & Service Experience
Leak & Rupture Frequency Due to IGSCC/TGSCC & Thermal Fatigue Barseback-1 Piping System Rupture
Frequency & LOCA Frequency
Results & Insights
Figure 2-13: Guide to SKI Report 98:30.
Step 1 involved an independent review of the database on all RCPB piping system components. The PSA_VER1.mdb was originally prepared by BKAB personnel during 1997 (Åström, 1997). In its initial form, the database addressed both Units 1 and 2 at Barsebäck. At the conclusion of the pilot project a new database, specific to Unit 1 had been created, consisting of close to 4,000 data records on bends, pipe, welds and tees (Figure 2-14).
The enhanced database (PSA_VER2.mdb), includes information on weld locations, piping components (bends, elbows, pipes, tees), elevations (above and below top-of-active-fuel), ISI histories, material data, results of the degradation/failure mechanism evaluations, and leak and rupture frequencies. Described in Chapter 4, this database represents the model of the RCPB piping systems used to derive LOCA initiating event frequencies.
As formulated in a paper by Fleming and Gosselin (1997a) on piping failure, the service experience shows that piping failures result from degradation mechanisms and loading conditions not anticipated in the original piping design. Since the likelihood of a failure is strongly dependent upon presence of an active degradation mechanism, the data on the service experience support direct estimation of the probability of pipe rupture. This premise lead to the formulation of Step 2
B1 RCPB Piping Components Population Data (3991 Entries)
Service Experience With ASME Class 1/2/3 piping in NPPs Worldwide (1970-1998) SKI-PIPE.mdb (MS-Access 7.0) SKI/RA PSA_VER1.mdb (MS-Access 2.0) BKAB B1/B2 RCPB Piping Components Population Data (6004 Entries)
Review + Degradation Evaluations PSA_VER2.mdb (MS-Access 7.0) SKI Report 98:30
Figure 2-14: The Databases of the R&D Project.
In Step 2, the piping components in PSA_VER2.mdb were evaluated by comparing actual piping design (material, pipe size, component type) and operating conditions to service experience with piping of equivalent attributes. System descriptions included current information on material compositions, known degradation and failure mechanisms, and summaries of piping replacements due to occurred cracks and leaks. Extensive use was made of the information in SKI-PIPE.mdb, supplemented by recent topical reports on degradation and failure mechanisms; e.g., fatigue (Mehta and Gosselin, 1995), thermal fatigue (Su, 1990; Stevens, 1998), water hammer (Van Duyne, Yow and Sabin, 1992; Griffith, 1997). Table 2-3 summarizes main features of the ten RCPB piping systems subjected to degradation evaluation.
Table 2-3.1: Barsebäck-1 RCPB Piping Systems. System Connecting Systems Known Degradation Mechanisms Material Susceptible Component5 311 Main steam (MS) 314, 316 IGSCC/TGSCC,
corrosion, FAC, vibration-fatigue, severe overloading
Carbon steel (CS) (St 45.9/III) Bends; Welds 312 Main feedwater
321, 327 IGSCC, thermal fatigue Mainly stainless steel (SS) Pipes; Tees; Welds 313 Reactor Recirculation 211, 321, 326, 352 IGSCC, weld embrittlement SS-clad CS, venturi pipes in austenitic SS, butt rings in Inconel 182 Welds 314 MS pressure relief 311, 316 TGSCC, corrosion in lines with stagnant condensate,
weld embrittlement, vibration-fatigue
Valve impulse lines in SS, relief lines leading to the suppression pool in
galvanized CS
Bends; Pipes; Welds
Table 2-3.2: Barsebäck-1 RCPB Piping Systems.
5
Susceptibility to degradation and/or failure mechanism. Based on actual occurrences in Barsebäck-1 and generic insights from the piping failure database.
System Connecting Systems Known Degradation Mechanisms Material Susceptible Component6 321 Residual heat removal
313, 327 IGSCC, thermal fatigue Mainly SS Bends; Welds
323 ECCS
213 IGSCC, weld
embrittlement, vibration-fatigue
Austenitic SS Bends; Welds
326 RPV head spray 313 IGSCC, weld embrittlement, vibration-fatigue
Austenitic SS Bends; Welds
327 Aux. Feed
312, 321 IGSCC, vibration-fatigue of small-diameter piping
Austenitic SS Bends; Welds
351 SLCS
213, 352 IGSCC, B/A-CC,
vibration-fatigue of small-diameter piping
Austenitic SS Bends; Pipes; Welds
354 211, 221, 316 IGSCC, vibration-fatigue Austenitic SS Bends; Welds
The active degradation mechanisms result from combinations of design characteristics, environment, service conditions, and operating environments. While their presence cannot be eliminated with absolute certainty, the negative effects can be minimized through the implementation of appropriate measures. Step 2 acknowledged the following attribute and influence factors:
• Design Characteristics. Design characteristics include material composition, pipe
diameter and wall thickness, component type. The design characteristics vary between systems and can occasionally vary within a system.
• Fabrication Practices. These practices include material selection, weld filler
material, heat treatment, forming method, bending method.
• Operating Conditions. The operating conditions determine the internal and
external environments that impact material degradation. These include operating temperatures and pressures, fluid conditions (stagnant, laminar, turbulent flow), quality of process medium (primary water, raw water, dry steam, wet steam), chemical control, service environment (humidity, radiation, etc.).
• Service Experience. The operating experience with a particular piping system
provide confirmation that damage mechanisms identified for a specific location are appropriate and complete.
Step 3 consisted of organizing, evaluating and analyzing the failure data according to the attributes and influence factors as identified in Step 2. Established methods of reliability life data analysis were used; see Table 2-4. The estimation of piping reliability parameters especially considered the development of hazard functions by recognizing the partial and complete failures (i.e., the penetration of pipe wall by growth-type
6
Susceptibility to degradation and/or failure mechanism. Based on actual occurrences in Barsebäck-1 and generic insights from the piping failure database.
degradation mechanisms), renewals by repair or replacement, as well as non-failures. While some plants have experienced incipient, degraded and complete failures, many plants have operated for long periods without any failures.
Table 2-4: The Main Steps of Analyzing Service Data on Piping.
Activity Objective Comment
1 Organize the service data by attribute & influence factor(s). Ensure mutually exclusive groups of data.
SKI-PIPE includes service data on a wide range of plant designs and piping systems. The service data must be organized to reflect a specific application. 2 Define failure criterion; develop/apply
a physical model of failure (e.g., crack propagation law).
A failure criterion is necessary to ensure consisted data interpretations and data pooling strategies
3 Determine the total number of
‘failures’ for the specific combination of attribute & influence.
Unless Activity 2 & 3 are performed consistently, the parameter estimates could be overly
conservative. 4 Determine the total time in service for
component boundary of choice.
Very important, and time consuming activity. Requires detailed knowledge of piping system design.
5 Estimate the reliability parameters The quality of the estimate(s) is a function of the efforts expended on Activity 1 through 4.
Any variability in estimated leak and rupture frequencies could be related to the quality of the database development effort as well as the method of estimation. Data completeness becomes particularly important when analyzing rare event data. Once the initial hurdle of establishing a database has been overcome, the parameter estimation can be streamlined and simplified. As in all reliability data work, the analyst responsible for analyzing the service data must be intimately familiar with the nature of the degradation or failure mechanisms, failure modes, and piping designs. In part, the required level of familiarity is obtained by reviewing service data and root cause analysis reports. In part, the familiarity is obtained via degradation evaluations as in Step 2.
Step 4 consisted of quantifying piping system leak and rupture frequencies, and ultimately LOCA initiating event frequencies using the component-level frequencies in Step 3. The following LOCA initiating events were quantified:
• Medium LOCA (S1); distinction between LOCA above or below top-of-active fuel
(TAF).
• Large LOCA (A); distinction between LOCA above or below TAF.
• Medium LOCA (S1); above or below TAF and with requirement for back-flush
operations due to dynamic effects resulting in stripped pipe insulation material clogging the containment sump ECCS strainers.
• Large LOCA (A); above or below TAF and with requirement for back-flush
• Large LOCA (A); above or below TAF and with dynamic effects from severance of adjacent small- and medium-size piping due pipe whip. The potential consequences of severed small- and medium-size piping could be loss of reactor vessel level indication system, loss of containment spray function, or loss of or degraded core spray function.
In the final Step 5 the interpretation of the results included performing sensitivity and selected uncertainty analysis. Due to the nature of the failure data, reliability parameter estimation involves a series of assumptions. Each of these assumptions could have a large or small impact on results. The impact of changing the assumptions in Step 3 were addressed by re-quantifying the LOCA model. Finally, the statistical uncertainty in predicted results was qualitatively addressed by identifying the sources of data and modeling uncertainty.
3. Models of Piping Reliability
This chapter presents ‘data-influenced’ models of piping reliability that acknowledge different degradation and failure mechanisms. These models reflect the data collection process and the classification of failure events. Except implicitly, the models do not account for crack growth or other complex physical phenomena. Their application assumes access to a large body of observational data on piping failures. An analytical challenge involves the consistent interpretation of service data per the guidelines in Chapter 2.
3.
1Basic Models & Classification of Pipe Failures
A framework for analyzing service data and calculating piping leak and rupture frequencies was presented in SKI Report 97:26. According to the analysis framework, evaluations of service data should be done on the basis of reliability attributes and influence factors. Depending on specific attributes of piping (size, material, material composition, method of fabrication), a piping system could be more or less susceptible to degradation or failure mechanisms (i.e., different influences). Using service data alone for estimating leak and rupture frequencies, three simple models of piping reliability are: (1) Active Degradation Mechanism
Examples include flow accelerated corrosion (FAC), stress corrosion cracking (e.g., IGSCC, TGSCC), thermal fatigue.
Freq.{Rupture} = Freq.{Failure} x Prob.{RuptureFailure}
(2) No Active Degradation Mechanism
Mainly affecting small-diameter piping, a typical failure mechanism includes vibration-fatigue.
Freq. {Rupture} is developed directly from rupture data.
(3) Piping Which Is Susceptible to Water Hammer
Freq.{Rupture} = Freq.{Water Hammer} x Prob.{RuptureWater Hammer}
Within any given piping system, individual piping sections could be susceptible to degradation mechanisms or failure mechanisms or water hammer. The known or potential degradation or failure susceptibilities must be determined prior to organizing and interpreting a database content. Such determination requires reviewing full text event reports and root cause evaluation reports. In other words, the piping failure database must include enough information to support good data pooling strategies.
It is seldom straightforward to identify underlying causes of an event. For example, pipe ruptures due to water hammer could occur due to combinations of aggressive flow accelerated corrosion, lack of in-service inspection, poor system operating procedures and/or inadequate piping system design. Before pursuing parameter estimation, a
systematic degradation mechanism evaluation determines the types of degradation and/or failure mechanisms to consider when organizing and interpreting service data. The symbolic Equation (3.1) gives the frequency of pipe rupture for a general piping system, consisting of piping components of different size and material and susceptible to different degradation and failure mechanisms:
FR{System} = 38j(D)njPj{R*D} + 38k(R ) + 38l(WH)nlPl{R*WH} 3.1)
FR{System} = Frequency of pipe rupture;
8j(D) = Failure rate per component (e.g., weld, foot of piping, bend, tee) for all degradation mechanisms in category ‘j’;
8k(R) = Rupture rate per component for all failure mechanisms in category
‘k’ piping;
nj = Number of components in category ‘j’;
8l(WH) = Frequency of water hammer in category ‘l’ piping;
nl = Number of components in category ‘l’;
Pj{R|F} = Probability of rupture given failure of component in category ‘j’ piping;
Pl{R|WH} = Probability of rupture given water hammer in category ‘l’ piping.
D = Number of piping degradations; e.g., crack in through-wall
direction, leak or rupture;
R = Number of ruptures;
WH = Number of water hammer events.
According to Equation (3.1), determining piping system rupture frequency is reduced to estimating piping component leak and rupture frequencies from observational data. The coverage and completeness of the piping failure database and the accuracy of the degradation mechanism evaluation determine the quality of the rupture frequency estimate. Before application, some specialization of Equation (3.1) may be required.
As an example, for IGSCC-susceptible piping the likelihood of weld failure depends on the location the weld in a piping system. As derived from piping failure data, this weld location dependency is shown in Figure 3-1. For a given reliability attribute (e.g., pipe size and material), and if IGSCC is determined to be a predominant degradation mechanism, the frequency of piping system failure should be determined by the frequency of weld failure per symbolic Equation (3.2):
FD-System= f(Weldi) f(Weldj) ,.., f( Weld )
i m j n k k r = = = ∑ + ∑ + + ∑ 1 1 1 (3.2)
That is, the failure frequency is a function of the contributions from weld failures of type ‘i’, ‘j’,…. , ‘k’. Index ‘D’ in FD-System stands for degradation by IGSCC in the example. This study defines ‘weld type’ as a characteristic according to the location of a weld in piping; e.g., elbow-to-pipe weld, pipe-to-pipe weld. Figure 3-1 represents the full range of medium- and large diameter stainless steel piping systems. An intrinsic assumption behind symbolic Equation (3.2) is that there is a direct relationship between the achieved quality of welding and the location of a weld in the piping. Some locations (due to
factors such as piping geometry, accessibility) could be more amenable to adverse combinations of weld sensitization and tensile stresses.
45.8% 13.3% 7.5% 6.2% 6.2% 3.9% 2.6% 2.6% 1.6% 1.5% 1.5% 1.3% 1.3% 0.0% 5.0% 10.0% 15.0% 20.0% 25.0% 30.0% 35.0% 40.0% 45.0% 50.0% Bend/elbow-to-pipe Pipe-to-pipe Pipe-to-valve Pipe-to-safe-end Bend/elbow-to-valve Pipe-to-tee Pipe-to-pipe-cap Pipe-to-nozzle Pipe-to-pump Pipe-to-flange Safe-end-to-nozzle Reducer-to-safe-end Pipe-to-reducer
Based on sample of 308 event reports The graph shows the percentage of event reports in database containing information on
exact location of failed weld.
Figure 3-1: Location-Dependency of Weld Failure in IGSCC-Susceptible Piping.
Summarized in Figures 3-2 through 3-5 is information on the ‘location-dependency’ of weld failures in different systems. Not only do these data summaries reflect the susceptibilities of different weld locations, but also the actual counts of different welds in different systems. Additionally, these data summaries reflect the full range of plant types in the piping failure database.
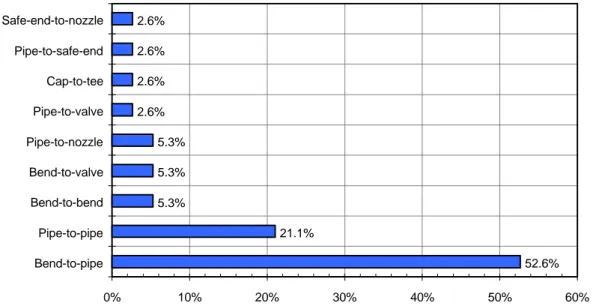
52.6% 21.1% 5.3% 5.3% 5.3% 2.6% 2.6% 2.6% 2.6% 0% 10% 20% 30% 40% 50% 60% Bend-to-pipe Pipe-to-pipe Bend-to-bend Bend-to-valve Pipe-to-nozzle Pipe-to-valve Cap-to-tee Pipe-to-safe-end Safe-end-to-nozzle
Figure 3-2. Location Dependency of Weld Failure in Medium-Diameter Safety Injection Piping.
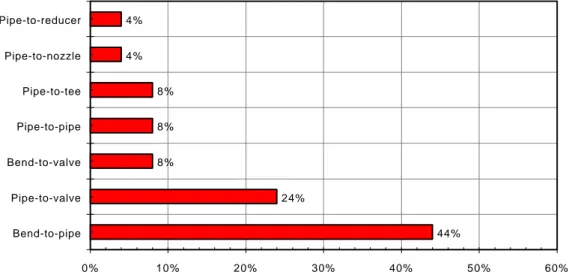
44% 24% 8 % 8 % 8 % 4 % 4 % 0 % 10% 20% 30% 40% 50% 60% Bend-to-pipe Pipe-to-valve Bend-to-valve Pipe-to-pipe Pipe-to-tee Pipe-to-nozzle Pipe-to-reducer
Figure 3-3: Location-Dependency of Weld Failure in Medium-Diameter RHR Piping.
45.4% 11.6% 7.4% 6.5% 5.1% 4.2% 3.2% 2.8% 1.9% 0% 10% 20% 30% 40% 50% 60% Bend-to-pipe Pipe-to-pipe Pipe-to-safe-end Bend-to-valve Pipe-to-valve Pipe-to-tee Pipe-to-cap Pipe-to-pump Reducer-safe-end
Figure 3-4: Location-Dependency of Weld Failure in Large-Diameter RCS Piping.
46.1% 18.0% 11.2% 5.6% 3.4% 3.4% 3.4% 2.3% 1.1% 1.1% 0% 10% 20% 30% 40% 50% 60% Bend-to-pipe Pipe-to-pipe Pipe-to-valve Bend-to-valve Bend-to-bend Pipe-to-nozzle Pipe-to-tee Pipe-to-reducer Pipe-to-flange Pipe-to-safe-end
Another important example of specialization of Equation (3.1) entails consideration of TGSCC in the base metal of bends in cold worked medium-diameter stainless steel piping. For a given reliability attribute, and if TGSCC is determined to be a predominant degradation mechanism, the frequency of piping system failure should be determined by the frequency of bend failure per symbolic Equation (3.3):
fD-System = f(Bendi) i m = ∑ 1 (3.3)
That is, the failure frequency is a function of the contributions from through-wall cracking in base metal of bends. Theoretically, failure propensity of bends in cold worked piping could be a function of bending angle; i.e., 30-degree bend versus, say, 90-degree bend. This study did not explore the piping failure database to determine such correlations, however.
3.
2Time-dependence of Crack Growth
Considering historical service data on austenitic stainless steel piping, IGSCC has been a major degradation mechanism in BWRs. Few circumferential cracks have actually penetrated the pipe wall, however. Mostly, the cracks have been shallow and attributed to improper welding procedures during initial plant construction. Even in the case of significant cracking, the margin to pipe wall penetration is substantial.
An ‘a/t-ratio’ (crack depth to wall thickness) of 60% or more implies a requirement for prompt corrective action. Current service experience indicates that below 60% crack depth, design weld overlay repairs allow continued operation indefinitely. According to an analysis by the New York Power Authority (1990), without corrective action a crack depth of 60% would be reached after approximately 30,000 hours of plant operation. For a through-wall crack to become unstable it must extend more than 40% of the pipe circumference. Figure 3-6 is an example of estimated crack growth applicable to FitzPatrick Nuclear Power Plant.
Kassir (1985) and Andresen (1998) summarize experimental and actual crack growth rates in BWR construction materials. Aaltonen, Saarinen and Simola (1993) demonstrate possible relationships between the TVO-1 transient history and crack propagation in RHR piping welds. Actual crack growth rates can be determined directly from the extensive crack morphology data in the piping failure database. To facilitate statistical parameter estimation using the hazard plotting technique (Nelson, 1972), the data in SKI-PIPE were extrapolated to estimate a fictitious time when a given crack would penetrate the pipe wall. A linear crack growth rate of 5.0E-9 cm/s was used to calculate the time of pipe wall penetration.
0 5 10 15 20 25 30 35 0 5000 10000 15000 20000 25000 30000 35000 40000
Service time [hours]
Crack depth
[mm]
DN700 Recirculation System Piping (wall thickness = 32.45 mm). Initial crack depth = 10.4 mm (32% TWC) in May 1990.
a/t = 19.5 mm (60% TWC)
Figure 3-6: Crack Growth in DN700 Reactor Recirculation System Piping.7
As an example, assume ISI detected a crack of 80% TWC (a/t = 0.8) in thick-walled, large diameter recirculation piping (35 mm wall thickness) on 1/1/90. The pipe wall penetration could occur after approximately 4.4 years given no corrective action. Conversely, an at-power leak could feasibly have occurred around mid-1994 had the ISI failed to detect this particular flaw. This simplified crack growth extrapolation was used in this study to evaluate the sensitivity of derived piping failure parameters to the completeness of the database. Appendix G includes a selection of hazard plots based on crack growth extrapolation.
3.
3Time-dependence of Thermal Fatigue Damage
In BWRs, crack growth induced by thermal fatigue could be a function of operating cycles involving the injection of hot water from the Reactor Water Cleanup System into cold main feedwater. The operating practices vary from plant-to-plant. Some plants operate with a continuous cleanup flow while others operate with intermittent flow. It is not possible to derive plant operating profiles from service data collections, however. Plant service time was selected as the basis for the parameter estimation in this project, and without adjustments for scheduled or unscheduled outages
7
James A. FitzPatrick Nuclear Power Plant, 1990. Summary of Intergranular Stress Corrosion Cracking Inspection During 1990 Refueling Outage, JPN-90-041, New York Power Authority, White Plains (NY).
4. Brief Description of Barsebäck-1 RCPB Piping
The Sydkraft Group, through its wholly-owned subsidiary Barsebäck Kraft AB (BKAB) operates the two 615 MWe units at Barsebäck. The contract for Barsebäck-1 was placed with ABB-Atom in 1969 and commercial operation began in July 1975. The two units at Barsebäck and Oskarshamn-2 are nearly identical BWR-3 units (see Table 2-2, page 8). Chapter 4 gives a brief summary of key RCPB piping design features and operating experience.
4.
1RCPB Piping Design Features
In Barsebäck-1, the major RCPB piping consists of four external recirculation loops (Figure 4-1), four main steam lines and two main feedwater lines (System 312). Inside the containment, each of the two incoming feedwater lines split into two risers that connect to the RPV. Except for the recirculation loops and main steam lines, the piping systems are made of austenitic stainless steel material (average carbon content of about 0.04%, or slightly above). The main recirculation loops are made of duplex material (carbon steel with a stainless steel coating). The venturi sections of the recirculation loops consists of austenitic stainless steel piping; vertical pipe sections with nozzles for venturis. Butt-welding rings are Inconel 182 fittings. Welding material between main loops and venturi pipes is Inconel 182. Pump casings and valves in the recirculation loops are cast austenitic stainless steel units. The medium- and large-diameter sections of the main steam lines are made of carbon steel, while the small-diameter sections are made of austenitic stainless steel.
Figure 4-1: Recirculation Loop in ABB-Atom BWR-1, 2 & 3.