Research
Uranium Aerosol Characteristics
at a Nuclear Fuel Manufacturing
2015:18
Author: Edvin Hansson Håkan Pettersson Mats Eriksson
SSM perspective
BackgroundAll nuclear facilities require that working areas are controlled and
meas-ured regarding external radiation and surface- and air contamination.
The diff erent methods used to calculate the committed eff ective dose
caused by continuous intake via inhalation are associated with large
uncertainties. Material characteristics determine how the airborne
radi-oactivity (in case of this project; uranium aerosols) are trapped in the
nose, trachea and lungs and then dissolve in body fl uids, such as lung
fl uid. A certain part of the aerosols ends up in the nasal mucus and
fol-lows the intake path through the digestive tract and out into the blood.
Small particles behave diff erently than large particles when inhaled.
Small particles (< 2 micron AMAD, Activity Median Aerodynamic
Diame-ter) have a stronger tendency to reach deep into the lungs (alveoli) than
large particles. The respiratory system can easier get rid of larger
parti-cles. However, it is not only the particle size distribution that is
impor-tant but also how the activity is distributed between these particle sizes.
There is a need for better knowledge of material- and aerosol
character-istics of airborne radioactivity present in the work environment in the
operation of nuclear facilities.
Objective
The project will perform a pre-study about how the uranium aerosols
can be characterized in the aspect of size, appearance, and in formations
with other particles. At the nuclear fuel factory in Västerås operational
situations occur resulting in production of airborne uranium particles
(uranium aerosols) that the project will use in the research study by
collecting these aerosols with various type of fi lters. Linköping
Univer-sity will be the project manager of the research project. This research
is expected to describe the characteristics in terms of size and activity
distribution and internal structure of the uranium aerosols from the
dif-ferent process steps in a nuclear fuel factory.
The study will provide more knowledge of the importance of monitoring
air and surface contamination. Since the calculations of the committed
eff ective dose caused by continuous intake via inhalation are
associ-ated with large uncertainties the authority initiassoci-ated this pre-study to be
performed.
Summary by the authors
The main conclusions of this project pre-study are:
• Uranium aerosols vary signifi cantly with respect to size and shape.
There are indications of diff erent ‘families’ of particles with respect
to size distribution.
SSM 2015:18
• Uranium aerosols can consist of mixtures of uranium oxides, fl uo-
rides, nitrites and gadolinium. The aerosols are frequently attached
to other elements such as aluminum and silicon in the shape of
either discrete particles or other materials.
Need for further research
Being a pre-study, one aim of the present work was to identify prioritized
future studies, including:
• Estimating particle volumes, activities and correlation to the aero
dynamic diameter in order to estimate the infl uence on AMAD
calculations,
• Carrying out complete sampling using 8-stage impactors,
• Carrying out radiometric analysis of all impactor stages,
• Additional chemical form analysis, e.g. AUC quantifi cation, UO
2/
U
3O
8ratios, U-F chemical form, and,
• Solubility experiments.
Project information
Contact person SSM: Nils Addo, analyst at The Unit for Facility Radiation
Protection, Dept. of Nuclear Power Plant Safety
2015:18
Author: Edvin Hansson 1,2,*, Håkan Pettersson 1, Mats Eriksson 1,31 Linköping University, Linköping
2 Westinghouse Electrics Sweden AB, Västerås 3 Swedish Radiation Safety Authority, Stockholm
*Corresponding author, e-mail address: hanssoea@westinghouse.com
Uranium Aerosol Characteristics
at a Nuclear Fuel Manufacturing
SSM 2015:18
This report concerns a study which has been conducted for the
Swedish Radiation Safety Authority, SSM. The conclusions and
view-points presented in the report are those of the author/authors and
do not necessarily coincide with those of the SSM.
Sammanfattning
Vid alla kärntekniska verksamheter krävs att strålningsmiljön kontrolleras dels ge-nom mätningar av ytors- och luftens kontamination i anläggningen och dels med persondosimetriverksamhet inkluderat helkroppsmätning.
De olika metoder som används för att beräkna intecknad effektiv stråldos från konti-nuerligt intag via inandning är förknippade med stora osäkerheter.
Materialkarakteristiken är avgörande för hur den luftburna aktiviteten (i projektets fall uranaerosoler) fastnar i näsa, luftstrupe och sedan lungorna och löses upp i kroppens vätskor, t.ex. lungvätskan. En viss del av aerosolerna hamnar i näsans slem och följer intagsvägen via mag- tarmkanalen och vidare ut i blodet.
Små partiklar (< 2 µm AMAD) som inhaleras uppför sig annorlunda än stora partik-lar. De har bl.a. större förmåga att tränga ner djupare i lungorna och nå alveolerna. Luftvägarna har i allmänhet lättare att göra sig av med större partiklar, som då snabbare kan lämna kroppen. Det är emellertid inte endast partikelstorleksfördel-ningen som är av betydelse, utan även hur aktiviteten fördelas mellan dessa storle-kar.
Det finns ett behov av bättre kunskap om material- och aerosol karakteristik för luftburen radioaktivitet som finns i verksamheten vid kärntekniska anläggningar. Därför ska detta forskningsprojekt utreda hur uranaerosoler kan karakteriseras med avseende på bl.a. storlek, utseende och hur dessa sammanhålls i formationer med andra partiklar. Vid Bränslefabriken i Västerås tillverkas kärnbränsle och i verksam-heten förekommer luftburna uranpartiklar s.k. uranaerosoler som projektet använt för forskningsstudien genom att samla in dessa med hjälp av olika filter. Linköpings universitet utförde som myndighetsstöd denna förstudie i ett forskningsprojekt. Må-let är att kunna redogöra för uranaerosolers karakteristik med avseende på storleks- och aktivitetsfördelning, samt inre struktur hos uranpartiklar från olika processteg i en kärnbränslefabrik.
Resultaten visar på att uranaerosoler i studien varierar signifikant med avseende på storleksdistributionen. I förstudien observerades uranaerosoler allmänt som diskreta partiklar, men även i förekomster med andra partiklar löst fästa i varandra. Ura-naerosolerna förekommer även i olika former av uranoxider.
Vidare studier som projektet identifierat är bl.a. att utreda hur uranaerosolers parti-kelvolymer i förhållande till deras aerodynamiska diameter påverkar AMAD beräk-ningar. Vidare behövs fler antal luftprover genomföras och analyseras. Ytterligare moment att utreda är uranaerosolers kemiska form och förhållanden som t.ex. lös-lighet.
2
Uranium Aerosol Characteristics at
a Nuclear Fuel Manufacturing Site -
Particle Size, Morphology and
Chemical Composition
Authors: Edvin Hansson1,2,*, Håkan Pettersson1, Mats Eriksson1,3 1Linköping University
2Westinghouse Electrics Sweden AB 3Swedish Radiation Safety Authority
*Corresponding author, e-mail address: hanssoea@westinghouse.com
Abstract
Knowledge of radioactive aerosol characteristics is crucial in order to carry out ac-curate internal dosimetry calculations following the International Commission on Radiological Protection methodology. Examples of such parameters are Activity Median Aerodynamic Diameter and solubility. Understanding of such parameters requires knowledge of aerosol characteristics such as size distribution, morphology and chemical form.
In this pre-study, these parameters have been studied at two process steps (fluidizing bed furnace and burnable absorber grinder) at the Westinghouse Electric Sweden AB nuclear fuel factory in Västerås, Sweden. Aerosols were collected using a cas-cade impactor and analyzed with Scanning Electron Microscopy coupled with Ener-gy Dispersive X-ray analysis.
The results show a significant variation in uranium aerosol shape (spherical, near-cylindrical, irregular with sharp edges, conglomerates of small particles, etc.), with particle size distributions to some extent deviating from the expected lognormal distribution, possibly indicating two 'families' of particles.
The vast majority of the radioactive aerosols consist of uranium and oxygen, but at the bed furnace, 1-6 % of the uranium aerosols contained fluorine. Other uranium aerosols were attached to/consisted of elements such as nitrogen, aluminum, gado-linium and silicon.
Table of contents
Uranium Aerosol Characteristics at a Nuclear Fuel Manufacturing
Site - Particle Size, Morphology and Chemical Composition ... 1
Abstract ... 2
Table of contents ... 3
Abbreviations ... 4
Introduction ... 4
Uranium Aerosol Collection ... 5
Collection sites ... 5
Cascade Impactor and Filters ... 6
SEM-EDX Analysis ... 8
Results ... 9
Particle distributions ... 9
Particle spectra ... 12
Particle size, shape and chemical form ... 12
Discussion ... 15
Particle distributions ... 15
Particle size, shape and chemical form ... 16
Impactor cutoffs and AMAD ... 16
Uncertainties ... 17
Conclusions ... 17
Future work ... 17
Acknowledgements ... 17
4
Abbreviations
AMAD Activity Median Aerodynamic Diameter
AMTD Activity Median Thermodynamic Diameter
BS Backscatter
CRP Coordinated Research Project
EDX Energy Dispersive X-ray
IAEA International Atomic Energy Agency
ICRP International Commission on Radiological Protection
LiU Linköping University
MCE Mixed Cellulose
SEM Scanning Electron Microscopy
SDD Silicon Drift Detector
WSE Westinghouse Electric Sweden AB
Introduction
Nuclear fuel manufacturing sites handle large amounts of uranium in various chemi-cal forms. Uranium, consisting of isotopes being alpha emitters, requires careful monitoring of internal contamination among workers. This can be carried out in different ways, one being urine sampling and analysis in order to evaluate chronic or acute intake.
Internal dose calculations based on urine sampling require knowledge about the material characteristics in question (ICRP 1994). In particular, the particle Activity Median Aerodynamic Diameter (AMAD) and aerosol solubility need to be investi-gated. The present work is a pre-study of uranium aerosol size distribution, mor-phology and chemical composition at the Westinghouse Electric Sweden (WSE) nuclear fuel factory in Västerås, Sweden.
The International Commission on Radiological Protection (ICRP) has suggested that an AMAD of 5 µm should be used in absence of site specific information (ICRP 1997). The 5 µm figure has previously been validated throughout the literature, primarily by using cascade impactors. For example, Kravchik et al. (2008) presented AMAD measurements ranging between 1.6-11.0 µm at an uranium processing plant. Thind (1987) and Ansoborlo (1989) presented AMAD values for different work locations ranging between 4-10 µm. All studies were in fair agreement with the suggested 5 µm ICRP value.
Furthermore, review articles exist on the matter, and some summarize AMAD measurements carried out at nuclear fuel factories (Connelly and Jackson, 2013; Dorrian and Bailey, 1995). The presented AMADs showed some significant varia-tion, e.g. pellet press measurements ranged between 3.9-8.8 µm and uranyl fluoride between 1-9 µm. Exact sampling locations were not always specified.
While information about uranium particle morphology exists (IAEA, 2011), publica-tions specialized towards aerosol characteristics are scarcer (Ansoborlo, 1997; Eid-son, 1980). The need for increased knowledge about radioactive particles has been identified by the International Atomic Energy Agency (IAEA). A coordinated re-search project (CRP), "Environmental Behaviour and Potential Biological Impact of Radioactive Particles" has been initiated. Results from this study will be presented within this CRP.
The WSE factory operates a wet chemical process where UF6 is converted via am-monium uranyl carbonate (AUC) to UO2. The UO2 is pelletized by pressing, sinter-ing, grinding and finally inspected before insertion into fuel rods. In addition, there is a burnable absorber (BA) pelletizing workshop, as well as a large number of side processes, allowing for recycling of uranium production waste. Most process steps mentioned in this work have, to the best of the author's knowledge, not been covered in the literature with respect to AMADs or particle morphology.
The aerosol shape is indirectly considered in AMAD estimates when cascade im-pactors are used. Aerosol size separation is achieved based on the particle's aerody-namic properties, where particle shape, described by the shape factor (Hinds, 1999) plays an important role, see Equation 1,
(1) where,
da (µm) is the aerodynamic diameter,
de (µm) is the irregular particle's equivalent diameter, pp is the standard particle density (1000 kg/m3), p0 (kg/m3) is the irregular particle density and
χ is the shape factor (no unit). The shape factor is unity for a sphere, 1.08 for a cube, 1.32 for a cylinder (lying down) with a length four times the diameter. A conglom-erate of two spheres has a shape factor of 1.12 (Akselsson et al. 1994).
Particle shape affects resuspension, where rough (uneven) particles are subject to a weaker adhesive force to a surface compared to smooth particles (Qian et al., 2014). Resuspension from surface contamination plays a major role in worker exposure. Hence knowledge on particle shape is of interest in everyday radiation protection work.
In this pre-study, four sites were selected for cascade impactor sampling and scan-ning electron microscopy (SEM) coupled with energy dispersive X-ray (EDX) measurements. The purpose of the pilot-study was to provide preliminary infor-mation on uranium aerosol characteristics at a nuclear fuel factory, in order to later on carry out a complete survey based on findings and learning experiences.
Uranium Aerosol Collection
Collection sites
Uranium aerosols were collected at four sites within the factory using a cascade impactor. Cascade impactors carry out aerosol separation based on particle inertia. Air is pumped through the impactor, which is divided into several stages. At each stage there is a filter medium, and air flow velocity is increased at each stage throughout the impactor. The inertia of large particles will cause them to impact onto filter media at the early stages of the impactor, whereas small particles require a higher velocity in order to impact onto filter media. Hence an aerosol separation based on particle aerodynamic diameter is accomplished.
6
The sites chosen were expected to generate a variety of particles with respect to AMAD, morphology and chemical composition. Sampling-related data are summa-rized in Table 1.
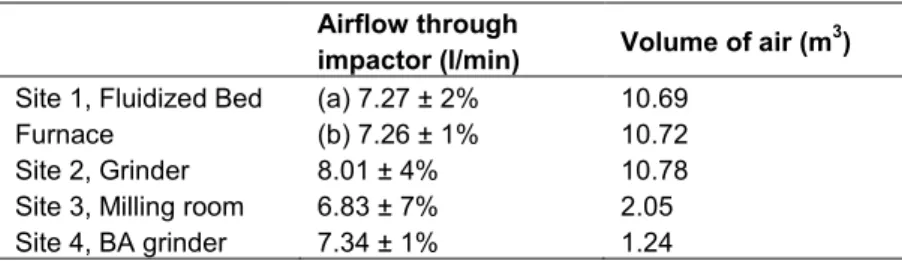
Table 1: Impactor airflow and total air volume at the four sampling sites. Airflow through
impactor (l/min) Volume of air (m
3)
Site 1, Fluidized Bed Furnace (a) 7.27 ± 2% (b) 7.26 ± 1% 10.69 10.72 Site 2, Grinder 8.01 ± 4% 10.78
Site 3, Milling room 6.83 ± 7% 2.05 Site 4, BA grinder 7.34 ± 1% 1.24
Site 1: The impactor was placed in a room above three fluidized bed furnaces where Ammonium-Uranyl-Carbonate (AUC) is led into three different furnaces, oxidizing AUC into UO2. Hence, the airborne contamination in the room was expected to consist of a mixture of AUC, UO2 and U3O8. Sampling was carried out twice, one with MCE filters (a) and one with carbon tape (b).
Site 2: The impactor was placed in a milling room, where UO2 is milled as a prepa-ration step for BA pellet manufacturing, which requires a finer powder for blending with gadolinium and pore building material. An AMAD smaller than the ICRP de-fault value of 5 µm was expected, with irregularly shaped particles dominating the morphology.
Site 3: The impactor was placed at one of the four pellet grinding stations in the pellet manufacturing workshop. At this station pellets are ground in order to obtain a specific diameter. An AMAD near the ICRP default value of 5 µm was expected (Thind, 1987), with irregularly shaped particles dominating the morphology. Site 4: The impactor was placed at the pellet grinding station in the burnable absorb-er pellet manufacturing workshop. The opabsorb-erations are similar to those at Site 3, but the material differs since gadolinium and pore building material has been added. An AMAD smaller than the ICRP default value of 5 µm was expected since a finer uranium powder is used. Particle morphology was expected to be similar to Site 3.
Cascade Impactor and Filters
A four-stage Sioutas Cascade Impactor was used with a Leland Legacy Sample Pump (SKC Cat. No. 100-3002). A four-stage impactor is not ideal for AMAD esti-mates due to the limited number of filter stages, giving rather poor size resolution. It is, however, suitable for SEM/EDX analysis, where filter analysis is very time con-suming. Figure 1 shows the impactor used in the study as well as particles impacted onto a mixed cellulose (MCE) filter.
(a)
(b)
Figure 1: (a) The Sioutas Leland Legacy impactor and (b) Particles impacted onto a MCE filter casing the black strip (22 x 1 mm2).
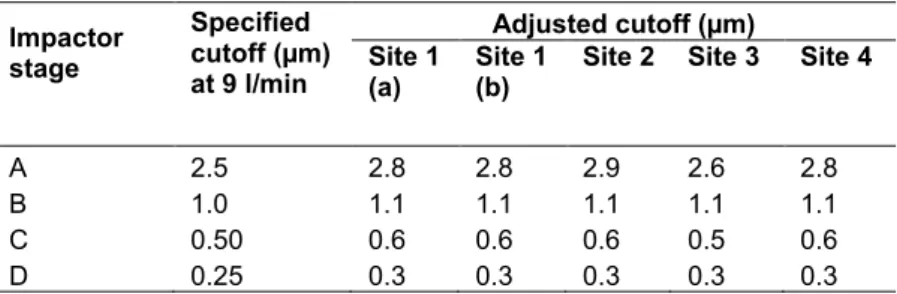
The impaction cutoff is defined as the limit at which 50 % of all particles with a given aerodynamic diameter will impact onto the impaction medium. Adjusted cut-offs due to different flow rates are presented in Table 2.
The cutoffs were specified for a pumping flow rate of 9 l/min. Before and after each sampling session the flow rate was checked using an Alicat MB-50 SLPM-D flow meter. It was found that the pump was not always capable of maintaining a steady flow rate of 9 l/min. The flow rate was, however, nearly constant at 7.5 l/min. The pump was therefore set to a flow rate of 7.50 l/min, and cutoffs were adjusted (see Table 2) using Equation 2 (Copley and McDonald, 2009),
(2) where,
D50,2/ D50,1 is cutoff ratio correction factor, Q1 is the specified flow rate (l/min) and Q2 is the actual flow rate (l/min).
Table 2: Cutoffs for the Sioutas Cascade Impactor as specified by the manufacturer at 9 l/min as well as adjusted cutoffs at different sampling sites.
Impactor stage Specified cutoff (µm) at 9 l/min Adjusted cutoff (µm) Site 1 (a) Site 1 (b)
Site 2 Site 3 Site 4
A 2.5 2.8 2.8 2.9 2.6 2.8
B 1.0 1.1 1.1 1.1 1.1 1.1
C 0.50 0.6 0.6 0.6 0.5 0.6
8
Different filters were available for the cascade impactor. MCE, pore size 0.45 µm (SKC cat. No. 225-1911) were chosen for the four impaction stages and a glass fiber filter (Whatman GF/A, cat. Nr. 1820047) for the final collection filter. Glass fiber filters were chosen to obtain low pressure drop in the impactor (i.e. allowing high flow rates).
For Site 1, Bed furnace, additional sampling was carried out using sticky carbon tape instead of MCE filters on the impaction plates. The carbon tape's conducting proper-ties was required in order to obtain high resolution images of small particles (<1 µm) from the SEM-EDX analysis.
All filters were weighed before and after sampling, but the weight difference was insignificant. The impactor was decontaminated using isopropanol tissues before each sampling session in order to minimize the risk of filter cross-contamination.
SEM-EDX Analysis
All SEM-EDX analyses were carried out using a Carl Zeiss Microscopy Ltd EVO LS 15 Scanning Electron Microscope situated in IAEAs Environmental Laboratories (EL). The X-ray detector used for the Energy Dispersive X-ray (EDX) analysis was an electrical cooled 50 mm2 Silicon Drift Detector (SSD) Oxford Instruments X-Max with an energy resolution of 125 eV of Mn Kα-line. The software used for
SEM-imaging was SmartSEM (version 5.06) and for the EDX analysis, INCA (vers-ion 5.03). Usually, 20 kV accelerating voltages were used in the EDX analysis enabling excitation of both uranium L and M electrons. Imaging was usually con-ducted in backscatter mode (BS). For the set using MCE filters, the analysis were carried out in variable pressure mode to minimize charging effects on the sample. The INCA software used a cobalt sample for calibration of the EDX system. Since the area of impaction held tens of thousands of particles, the entire area could not be analyzed. Random fields were used, and scanning was run until 500-1000 uranium particles had been detected and analyzed on each impactor stage. The par-ticle discrimination level was set to a parpar-ticle length of 0.10 µm.
Two sets of impactor filters (Stage A-D) were analyzed using SEM/EDX controlled by the particle software INCA: Site 1, Bed furnace and Site 4, BA grinder. Im-paction material was carbon tape and MCE filters, respectively. The final filters (glass fibre) were not examined due to limited time for analysis.
Due to the irregular shape of many analyzed particles, the length parameter given by INCA has limited use for evaluation of particle size distribution. Instead, an adjusted particle diameter was calculated by transforming particle transectional area into a corresponding circular particle diameter. The overall particle size distribution (all impactor stages) was determined by random sampling and replacement of particles from each impactor stage. The number of sampled particles from each impactor stage was proportional to mean particle density (Table 3, Table 4).
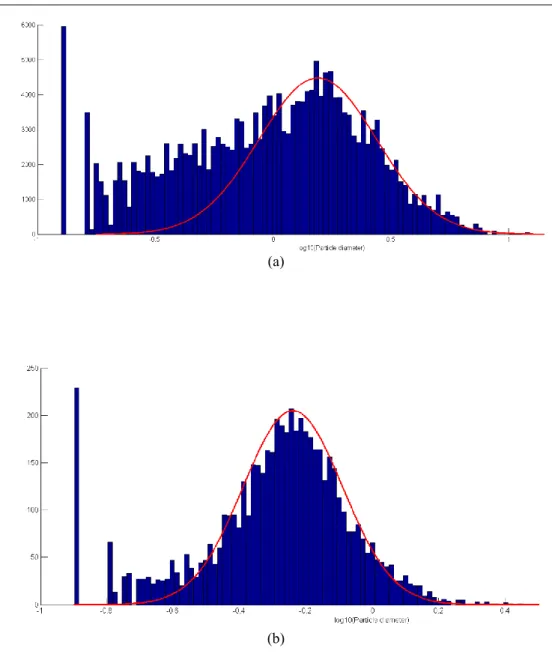
Particle size distributions generally follow a log-normal distribution (Axelsson, 1994). This was evaluated by manually fitting a normal distribution to the logarithm of the particle length distribution.
Results
This is a pre-study, and all results should be viewed as preliminary.
Particle distributions
A total of 3768 and 9177 particles from Site 1, Bed furnace and Site 4, BA-grinder, respectively, were analyzed. Table 3 and Table 4 show the number of particles de-tected per scanned field (field area: 7870 µm2) for Site 1, Bed furnace and Site 4, BA grinder. The number of particles per field is not comparable for the two sites due to different sampling times and scan times.
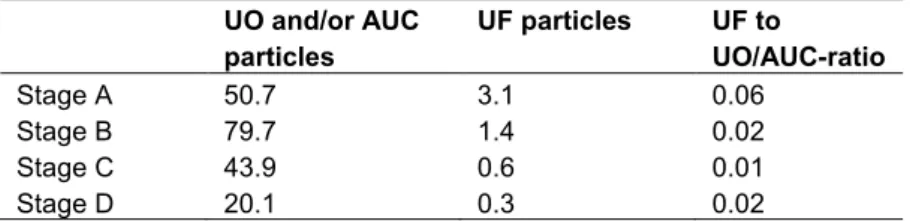
Table 3: Mean number of detected particles per scanned field at Site 1, Bed furnace
UO and/or AUC particles UF particles UF to UO/AUC-ratio Stage A 50.7 3.1 0.06 Stage B 79.7 1.4 0.02 Stage C 43.9 0.6 0.01 Stage D 20.1 0.3 0.02
Table 4: Mean number of detected particles per scanned field at the grinding station at Site 4,
BA-grinder
UO UO with Gd UF UO with Gd to UO-ratio
Stage A 15.9 0.5 0 0.030
Stage B 23.7 0.5 0 0.020
Stage C 56.7 0.1 0.1 0.002
Stage D 45.0 0.1 0 0.002
Figure 2 shows the particle size distribution for impactor Stage A-D for Site 1 and Site 4, as well as the overall particle size distribution (all stages). Figure 3 shows two examples (one poor fit, and one good fit) of how the log-transformed particle size distribution fits to a normal distribution. Table 5 shows particle size statistics.
10 Figure 2: Particle size distribution for impactor Stage A-D at Site 1 , Bed furnace and Site 4 , BA grinder. The x-axis corresponds to particle diameter (µm) and the y-axis to number of particles counted. SSM 2015:18
(a)
(b)
Figure 3: Log-transformed particle diameter distribution for (a) all particles at Site 1, Bed
fur-nace and (b) impactor stage C at Site 4, BA grinder. Super imposed are fitted normal
12 Table 5: UO particle statistics.
Stage Min (µm) 1:st quantile (µm) Median (µm) 3:rd quantile (µm) Max (µm) Bed furnace A 0.13 0.74 2.23 3.16 8.89 B 0.13 0.86 1.30 1.74 5.91 C 0.13 0.44 0.65 0.94 12.26 D 0.13 0.24 0.34 0.50 3.60 All 0.13 0.48 1.05 1.89 12.26 BA grinder A 0.13 0.40 0.70 1.35 18.70 B 0.13 0.44 0.67 0.90 3.31 C 0.13 0.40 0.55 0.71 3.46 D 0.13 0.25 0.35 0.47 3.64 All 0.13 0.33 0.49 0.71 18.70
Particle spectra
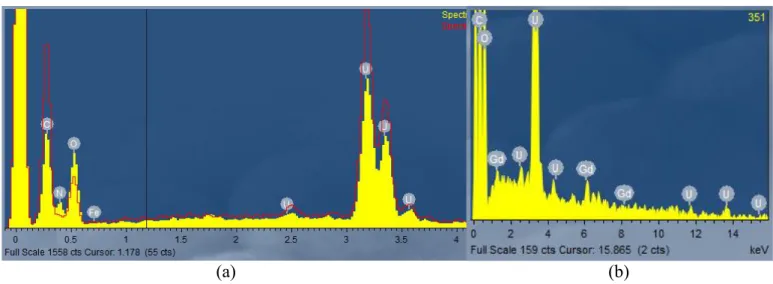
Figure 4 shows examples of EDX spectra of uranium aerosols.
(a)
(b)
Figure 4: (a) Spectrum comparison of a UO (red line) and an AUC (yellow spectrum) particle. Notice the 0.392 keV Kα-peak of N. (b) shows the spectrum of a UO2/U3O8-particle with Gd
attached to it. Note the different energy scale of the spectra.
Particle size, shape and chemical form
A wide variety of uranium particle sizes and shapes were observed. The average uranium aerosol size was smaller at Site 4, BA grinder. Shapes ranged from spheri-cal, pointy, irregular, cluster structures and combinations with other elements such as Al and Si.
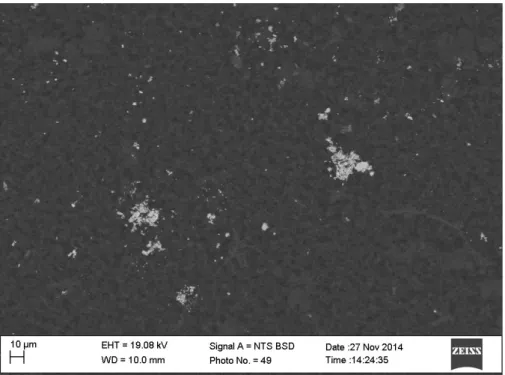
Figure 5 shows a backscattered SEM image where high Z elements give a higher signal and shows as white spots in the image. This image gives an example of parti-cle size variation and cluster structures at Site 4, BA grinding station. All white spots
in the image correspond to particles containing U and O. A few Gd-particles were found attached to the largest cluster.
Figure 5: Example of particle deposition showing particle size variation and particle clusters at Site 4, BA-grinding station. Image taken from impactor stage A in backscattered mode.
Figure 6 shows examples of uranium aerosol size and shape at Site 1, Bed furnace. For this particular image, an X-ray mapping was carried out for U (yellow) and N (red) using an accelerating voltage of 20 kV. Notice how the distribution of N does not always match the distribution of U, indicating a combination of AUC and UO2/U3O8. In some particles, combinations of N and U, believed to be AUC, were found attached to the surface of UO particles.
Particles containing U and F were, on average, much smaller than the average UO particle.
14
Figure 6: X-ray mapping of UO and AUC particles superimposed on a BS image. Red and yellow pixels symbolize signal from the characteristic X-rays of N and U, respectively. Due to low count rate only the largest particles were registered.
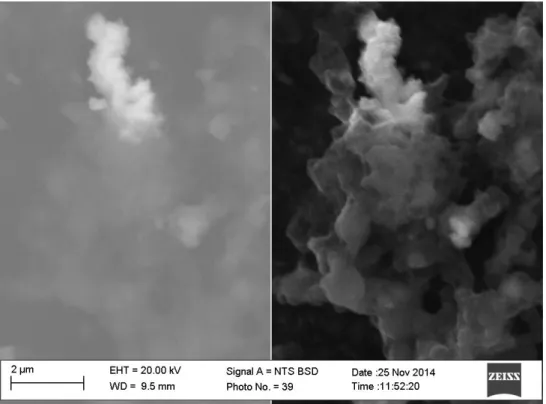
For impactor Stage D at Site 1, Bed furnace, uranium aerosols tended to be attached to a non-uranium material consisting predominantly of S, O and probably C. The two lighter areas in Figure 7 correspond to uranium aerosols attached to the material, whose origin still needs to be explained. A corresponding phenomenon was not observed at Site 4.
Figure 7: A backscatter (left) and secondary electron (right) image of two uranium particles (white) of different size attached to a non-uranium material consisting predominantly of S, O and probably C.
Discussion
Particle distributions
The results show that the average uranium aerosol is smaller at Site 4, BA grinder than at Site 1, Bed furnace. This is not surprising, since the BA pelletizing workshop uses a finer uranium oxide powder than the regular pelletizing workshop. The gen-erally small aerosols at Site 1 were, however, surprising and are believed to corre-spond to an AMAD smaller than the ICRP default value of 5 µm. This has yet to be confirmed.
Studying Figure 2, it can be observed that there appears to be two 'families' of urani-um aerosols - one with very small particles (diameter << 1 µm) and one with larger particles. This might be supported by Figure 3, which shows that particle size distri-bution is not described perfectly by the expected lognormal distridistri-bution. The phe-nomenon is most obvious for impactor Stage A at Site 1, Bed furnace. The reason for this has yet to be explained, and explanations other than different 'families' of particles exist. One explanation could be a 'background' of very small particles pre-sent at each impaction stage, where particle activity distribution is better explained by the Activity Median Thermodynamic Diameter (AMTD) rather than AMAD. The ICRP states that AMAD is typically applicable to aerosols with AMAD >0.5 µm
16
The phenomenon is much less obvious at Site 4, BA grinder. There are two possible explanations for this: 1) There were not as many very small particles or, 2) The SEM image resolution on the MCE filters was worse, due to the non-conducting medium, so that these small particles were not detected.
Particle size, shape and chemical form
The INCA software was set so as to register uranium particles only. When a particle was detected, the X-ray spectrum was analyzed, and a list of all elements in the particle presented. The vast majority of uranium aerosols consisted, unsurprisingly, of oxygen apart from uranium. The U/O ratios showed some significant variation, probably due to different combinations of UO2/U3O8 and possibly signal distortion from oxygen in the background support. At Site 1, 1-6 % of the uranium aerosols contained fluorine. A quantification of the aerosols containing nitrogen, believed to be AUC, was not possible due to the spectrum analyzing algorithm, which could not identify the weak Kα-peak of nitrogen. Manual inspection of spectra showed a
sig-nificant presence of nitrogen in many uranium aerosols. The UO2/U3O8 ratio, UF chemical form and AUC quantification needs further investigation.
For Site 1, it was noted for the later impaction stages, especially Stage D, that small uranium particles were obscured by a conglomerate consisting of S, O and probably C. The origin of this material is unclear, but might stem from furnace material or corrosion products from precipitation tanks. The presence of this material made counting of discrete uranium particles difficult due to low contrast of the disturbing material. It is unclear how the uranium particles were incorporated into the material. This is an important observation as it could affect aerosol deposition in the airways, if inhaled, and solubility in body fluids.
The mixture of solid, large aerosols as well as clusters of small UO2 particles is in agreement with previous studies (Ansoborlo et al., 1997).
Impactor cutoffs and AMAD
The particle diameters in Figure 2 are presented as the equivalent particle diameter, which differs from the aerodynamic diameter. Impactor cutoffs are presented in aerodynamic diameters, which can explain the differences between Table 2 and the two sampling sites in Figure 2.
One important output from size distribution and activity measurements is the AMAD, which is required for internal dose estimates. In the present study, observa-tions were made that might add to the uncertainties of AMAD estimates, and hence to dose estimates. For example, it was noted that large particles were frequently capable of reach the later impactor stages (Table 5). It was also noted that large amounts of small particles (<0.2 µm) were attached to the early impaction stages, especially at Site 1. It still needs to be investigated if the influence on AMAD is significant.
AMAD estimates have yet to be carried out, see Future work below.
Uncertainties
Observations were made, that might add to uncertainties in the study:
In the SEM/EDX scanning procedure, uranium particles are registered based on contrast settings. We experienced a problem with the SEM high voltage supply causing some bias in the image resolution, i.e. we had some problems to detect small particles compared to larger ones, giving a possi-ble bias towards large particles. This is especially true for the later impac-tion stages for Site 1, where particles appeared to be hidden in a foreign material. Bias might also occur if a large particle is viewed as several small ones due to high contrast.
When random scans using the SEM/EDX equipment were carried out, a particle was required to be completely within the field to be counted. Some particles, especially large ones, were only partially within the field, and would then not be counted.
Conclusions
The main conclusions of this novel pre-study are:
Uranium aerosols vary significantly with respect to size and shape. There are indications of different 'families' of particles with respect to size distri-bution. This was most obvious at Site 1, Bed furnace.
Uranium aerosols are generally observed as discrete particles, but large conglomerates of loosely attached uranium particles were observed at Site 1, Bed furnace, as well as Site 4, BA grinder.
Uranium aerosols can consist of mixtures of uranium oxides, fluorides, ni-trites and Gd. The aerosols are frequently attached to other elements such as Al and Si in the shape of either discrete particles or other materials.
Future work
Being a pre-study, one aim of the present work was to identify prioritized future studies, including:
Estimating particle volumes, activities and correlation to the aerodynamic diameter in order to estimate the influence on AMAD calculations, Carrying out complete sampling using 8-stage impactors,
Carrying out radiometric analysis of all impactor stages,
Additional chemical form analysis, e.g. AUC quantification, UO2/U3O8 ra-tios, U-F chemical form, and,
Solubility experiments.
Acknowledgements
The authors are grateful to the Swedish Radiation Safety Authority for financial support to carry out the research project, to the International Atomic Energy Agency for allowing use of their equipment and Westinghouse Electric Sweden AB for im-pactor sampling. Special thanks go to Isabelle Levy and Francois Oberhansli at the
18
References
Akselsson R et al. Aerosoler. Lunds Tekniska Högskola och NOSA, 1994
Ansoborlo, E., Bérard, P. and Chalabreysse, J. Study of industrial exposure to class Y uranium compounds: methods and results. Rad Prot Dos, 26, 1/4, pp. 101-105, 1989
Ansoborlo et al. Particle Size Distributions of Uranium Aerosols measured in the French Nuclear Fuel Cycle, Radioprotection, 32(3) 319-330, 1997
Connelly, Jackson. Review of Respirable Particle Size Range, AMEC. Reference: RP0605-86C, 2013. Available at Nuclear Decommissioning Authority,
http://www.nda.gov.uk/ 2014-12-01
Copley M and McDonald J. Cascade impactor flow control, Inhalation 2009 Dorrian and Bailey. Particle Size Distributions of Radioactive Aerosols measured in Workplaces, Rad. Protect. Dosim. 60, 119-133, 1995
Eidson A.F. Comparison of Physical Chemical Properties of Powders and Respira-ble Aerosols of Industrial Mixed Uranium and Plutonium Oxide Fuels, NUREG/CR-1736, LMF-78, RH. Available 2014-12-08 at:
http://dspace.lrri.org:8080/xmlui/bitstream/handle/123456789/93/LMF-78%20Comparison%20of%20Physical%20Chemical%20Properties%20of%20Powd ers.PDF?sequence=1
Hinds, W.C. Aerosol Technology (2nd ed.). Wiley - Interscience, 1999
International Atomic Energy Agency, Radioactive Particles In The Environment: Sources, Particle Characterization and Analytical Techniques, IAEA-TECDOC-1663, Vienna, 2011
International Commission on Radiological Protection. Human Respiratory Tract Model for Radiological Protection, ICRP Publication 66, 1994
International Commission of Radiological Protection. Individual monitoring for internal exposure of workers. ICRP Publication 78, 1997
International Commission on Radiological Protection. Compendium of Dose Coeffi-cients based on ICRP Publication 60, ICRP Publication 119, 2012
Kravchik et al. Determination of the solubility and size distribution of radioactive aerosols in the uranium processing plant at NRCN, Radiation Protection Dosimetry (2008), Vol. 131, No. 4, pp. 418-424
Thind K.S. Comparison of ICRP Publication 30 lung model-based predictions with measured bioassay data for airborne natural UO2 exposure. Health Phys. 53, 1, pp.
59-66, 1987
Qian J et al. Walking-induced particle resuspension in indoor environments. Atmos-pheric Environment 89 (2014) 464-481
Strålsäkerhetsmyndigheten Swedish Radiation Safety Authority
SE-171 16 Stockholm Tel: +46 8 799 40 00 E-mail: registrator@ssm.se
Solna strandväg 96 Fax: +46 8 799 40 10 Web: stralsakerhetsmyndigheten.se
2015:18 The Swedish Radiation Safety Authority has a comprehensive responsibility to ensure that society is safe from the effects of radiation. The Authority works to achieve radiation safety in a number of areas: nuclear power, medical care as well as commercial products and services. The Authority also works to achieve protection from natural radiation and to increase the level of radiation safety internationally.
The Swedish Radiation Safety Authority works proactively and preventively to protect people and the environment from the harmful effects of radiation, now and in the future. The Authority issues regulations and supervises compliance, while also supporting research, providing training and information, and issuing advice. Often, activities involving radiation require licences issued by the Authority. The Swedish Radiation Safety Authority maintains emergency preparedness around the clock with the aim of limiting the aftermath of radiation accidents and the unintentional spreading of radioactive substances. The Authority participates in international co-operation in order to promote radiation safety and fi nances projects aiming to raise the level of radiation safety in certain Eastern European countries.
The Authority reports to the Ministry of the Environment and has around 300 employees with competencies in the fi elds of engineering, natural and behavioural sciences, law, economics and communications. We have received quality, environmental and working environment certifi cation.