KALMAR ECO-TECH'0I
Leachate and Wastewater Treatment with High-Tech and Natural systems KALMAR, SWEDEN, November 26-28, 200 I
37
LABORATORY TESTS OF ESTONIAN
LANDFILL LEACHATE
Pille Kiingsepp1·
2,William Hogland, Mail Kriipsa/,/•
3,Toomas Timmuslc
1Department of Technology, Kalmarf.Jniversity, Norra viigen 47,
Kalmar SE-391 82, Sweden
2Department of Biology and Geography, Tartu University,
Riia 23, 51010. Tartu, Estonia
3Institute of Water Management, Estonian AgriculturalUniversity
Kreutzwaldi 5, 51014. Tartu, Estonia
ABSTRACTDuring the last decade, many laboratory, pilot and full-scale experiments have been conducted to investigate the optimal low-tech purification methods for the treatment of numerous types of wastewaters. Constructed wetland is a low-tech treatment system, which usually contains multiple treatment possibilities. Frequently, some kind of soil treatment system is included as one treatment stage. Engineered wetland systems for purification of wastewater and leachate are not yet widely spread in Estonia. The possibility to use peat as filter media for treatment of leachate from Aardlapalu landfill (Tartu County, Estonia) has been studied. The leachate was transported into the laboratory, aerated and percolated through two different types of peat filters. The concentration of nitrogen compounds, COD and BOD was measured in the leachate before and after treatment. Hydrological consequences and chemical changes in the peat were investigated.
INTRODUCTION
Municipal solid waste landfill in Estonia
Aardlapalu municipal solid waste landfill has been operating since 1971. The landfill is located 5 km south from the city of Tartu. It lies on the flood plain of River Emajogi, on the Aardlapalu polder, which is considered as a potential groundwater aquifer. The total area of the landfill is 28.3 ha, of which about I 0.6 ha are currently in use. About 45 000 tonnes of municipal wastes is deposited annually. The landfill has no bottom sealing. The precipitation in the area is 580 mm per annum (Toomel, 1997). Due to high groundwater, it is hydraulically connected with the groundwater. Approximately 500m3 leachate is daily collected by drainage system surrounding the landfill. Leachate is stored in a natural oxidation pond, which means that today there is no active treatment of leachate.
Characteristics of leachate
The chemical compositions of the leachate sampled at the Aardlapalu landfill are listed in Table I. Mean values of samples, collected during the period 1999-2000, are presented. In addition, values from 26 municipal solid waste landfills in Sweden (UTVIK report, 1989) and from around the world (Spinosa et. al., 1991 and Stegman and Ehrig, 1989) are given. The Pille Kllngsepp, Mait Kriipsalu, Toomas Timmusk, Estonia, 289
William Hogland, Sweden https://doi.org/10.15626/Eco-Tech.2001.036
KALMAR ECO-TECH'0I
Leachate and Wastewater Treatment with High-Tech and Natural systems KALMAR, SWEDEN, November 26-28, 2001
results of analyses indicate that the leachate from Aardlapalu landfill has rather low value of BOD. In general, the concentrations of pollutants in leachate from the landfill in Estonia are lower compared to mean values of26 Swedish landfill and landfills in the world.
Table I. Characterisation of Aardlapalu leachate ([oomel, 1997), in comparison to leachate from 26 MSW landfills in Sweden (UTVIK report, 1989), and from around the world (Spinosa et. al., 1991 and Stegman and Ehrig, 1989). Mean values are given, and the maximum and minimum values are presented in parentheses.
26 Swedish
Aardlapalu Spinosa et. al., 1991;
Parameters landfill landfills, Stegman and Ehrig, 1989 UTVIK, 1989
BOD1 (mg/I) 29 (30-68) 600 (90-4200) 180 (20-550) BODs COD (mg/I) 720 ( 480-1530) 800 (180-4 700) 3000 (500-4500) N� (mg/I) 310 750 (30-3000) NO3 (mg/I) 0.6 (0.06-1.6) Tot-N (mg/I) 260 (170-300) 80 (8.6-600) 1250 (50-50000) Tot-P (mg/I) 3. 7 (3.2-4.1) 6 (0.1-30) Cl (mg/I) 1060(940-1160) 2100 (100-5000) SO4 (mg/I) 90(40-110) 80 (10-420) Zn (mg/I) <0.02 0.6 (0.003-6. 7) 0.6 (0.03-4) Na (mg/I) 813 (700-1000) 1350 (50- 4000) K (mg/I) 453 (360-580) 1 JOO ( I 0- 2500) Fe (mg/I) 7.7 15 (3-280) Pb (u!!/1) 1,8 40 (<10-220) 90 (8-1020) Cd (u!!/1) <0.01 6 (0.5-140) Cr (u!!/1) 82.5 (79-86) 300 (30-1600) Cu (ug/J) 12.2 (4-20) 50 (<J-480) 80 (4-1400) Purification pathways
The treatment of leachate by constructed wetlands, used as an only method of treatment or in combination with other methods, has become more common during the last decades. This type of treatment can contain for example water ponds, filters with various media and soil plant-bed systems. The processes such as aeration, sedimentation, filtration, precipitation, adsorption, transformation by bacterial and plant metabolism, chemical transformation and natural die-off occur in these systems during the treatment of polluted water. In filtration systems vertical and /or horizontal configuration and diversity of filter materials, such as peat, sand, bark, and crushed concrete can be used.
Availability of peat
Peat lands are found in all parts of the world except deserts and the arctic regions (see Table 2).
Pille Kllngsepp, Mail Kriipsalu, Toomas Timmusk, Estonia, William Hogland, Sweden
Leachate and Wastewater Treatment with High-Tech and Natural systems KALMAR, SWEDEN, November 26-28, 200 I
Table 2. Distribution of World Peat Resources (Cantrell et al., 1992; Robertson, 1994; Orru, 1995)
Country Former U.S.S.R. Canada
U.S. (with Alaska) Afrika
South -America
Estimated peat lands 150 million ha 110 million ha 50 million ha 34 million ha 6-10 million ha
Location of major peat deposits Russia (Siberia)
All provinces have large deposits Florida, Michigan, Minnesota, Wisconsin Kenya, Uganda, Burundi, South- Africa Venezuela, Guyana, Brazil, Argentina, Chile Central- America and
West-Indies 3 million ha Cuba, Jamaica, Panama Australia and
Oceania <I million ha
New Zealand, New South Wales, Queensland, Eastern Highlands Europe
Estonia
25 million ha l million ha
Finland, Sweden
It is estimated that there are at least I billion acres of peat land in the world, or about 4.5% of the total land area. The most extensive areas are located in the northern hemisphere (Cantrell et.al., 1992; Robertson, 1994). Peat lands cover 22% of total area of Estonia. Estonian peat resources are estimated at 2.4 billion tonnes (Orru, 1992; Estonian Peat Society, 1 998), of which 0.2 billion tonnes are less decomposed and 1,4 billion tonnes well decomposed (Estonian Statistic Agency, 200 I ). Estonian peat lands can be divided into three main types, according to content of inorganic compounds in peat (Orru, 1992). First region includes islands of West of Estonia, second Middle and North of Estonia. Third region is in South of Estonia, which contains the highest composition of inorganic compounds. In Estonia, mires are divided into: fens (minerotrophic mires) (M, 57% of total); transition fens (-mires) (S, 12%); and raised bogs (R, 3 I %). There are 9636 different types of mires and bogs, making 22.3% of the whole territory of Estonia. Peat can be mined in 520 sites. The storage of horticultural peat is 3628.89 milj m3 and fuel peat 10724.09 milj m3 (Orru, 1922).
Since the peat is widely available, it has received increasing attention world-wide, as an attractive alternative treatment media for purification of waste waters and leachate. Moreover, by use of this kind of biological material, the contaminants in leachate and wastewater might be removed without introducing any chemicals. There are a variety of mechanisms that might help to reduce the concentration of different pollutants during filtration/percolation process through the filter. These include the processes, such as adsorption, ion exchange, precipitation, complex formation with organic matter in soil, and presence of microbial communities, etc. Many investigations (Brown et al., 2000; Dissanayake and Weerasooriya, 1981; Soukand et al., 1996; Viraraghavan and Dronamraju, 1993; Viraraghavan and Rao, 1992; Warith, 1996; etc) show that peat has a high capability to reduce the concentration of heavy metals in wastewater and leachate. However, there is a lack of information on the use of peat filter for the removal of organic substances and nutrients.
Pille Kangsepp, Mait Kriipsalu, Toomas Timmusk, Estonia, _
� KALMAR ECO-TECH'0l
Leachate and Wastewater Treatment with High-Tech and Natural systems
KALMAR, SWEDEN, November 26-28, 2001 Objective
The low-tech leachate treatment method, such as constructed wetland treatment system has been chosen for purification of leachate from Aardlapalu landfill. The criteria were that the treatment method selected should be able to remove contaminants, especially such as COD, BOD and ammonia-nitrogen (NH3-N) present in the leachate. Peat land, surrounding the landfill, could be a natural low-cost final polishing step for leachate treatment. The aim of this study is to clarify if locally available peat can be used as medium for treatment of the leachate from the Aardlapalu landfill. In addition, another type (with higher organic content) of peat has been tested as filter media, the pathways of the leachate transport in the filter body has been investigated as well as change in the peat composition during experiment.
METHODOLOGY Materials
Two filter bodies (FB) with size of lm3 have been constructed for the experiment. It was decided to test two types of peat (undisturbed peat sample from Aardlapalu landfill site and a mixed peat sample from neighbouring peat industry) and compare the results obtained from tests. In order to get filter FBI, the top layer (50 cm) of the peat land with vegetation was taken away and a metal filter body with size of I m3 was pressed into the ground in vicinity of the Aardlapalu landfill, excavated and transported to laboratory. The samples of peat were taken from 4 different depths (Fig. I) beside the place where an undisturbed I m3 peat filter was excavated, and analysed in order to characterise properties of the peat (Table 5).
S,mpl, I 5 20 ,m Sam pie 2 2s.so cm Sam pie 3 S0-80 cm
Sample 4 80-I00 cm
Figure 1. Sampling matrix of Aardlapa/u peat
The peat in Aardlapalu has formed from connate waters and lakes of Konsu, invaded by plants. It is classified as minerotrophic mire, and consists of well-decomposed reed, and Carex peat. Thickness of the mire is 1,9-5, I m. Ash content is 38% (Orru, 1995). The selected site has been drained over 20 years ago. The distance between the drains is 12 m. The sites have been used as grassland. The upper 0,5 m has poor infiltration properties due to the effect of agricultural usage. Hydraulic conductivity of natural peat land was measured on the field in Aardlapalu, next to the site where FBI was obtained. Hydraulic conductivity of the two first layers (see Figure I: Sample I and 2) and the two deepest layers (Sample 3 and 4) of FBI were similar, 8 x 10·6 m/sec and 8 x 10·5 m/sec, respectively.
Moisture content of the two types of peat was analysed before the infiltration test (see Table 3). Samples were taken, weighted and dried at I 05a° C for 24 h and weighted again. Content of water(%) was calculated by following equation:
M, -M 1
W (%) = x 100
M1 (Eq. I)
where
W (%)=moisture content(%);
Pille Kangsepp, Mait Kriipsalu, Toomas Timmusk, Estonia, William Hogland, Sweden
Leachate and Wastewater Treatment with High-Tech and Natural systems KALMAR, SWEDEN, November 26-28, 2001
M 1 = weight of sample before drying (g); M2 = weight of dried sample (g);
Ta ble 3. The initial moisture content in the filter materia Is.
Moisture content(%) Depth (cm) FB 1 FB2 0-25 28 64 25-50 66 50-75 71 75-100 77
The other filter body was filled with milled loose (fluffy) peat, which has been mined from Umbusi raised peat bog (FB2). It was formed from flooded meadows of Poltsamaa river and its tributaries. This high-moor deposit is classified as swamp peat. Average decomposition rate is 13%, ash content I%. Properties of the unused peat in FB2 are presented in Table 3. The peat in the FB2 was homogeneous compared to the peat in FB 1. Chemical analyses of the peat samples were made in Laboratory of Plant Biochemistry of Estonian Agricultural University (Table 5). The peat in FB2 has lower value of pH and content of P, and higher concentration of K than the peat in FBI.
Pre-treatment of leachate
The leachate was transported into the laboratory, and aerated 11 days in a compact wastewater treatment unit Roth Micro-Step with size of 3 m3 . The samples of the leachate were taken before the aeration, after 6 and 11 days aeration. Aeration was stopped after 11 days. One sample was taken and analysed on the second day after the aeration was stopped, in order to analyse the change in the quality of leachate. The influent and effluent analyses were made in Laboratory ofTartu Wastewater Treatment Plant.
Infiltration
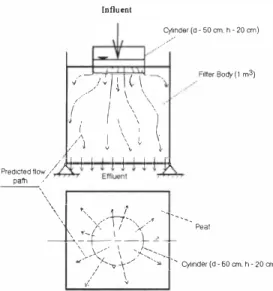
Pre-treated leachate was percolated through two different types of peat filters (FB I and 2, Fig. 2). The properties of leachate as well as peat were measured before and after infiltration. Leachate was loaded on both filters four hours per day. The leachate was directed through FBI and FB2 for 4 and 3 days, respectively. The flow rate of leachate through peat filters was different due to variation in the flow rate, attributed to different density and moister content of the two peat types. The flow-rate of leachate on FBI and FB2 was 0.3 I/min and 2 I/min, respectively. During the whole test period a total amount ofaleachate that was directed through the FBI and FB2 was 0.5 m3 and 1.5 m3 , respectively. A cylinder was mounted on top of each peat filter body to distribute the water evenly over the surface, thus avoiding contact-filtration at the walls.
Pille Kllngsepp, Mait Kriipsalu, Toomas Timmusk, Estonia,
\,,'(-- \ �<>--
-�
�
,
M. /--�-\-.,..,., ':.:il'
Cy11nder(d·60cm.h-20c:m) ,,>\/1-_,
-1----'-< \ /
�
',., -./__
+-1___
,,
_:_t_,
KALMAR ECO-TECH'0ILeachate and Wastewater Treatment with High-Tech and Natural systems KALMAR, SWEDEN, November 26-28, 2001
Influent Cy11nder (d-50 cm. h • 20 cm) · Fitter Body ( 1 m3)
,
( ,(
\ \'
\ { //'
,) VI
\\
' \ V I(
\ • / \, '4'..--/;Fl (, I
·' _, .. / \ \ \ '\ _/_,,,, /JI I I I I I l ll Predicted flow/ ,.�<
\1\
Peat ✓,/ \Figure 2, Expected distribution of leachate in the peat filter bodies, Measurements of pathways of leachate distribution
After the test, water content of the peat in filter bodies was measured, in order to control the actual distribution of the water, 50 peat samples were taken from both filter bodies by a soil
drill (see Fig, 3). Samples were weighted and dried at 105e° C for 24 h and weighted again.
Content of water(%) was calculated by equation I.
Number of a borehole Ill IV '✓ 80fehole
6
' \ rh-7'n 20cm Borehole .i:.._______:_,. � ..:..d"-· t-1 ---,.6
Figure 3. Sampling matrix for measurement of water content(%) in the peat.from filter bodies,
Pille Kl!ngsepp, Mait Kriipsalu, Toomas Timmusk, Estonia, William Hogland, Sweden
...
IEIOll N-to1 N02 N-to1 N03 11.2 23"
Leachate and Wastewater Treatment with High-Tech and Natural systems KALMAR, SWEDEN, November 26-28, 200 I
RES UL TS AND DISCUSSION Reduction of pollutants from leachate
The BOD levels were reduced after 11 days of continuous aeration. The analyses of sample taken on the second day after aeration was stopped show that value of the BOD increases without aeration. Results of analyses are presented in Table 4.
Table 4. Characteristics of leachate during the experiment (Laboratory ofTartu Wastewater Treatment Plant)
Parameters 1mn1t1
Influent Effluent from Filter 1 Effluent from Filter 2
coo NH4 No:!
Date Dav BOO coo
""
NH4 I N03 N02 pH IEIOll coo N-1ot NH4 N02 pH pH •• no n..
...
,
..
•
...
...
"""
6 11 5&4 300 321 11 n "...
.,. n• 11 12.
.,
37<•••
:,0... . ..
2'l ..,, «n Bil 12 0...
-··
"
...
.•.
,.
'
"'
...
3 6'
....
...
,..
" ""...
...
<M 10 0...
44 n ••...
·-
.,
...
...
...
...
' "
13 25 572.... ,
..
,
1S...
'"""
28 375...
...
A n •• 167...
8 n na 33...
42 ,n no 31.08. 28 342 106 5.6 52 0.26 7.3Filtration of the aerated leachate through the filters increased the BOD content, which could have been caused by the leaching of organic matter from the peat. There was no significant reduction in the level of COD after 11 days of aeration. These results indicate that longer aeration is required for this type of leachate. Percolation aerated leachate through undisturbed natural peat filter (FBI ) decreased the COD level in the leachate while the percolation through the loosed peat (FB2) increases the COD level. High COD value in effluent could be due to leakage of compounds from the loose peat material.
The values of total nitrogen and ammonia-nitrogen varied during the period of 11 days aeration, but during the filtration process the reduction of their concentration in leachate were achieved. The concentration of nitrate in leachate increased during aeration process and filtration through the FBI , but has reduced in effluent from FB2. Results indicate that through the application of leachate to the peat filter, the nitrogen compounds in leachate underwent various transformation processes.
The pH of the influent varied between 7 and 8, and during the infiltration process pH value decreased by 1-3 pH units. The pH of the leachate decreased significantly during the filtration process by Filter 2. The change in pH values could be attributed to the leaching of humic acids from the peat.
Some other authors, such as Bergman ( 1991) and Carlsson and Hell (1994) have achieved insufficient results in attempts to retain organic substances and nutrients. The relative extent to which adsorption or biological degradation dominates in nutrient removal may vary with the organic medium used, as well as with local conditions like pH and temperature (McNevin and Barford, 1998). According to Bohn et al. ( 1979), the capacity of soils to adsorb anions increases with increasing acidity. Adsorption of solutes onto the surface of peat may benefit or hinder their subsequent degradation by microorganisms (McNevin and Barford, 1998). Biofilters and biotricling filters consist of three phases in intimate contact: a solid, organic phase; an aqueous phase; and an air phase. These last two may contain nutrients for degradation (McNevin and Barford, 1998). Moreover, if applying of the wastewater is intermittent, nitrification may increase due to an increased supply of oxygen (Lance, 1972).
Pille Kangsepp, Mait Kriipsalu, Toomas Timmusk, Estonia,
KALMAR ECO-TECH '0 I
Leachate and Wastewater Treatment with High-Tech and Natural systems
KALMAR, SWEDEN, November 26-28, 200 I
Vertical infiltration systems are often designed to separate suspended solids, organic matter, pathogenic bacteria, reduce nitrogen and to some extent phosphorus from the wastewater (Hedstrom, 2000). Nitrogen reduction is expected due to both aerobic and anaerobic zones and a carbon supply through plants. The air required to facilitate these aerobic transformations may be supplied as a co-current or counter-current stream to the liquid in the filter. Because the oxygen demand required for oxidation of dilute concentrations of nutrients is low, dissolved oxygen is assumed to be in plentiful supply in the aqueous phase (McNevin and Barford, l 998).
Changes of peat composition during the experiment
Comparison of the initial peat compos1t10n (Table 5) to compos1tton of the peat after experiment (Table 6), show that the composition of both type of peat in filters have changed during the experiment. The content of K has increased significantly in both types of the peat. The pH value, content of N, P, Mg, Ca in the peat filter FB2 has increased and content of organic matter decreased during the leachate filtration process. The analyses results of the deeper layer of natural peat (50-JO0cm in FBI ) show that the content of N, Ca, Mg and organic matter have decreased and content of P increased during percolation of leachate through the FBIa.
Table 5. Composition of the peat filters before the experiment (Analyses are made in
N Sample pHKCI (%) FBI 0-25cm 6.67 0.525 25-50cm 6.09 2.637 50-75cm 5.90 2.838 75- l 00cm 5.72 3.000 FB2 3.5 1 0.997 J p (mg/kg) 1 23.45 7 1 .02 4 1 .49 63.90 9.25 K (mg/kg) Ca (mg/kg) 47.33 72.3 1 3 1 .88 37.98 97.55 5 1 23 1 6424 20985 2054 1 5440 J Mg (mg/kg) Org. matter (%) 72 1 .26 1 1 .30 2024 . 1 6 46.95 24 1 8.07 3053.73 50. 1 1 55.49 975.35 84.75
Table 6. Composition of peat filters after experiment (according to Laboratory of Plant
-
·- -· ·-····-··-
--· - · ··-· ·-
�
--
·--··· -· -· ·· . -· ---/ "Sample pHKCI N p K Ca Mg Org. matter
FB I (%) (mg/kg) (mg/kg) (mg/kg) (mg/kg) (%) 0-50cm 7.13 0.647 1 1 5.81 1 0 1 1 .23 7206 872.97 1 3.80 50-\00crn 6.39 1 .567 165.73 462.38 I 1724 \368.48 29.21 FB 2 0-50cm 7. 1 5 1 .234 26.81 7957.4 1 1 304 7733.29 80.95 50-l 00cm 5.80 1 .256 1 9. 1 8 7 1 90.3 1 0670 3978.42 82.76
*FB I =Undisturbed peat; FB 2 =Milled loose peat
Pille Kilngsepp, Mail Kriipsa!u, Toomas Timmusk, Estonia, William Hogland, Sweden
KALMAR ECO-TECH'0 I
Leachate and Wastewater Treatment with High-Tech and Natural systems KALMAR, SWEDEN, November 26-28, 200 1
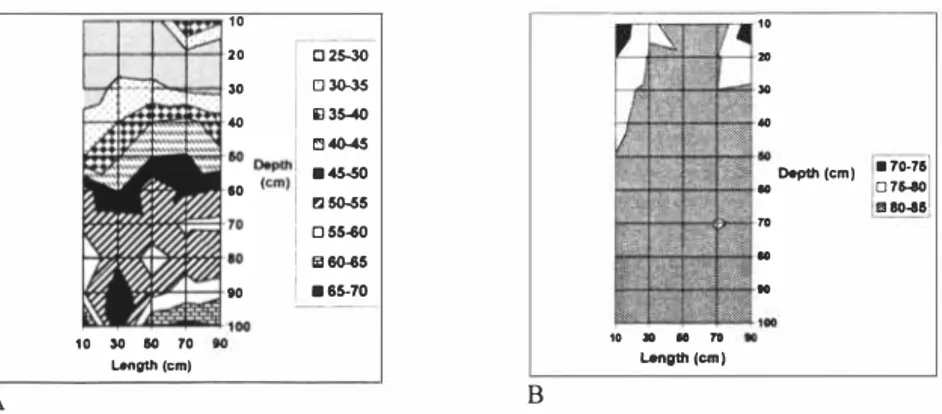
Distribution of leachate
The distribution of leachate in the both peat bodies is shown in Fig. 4, A and B. Results of experiment show that moisture content in FB I has not changed significantly and increases gradually by increasing the depth of filter, It could be assumed that when the filter was taken as natural peat land in the beginning of the test, it already contained the moisture close to its field capacity. Moister content in FB2 has increased during the test, from value of 64 to value of 80-85, The distribution of leachate has been more homogeneous in FB2 than in FB I. The flow rate of leachate in filters was faster in FB2 than FB I, This might be due to differences in density of peat in filters; Peat filter taken as natural peat land was denser than milled loose peat from Umbusi peat bog.
1 0 20
..
□ 25-30 □ 30-35..
E 35-40 0 40-45 ■'5-50 rJ 50-55 0 5� lil &0-65 ■ 65-70 50..
10..
80 70 Length (cm) A Langtt, (cm )Figure 4. Moisture content in FBJ (A = undisturbed peat) and FB2 (B= loose peat) after experiment.
CONCLUSIONS
The result of experiment show that BOD level was reduced after 1 1 days of continuos aeration. However, longer aeration is required for decreasing the COD level in this type of leachate, since the reduction in the level of the COD was not significant after 1 1 days. However, aerobic treatment may be insufficient due to improper BHT:N:P ratio. Better reduction of total and ammonia-nitrogen was achieved by filtrating leachate through undisturbed peat filter body (FB 1 ) than through loose peat filter (FB2). Effluent from FB 1 contained higher concentration of nitrate than effluent from FB2. The pH of the leachate decreased significantly during the filtration process by FB2.
The flow rate of leachate in filters was faster in FB2 than FB I. The analyses of moisture content in FB-s indicate that distribution of leachate has been more homogeneous in FB2 than FB 1 , and faster flow rate on peat filter has not caused creation the channels in FB2. Comparison of the composition of the peat initially and after conduction of study shows that the compositions of both types of peat in filters have changed during the experiment. Generally, the purification of leachate by peat filters depends on several factors, such as initial composition of peat ( content of organic matter, decomposition rate, concentration of Ca, Mg, value of pH etc) and characteristics of peat filter (such as density, moisture content etc),
Pille Kangsepp, Mait Kriipsalu, Tootnas Timmusk, Estonia, William Hogland, Sweden
B 10
,.
.. ..
• 70-75..
Deptl1 (cm) 1 D 7MO 11 80-&5..
70..
..
..
71 10 297KALMAR ECO-TECH'0I
Leachate and Wastewater Treatment with High-Tech and Natural systems KALMAR, SWEDEN, November 26-28, 200 I
Authors agree with Allen and co-workers (Allen et al, 1997) that there are inherent difficulties in comparing adsorption studies out on organic materials like peat and soil due mainly to their heterogeneity and varying physical and chemical properties. Therefore additional investigations have to carry on in order to understand the purification mechanisms.
ACKNOWLEDGEMENTS
The authors give grateful thanks for technical and laboratory support to Laboratory of Tartu Wastewater Treatment Plant, SAB Ltd, Laboratory of Plant Biochemistry of Estonian Agricultural University. The authors want to express their gratitude to Mr Jtiri Haller, Ms Aija Kosk, Mr Tonu Salu, Ms Mai Olesk, Mr Marek Joost for their support during the experiments.
REFERENCES
I. Allen, S.J., Whitten, L.J., Murray, M., Duggan, 0., Brown, P. ( 1 997). The Adsorption of Pollutants by Peat, Lignite and Activated Chars. J.Chem. Technol. Biotechnol, 68, pp. 442-452. (In: McNevin, D., Barford, J. ( I 998). Modelling adsorption and biological degradation of nutrients on peat. Biochemical Engineering Journal 2, pp. 2 1 7-228.
2. Bohn, H.L., McNEal, B.L., O'connor, G.A. ( 1 979) Soil Chemistry. A Wiley-Interscience publication. John Wiley & Sons. New York, 329 pp.
3. Bothe, H., Trebst, A. (1981). Biology of Inorganic Nitrogen and Sulphur. Springer, Berlin, 1 98 1 . (In: McNevin, D., Barford, J. (1 998). Modelling adsorption and biological degradation of nutrients on peat. Biochemical Engineering Journal 2, pp. 2 1 7-228. 4. Brown, P.A., Gill, S.A. and Allen, S.J. (2000) Metal Removal from Wastewater using
Peat. Review Paper, Wat. Res., Vol.34, No. 1 6. pp. 3907-39 1 6.
5. Cantrell, R. L. (1 992). Peat. Mineral Yearbook.U.S.Dept.of Interior, Bureau of Mines.
Washington, D.C. (http://www.peatmoss.com/hortprog I .html, 23. 1 0.200 1 ).
6. Dissanayake, C.B., and Weerasooriya, S.V.R. ( 1 98 1). Peat as a Metal-Trapping Material in the Purification of Industrial Effiuents, Research report. Intern. J. Environmental Studies, Vol. I 7, pp.233-238.
7. Estonian Peat Association (1 998) General information. (http://www.ee/turbaliit/general.htm). 08.09.200 1 .
8 . Statistical Office of Estonian (200 1 ). Statistical Database. Extraction of mineral resources. (http ://gatekeeper.stat.ee: 8000/px-web.200 l /Dialog/Saveshow .asp.
9. Hedstrom, A. (2000). Nitrogen Conversion Processes when Treating Wastewater in Soil Systems - the Importance of Ammonium Adsorption. Atten, 56, pp. 85-95.
1 0. Lance, J.C. ( 1 972). Nitrogen Balance in Soil Columns Intermittently Flooded with Secondary Sewage Effluent. Journal of environmental quality, 1 :2, pp. 1 80- 1 86. (In:
Hedstrom, A. (2000). Nitrogen conversion processes when treating wastewater in soil systems - the importance of ammonium adsorption. Atten, 56, pp. 85-95.
I I. McNevin, D., Barford, J. (1 998). Modelling Adsorption and Biological Degradation of Nutrients on Peat. Biochemical Engineering Journal 2, pp. 2 1 7-228.
1 2. Orru, M. (1 992). Eesti turbavarud, RE Eesti Geoloogiakeskus, Tallinn. (In Estonian).
1 3. Orru, M. ( 1 995). Eesti turbasood. Teatrnik. Tallinn (In Estonian).
14. Robertson, R.A. (1 994). Nature and Distribution of Peat and Peatlands. International Peat Society. Conference papers. International Peat Conference. Brussels, March, 1 994.
15. Spinosa, L., Brunetti, A., Lore, F., and Anonacci, R. ( 1 99 1). Combined Treatment of Leachate and Sludge; Lab Experiments. Proceedings of the Third International Landfill
Pille Kangsepp, Mait Kriipsalu, Toomas Timmusk, Estonia, William Hogland, Sweden
Leachate and Wastewater Treatment with High-Tech and Natural systems KALMAR, SWEDEN, November 26-28, 2001
Symposium, Cagliari, Italy, 1 99 1 , T.H. Christensen, R. Cossu, and R. Stegmann eds., Vol. I, pp.96 1 -968.
1 6. Stegmann, R. and Ehrig, H-J. ( 1 989). Leachate Production and Quality - Results of Landfill Process and Operation, Proceedings of the Second International Landfill Symposium. Porto Conte, Italy, T.H. Christensen, R. Cossu, and R. Stegmann eds. Vol.eI, pp. 1 - 1 6.
1 7. Soukand, 0., Tungel, R. and Tenno, T. ( 1 996). Comparison of Heavy Metal Adsorption Properties on Natural and Granulated Peat on the Example of Cadmium, Proceedings of the Estonian Acad. Sci. Chem., Vol.45, Nr ¾, pp. 1 23- 1 29.
1 8. Toomel, H. ( 1 997). Plirnu priigila monitooringu, keskkonnakaitsealase olukorra parandamise ja priigila sulgemise kava koostamine. 00 RUU aruanne. (Tellija: Plirnu Linnavalitsuse Kommunaalamet. Leping: R-24.) Unpublished. 8 1 p.
19. US Environmental Protection Agency (US EPA), ( 1 975). Process Design Manual for Nitrogen Control, Washington DC. (In: McNevin, D., Barford, J. ( 1 998). Modelling adsorption and biological degradation of nutrients on peat. Biochemical Engineering Journal 2, pp. 2 1 7-228).
20. UTVIK Report, ( 1 989). (med bilagor), SYSA V AB, Utvecklad deponeringsteknik inom Spillepengens avfallsupplag (in Swedish). In: Thorneby, L. (200 1 ) Treatment of Waste Waters with emphasis on reverse osmosis and wetlands, PhL Thesis, Department of Analytical Chemistry. Lund University.
2 1 . Van Denmark, P.J. Batzing, B.L. ( 1 987). The microbes: An Introduction to their Nature and Importance, Benjamin/Cummings, California. (In: McNevin, D., Barford, J. ( 1 998). Modelling adsorption and biological degradation of nutrients on peat. Biochemical Engineering Journal 2, pp. 2 1 7-228.
22. Viraraghavan, T. and Dronarnraju, M.M. ( 1 993). Removal of Copper, Nickel and Zinc from Wastewater by Adsorption using Peat. J. Environ. Sci. Health, A28 ( 6), pp. 1 26 1 -1 276.
23. Viraraghavan, T. and Rao, G. A. K. ( 1 992). Adsorption of Cadmium and Chromium from Wastewater by Peat. Proceedings of the 47th Purdue Industrial Waste Conference, Lewis
Publishers, Inc., Chelsea, Michigan 48 1 1 8,USA, pp.678-688.
24. Warith, M. ( 1 996). Evaluation and Design of a Peat Filter to attenuate Landfill Leachate.
Water Qual. Res. J. Canada, Vol.3 1 , No. I, pp.65-83.
Pille Klingsepp, Mait Kriipsalu, Toomas Timmusk, Estonia,