https://doi.org/10.15626/MP.2018.935 Article type: Commentary
Published under the CC-BY4.0 license
Open and reproducible analysis: Yes Open reviews and editorial process: Yes
Preregistration: N/A
Analysis reproduced by: Tobias Mühlmeister All supplementary files can be accessed at OSF: https://doi.org/10.17605/OSF.IO/AYUXZ
An Extended Commentary on Post-Publication
Peer Review in Organizational Neuroscience
Guy A. Prochilo*
University of Melbourne
Stefan Bode
University of Melbourne
Winnifred R. Louis
University of Queensland
Hannes Zacher
Leipzig University
Pascal Molenberghs
Institute for Social Neuroscience
AbstractWhile considerable progress has been made in organizational neuroscience over the past decade, we argue that critical evaluations of published empirical works are not being conducted carefully and consistently. In this ex-tended commentary we take as an example Waldman and colleagues (2017): a major review work that evaluates the state-of-the-art of organizational neuroscience. In what should be an evaluation of the field’s empirical work, the authors uncritically summarize a series of studies that: (1) provide insufficient transparency to be clearly un-derstood, evaluated, or replicated, and/or (2) which misuse inferential tests that lead to misleading conclusions, among other concerns. These concerns have been ignored across multiple major reviews and citing articles. We therefore provide a post-publication review (in two parts) of one-third of all studies evaluated in Waldman and colleague’s major review work. In Part I, we systematically evaluate the field’s two seminal works with respect to their methods, analytic strategy, results, and interpretation of findings. And in Part II, we provide focused reviews of secondary works that each center on a specific concern we suggest should be a point of discussion as the field moves forward. In doing so, we identify a series of practices we recommend will improve the state of the literature. This includes: (1) evaluating the transparency and completeness of an empirical article before accepting its claims, (2) becoming familiar with common misuses or misconceptions of statistical testing, and (3) interpreting results with an explicit reference to effect size magnitude, precision, and accuracy, among other recommendations. We suggest that adopting these practices will motivate the development of a more replicable, reliable, and trustworthy field of organizational neuroscience moving forward.
Keywords: organizational neuroscience, confidence intervals, self-corrective science, effect sizes, null hypothesis
sig-nificance testing (NHST), parameter estimation, Pearson correlation, post-publication peer-review, reporting stan-dards.
Note: Correspondence concerning this article should be addressed
to Guy A. Prochilo, Melbourne School of Psychological Sciences, University of Melbourne. E-mail:guy.prochilo@gmail.com
Introduction
Organizational neuroscience is a domain of research that draws heavily on social and cognitive neuroscience traditions, but which examines specifically how neuro-science can inform our understanding of people and or-ganizing processes in the context of work (Waldman, Ward, & Becker, 2017). Marked progress has been made at the theoretical level in the decade since its inception. For example, this has included a maturing discussion on the ethics, reliability, and interpretation of neuroscience data and how this applies to organiz-ing behavior and the workplace (Healey & Hodgkin-son, 2014; Lindebaum, 2013, 2016; Niven & Boorman, 2016). However, the same level of progress has not been made with respect to careful and consistent critical evaluation of empirical works beyond the point of initial publication. The standards within psychological science (including organizational behavior research) are chang-ing to reflect concerns over the transparency of report-ing practices, appropriate use of inferential statistics, and the replicability of published findings (Cumming, 2008, 2014; Cumming & Maillardet, 2006; Nichols et al., 2016; Nichols et al., 2017; Simmons, Nelson, & Si-monsohn, 2011; Wicherts et al., 2016). In this extended commentary, we argue that scholars of organizational neuroscience are not considering these implications of-ten enough, especially in major reviews of the literature. This commentary takes as an example the major re-view piece by Waldman and colleagues (2017) pub-lished in Annual Review of Organizational Psychology
and Organizational Behavior. In this article, the authors
critically evaluate the state-of-the-art of organizational neuroscience, including its methods and findings, and provide recommendations for investing in neuroscience-informed practices in the workplace. However, in what should be an evaluation of the field’s empirical work, the authors uncritically summarize a series of studies that: (1) provide insufficient transparency to be clearly understood, evaluated, or replicated, and/or (2) which misuse inferential tests that lead to misleading conclu-sions, among other concerns. It is customary for scien-tists and practitioners to cite information from the most recent review pieces, meaning that such reviews (espe-cially Annual Reviews) and the references cited therein can wield a disproportionate impact on the future of a field of study. Omission of satisfactory post-publication review in the above work is therefore unfortunate, and may motivate poor decisions that waste scarce time, ef-fort, and financial resources for both researchers and organizational practitioners alike.
This commentary will not be a systematic review of all studies conducted in organizational neuroscience. Instead, to bring explicit attention to the concerns we
raise above, we provide a focused post-publication re-view of five of the 15 empirical studies critically evalu-ated in Waldman and colleagues (2017). Our commen-tary therefore dissects a full one-third of studies that were deemed methodologically and statistically sound as part of an evidence base for guiding organizational research and practice (see Table 1 for a list of these stud-ies and justification for their selection). Our motivation for this format, in contrast to a general pooling of find-ings via systematic review, is threefold. First, at least two of these studies represent seminal works that are among the most influential and highly cited in the field (see Figure 1 for a citation distribution). Second, these studies present with critical methodological or interpre-tational concerns that have been overlooked in multiple major reviews of the literature. And third, on the basis of these concerns, it is not entirely clear that these stud-ies are being evaluated beyond what is reported in their abstracts by those who cite them. These studies deserve a close and detailed scrutiny and we provide this here.
The primary aim of our commentary is to push the field in a positive direction by encouraging a more crit-ical review of research findings in organizational neu-roscience. In doing so, we seek to promote the de-velopment of a more replicable, reliable, and trustwor-thy literature moving forward1. First, we contextualize
our publication evaluation criteria by discussing what has come to be known as the replication crisis in psy-chological science. While many solutions to this cri-sis have been offered, we focus on two easily imple-mentable criteria that are likely to have a broad im-pact: (1) complete and transparent reporting of empir-ical findings, and (2) statistempir-ical inference that consid-ers the magnitude and precision of research findings be-yond mere statistical significance. Second, we conduct a post-publication review of selected empirical works in two parts. In Part I, we comprehensively and sys-tematically evaluate the fields’ two seminal works with respect to our evaluation criteria. And in Part II, we provide focused reviews of secondary works that each center on a single specific methodological concern that we feel must be a point of discussion as the field moves forward. These concerns are: (1) fMRI statistical anal-yses that preclude inferences from sample to popula-tion, (2) unsubstantiated claims of convergent validity between neuroscience and psychometric measures, and (3) the impact of researcher degrees of freedom on the inevitability of reporting statistically significant results.
1Note: The concerns we discuss in this commentary are in
no way unique to organizational neuroscience. We single out this field, not because it represents a special case, but because we have contributed work to this field (Molenberghs, Prochilo, Steffens, Zacher, & Haslam, 2017).
Table 1
Publications selected for post-publication peer review
Publication Justification for selection
Seminal Works
1 Peterson et al. (2008) • This study represents one of the earliest works to apply neuroscience methods to organizing phenomena. It has also been described as the first study do to so following the first theoretical writings in organizational neuroscience (see Ward, Volk, & Becker, 2015). It is one of the most highly cited publications of all those evaluated in Waldman and colleagues’ (2017) review (N = 98) and is discussed in most reviews of the literature since its publication (e.g., Butler, O’Broin, Lee, & Senior, 2015; Waldman & Balthazard, 2015; Waldman, Balthazard, & Peterson, 2011b; Ward, Volk, & Becker, 2015). On the basis of precedence, citations, and inclusion in multiple reviews, this study would be considered seminal.
2 Waldman et al. (2011a) • This study is the most highly cited publication of all those evaluated in Wald-man and colleagues’ (2017) review (N = 177) and is included in most re-views of the literature (e.g., Ashkanasy, Becker, & Waldman, 2014; Becker & Menges, 2013; Becker, Volk, & Ward, 2015; Waldman & Balthazard, 2015; Waldman, Balthazard, & Peterson, 2011b; Waldman, Wang, & Fenters, 2016; Ward, Volk, & Becker, 2015). It also cited in several systematic reviews (e.g., Butler, O’Broin, Lee, & Senior, 2015; Nofal, Nicolaou, Symeonidou, & Shane, 2017). It is the seminal work of the field.
Secondary Works
1 Boyatzis et al. (2012) • This study represents one of the earliest fMRI studies of the field, and is a highly cited work (N = 99). It has also been used as part of the evidence base for guiding research and organizational practice decisions in extended theory pieces (e.g., coaching; Boyatzis & Jack, 2018). This study raises an important methodological concern that we suggest must be a point of discussion among scholars: fMRI analyses that preclude inferences from sample to population.
2 Waldman et al.
(2013a, 2013b, 2015)
• This publication represents a single empirical study that has been reported through conference proceedings (Waldman et al., 2013a), as an unpublished pre-print (Waldman et al., 2013b), and within a textbook chapter that dis-cusses it at length (Waldman, Stikic, Wang, Korszen, & Berka, 2015). Cumu-latively, these publications have received 32 citations. We include this study for evaluation for several reasons. First, the reporting of this study across multiple venues makes it challenging for scholars to clearly understand and critically evaluate the work. Second, this work is discussed in several major reviews of the literature, and within the textbook that adopts the field’s name:
Organizational Neuroscience (Waldman & Balthazard, 2015). This gives the
impression that the work is of high quality. And finally, this study raises an important methodological concern that we suggest must be a point of discus-sion among scholars: unsubstantiated claims of convergent validity between neuroscience and psychometric measures.
3 Kim and James (2015) • This study represents one of the most recent fMRI studies conducted in the field and has received 6 citations. While this is low with respect to other works, it is discussed at length in Waldman and colleagues’ (2017) major review, and is represented as high quality work. It also raises a specific methodological concern that we suggest must be a point of discussion among scholars: the impact of researcher degrees of freedom on the inevitability of reporting sta-tistically significant results.
Note: Citations were obtained from Google Scholar on Jan 23, 2019. The above studies represent one-third of all studies
E
D
C
B
A
0 10 20 30 40 50 60 70 80 90 100 110 120 130 140 150 160 170 180Citation Count
Figure 1. Dot plot with rotated probability distribution on each side of the data showing the number of Google
Scholar citations for all 15 empirical studies evaluated in Waldman and colleagues (2017). Citations range from 6 to 177 (M = 74.7, SD = 49.62). The publications under review in this commentary are represented by filled dots and an associated label: (A) = Kim and James (2015); citations = 6; (B) = Waldman et al. (2013a, 2015); cumulative citations = 32; (C) = Peterson et al. (2008); citations = 98; (D) = Boyatzis et al. (2012); citations = 99; (E) = Waldman et al. (2011a); citations = 177. The vertical line marks the mean. With respect to citation impact, these studies capture a cross-section of all studies that were subject to review by Waldman and colleagues (2017). Data were acquired from Google Scholar on Jan 23, 2019.
Publication evaluation criteria
Criteria I: Completeness and transparency of report-ing practices
Science has been described as a cumulative and self-corrective process (Merton, 1973; Popper, 1962). Pub-lished empirical findings are not taken as unquestion-able fact, but rather, all findings are subject to verifica-tion through systematic critical evaluaverifica-tion and replica-tion. In doing so, these efforts may provide support that a finding is credible, or that it is wrong, and that the scientific record should be corrected. However, there are growing concerns that a large number of published empirical findings in psychological science are false or at least misleading (Benjamin et al., 2018; Button et al., 2013; Cumming, 2014; Ioannidis, 2005, 2012; Leslie, George, & Drazen, 2012; Munafò et al., 2017; Nelson, Simmons, & Simonsohn, 2018; Simmons et al., 2011; Wicherts et al., 2016). Empirical findings are failing to replicate (Camerer et al., 2018; Klein et al., 2018; Open Science Collaboration, 2015), and these failed replica-tions appear to be invariant to the context and culture in which the replication is attempted (e.g., Klein et al., 2018). This alarming problem has become known as the replication crisis, and there is now open discussion that the self-correcting ideal is not performing as well
as it should across different areas of science (Ioannidis, 2012).
There are many impediments to self-correction in psychological science, including publication bias, selec-tive reporting of results, and fabrication of data, among others. However, one of the most basic impediments for evaluating published findings as part of a self-corrective science is that researchers do not consistently provide a complete and transparent report of how exactly their research has been conducted and analyzed (Appelbaum et al., 2018). In this commentary we will argue that this has been true of at least some organizational neu-roscience work, and that it is particularly prevalent in the seminal works that appear in multiple reviews of the literature.
Complete and transparent reporting is key to system-atically communicating what was done in any empirical study. There are multiple systematized reporting stan-dards in psychological science that target various sub-disciplines and types of experimental design. For ex-ample, the Consolidated Standards of Reporting Trials (CONSORT) is a 25-item checklist that standardizes the way in which authors prepare reports of randomized controlled trial findings (www.consort-statement.org). The OHBM Committee on Best Practice in Data Analy-sis and Sharing (COBIDAS) guidelines describes how to
Table 2
Outline of publication evaluation criteria
Evaluation Criteria Description
Method
Data collection • Describe methods used to collect data.
Quality of measurements • Describe the quality of the measurements (e.g., the training of data collectors). Psychometric
prop-erties of instruments
• Describe the reliability and validity of the measurement instruments (e.g., in-ternal consistency for composite scales; inter-rater reliability for subjectively scored ratings; etc.).
Data diagnostics • Describe the methods used for processing the data (e.g., defining and dealing with outliers; determining if test assumptions are satisfied; and the use of data transformations, if required).
Analytic strategy
Inferential statistics • Describe the analytic strategy for how inferential statistics were used to test each hypothesis.
Results
Statistics and data analysis • Report descriptive statistics that are relevant to interpreting data (e.g., mea-sures of central tendency and dispersion).
• Report appropriate inferential statistics obtained from statistical tests of each hypothesis, including exact p values if null hypothesis significance testing (NHST) has been used.
• Report effect size estimates and confidence intervals on estimates, where pos-sible.
• Report whether statistical assumptions for each test were satisfied.
Interpretation of findings
Discussion • Provide an interpretation of results that is substantiated by the data analysis strategy and other aspects of the study (e.g., adequacy of sample size; sampling variability; generalizability of results beyond the sample; etc.).
• Consider specifically effect magnitude, accuracy, and precision when interpret-ing results.
Note: These criteria were adapted from the JARS-Quant guidelines with a specific focus on methods, results, and interpretation
of findings. The JARS-Quant guidelines can be found in full in Appelbaum et al. (2018).
plan, execute, report, and share neuroimaging research in a transparent fashion (Nichols et al., 2017; Nichols et al., 2016). And the APA Working Group on Journal Arti-cle Reporting Standards (JARS-Quant) covers reporting of all forms of quantitative empirical work, regardless of subdiscipline (Appelbaum et al., 2018).
The JARS-Quant have been designed with the intent of being a gold standard for reporting quantitative re-search across all of the psychological sciences. This includes research incorporating neuroscience methods such as organizational neuroscience. Therefore, we have adapted a subset of these guidelines to system-atically guide our post-publication review of seminal works (see Table 2). These guidelines pertain to criteria that guide the reporting of methods, results, and inter-pretation of findings. These are elements of research work that are essential for enabling empirical claims to be clearly understood and evaluated by readers, and to allow findings to be replicated with reasonable accuracy.
Criteria II: Appropriateness of statistical inferences
The cause of the replication crisis is multifaceted, and inadequate reporting practices are just a single factor among many contributing to the failure of self-correction in psychological science. A growing number of scholars are also raising concerns that a key theme in this crisis is an overreliance on the null hypothesis significance testing (NHST) approach when conducting research and interpreting results (e.g, Calin-Jageman & Cumming, 2019; Cumming, 2014; Peters & Crutzen, 2017). That is, researchers have traditionally prioritized all-or-none decisions (i.e., a finding is either statistically significant or non-significant) to the exclusion of infor-mation that describes the magnitude and precision of a finding, or whether that finding is likely to replicate. For these reasons, findings that are highly variable, impre-cise, or which have been selectively reported (or ma-nipulated) based on all-or-none decision criteria have
flourished. And these findings are not replicating. We believe similar concerns regarding NHST are influenc-ing the quality of organizational neuroscience.
The NHST approach has been well described else-where (see Frick, 1996; Nickerson, 2000). Briefly, an effect (or effect size) describes a quantification of some difference or a relationship that is computed on sample data. As one example, this may include the magnitude and direction of a Pearson correlation coefficient (r). In the NHST tradition, a researcher begins by stating a pre-diction regarding the direction of an effect that they be-lieve to be true of the population from which they are sampling. This is then tested against a null hypothesis which specifies that the true population effect may ac-tually be zero. This test yields a p value that quantifies the probability of obtaining a test statistic (e.g., t) of a given magnitude or greater when sampling from a pop-ulation where the null hypothesis is true. In statistical terminology, this is the probability of making a Type I error. In order to minimize such errors, a significance level called alpha (α) is used as the threshold for an all-or-none decision. If the obtained p value is less than a prespecified α level, we consider ourselves sufficiently confident to assert that an effect is statistically signifi-cant and different from zero. In psychological science this threshold by convention is .05, which entails that in the long-run (i.e., after many replications of a study) we are only willing to accept Type I errors at most 5% of the time.
One of the major criticisms of this approach is that it simply does not provide researchers with the full in-formation they need to describe the relationship be-tween an independent and dependent variable (Calin-Jageman & Cumming, 2019; Cumming, 2014; Cohen, 1990). NHST and p values only provide evidence of whether an effect is statistically significant, and of the direction of an effect. Scholars also cite concerns that NHST and its associated p values are too often miscon-strued or misused by its practitioners, thereby leading to claims that are not substantiated by the data (e.g., Gelman & Stern, 2006; Nickerson, 2000; Nieuwenhuis, Forstmann, & Wagenmakers, 2011; McShane, Gal, Gel-man, Robert, & Tackett, 2019). As an alternative (or adjunct) to NHST, proponents of what has been called
parameter estimation (Kelley & Rausch, 2006; Maxwell,
Kelley, & Rausch, 2008; Woodson, 1969) or the New
Statistics (Calin-Jageman & Cumming, 2019; Cumming,
2014) have argued that inference should focus on: (1) the magnitude of a finding through reporting of effect size, (2) the accuracy and precision of a finding through reporting of confidence intervals on an effect size, and (3) an explicit focus on aggregate evidence through meta-analysis of multiple studies.
On an individual study basis, the parameter estima-tion approach yields an identical all-or-none decision to that provided by p values. However, the focus shifts from a dichotomous all-or-none decision to information regarding the magnitude of an effect, and its accuracy and precision as quantified by confidence intervals.
Accuracy refers to the long run probability that a con-fidence interval of a given length will contain the true population value. For example, a 95% confidence inter-val is an interinter-val of inter-values that, if a study were to be repeated many times with different samples from the same population and under the same conditions, the true population value would be included in this interval 95% of the time. It is therefore plausible (although, not certain) that any particular 95% confidence interval will contain the true population parameter. Precision refers to a measure of the statistical variability of a parameter, and is quantified by the width of a confidence interval (or, alternatively, the half width of the confidence inter-val: the margin of error). For example, a narrow 95% confidence interval is said to have high precision in that there are a limited range of plausible values which the population parameter could take. Conversely, a wide 95% confidence interval is not very precise because the population parameter can take on a very wide range of plausible values.
Some scholars have advocated completely abandon-ing NHST and p values in favor of a parameter es-timation approach to statistical inference (e.g.,
Calin-Jageman & Cumming, 2019; Cumming, 2014). We
don’t go so far. Instead, in the style of Abelson (1995), we believe that all statistics (including p values, confi-dence intervals, and Bayesian statistics, among others) should be treated as aids to principled argument. How-ever, to limit the scope of our commentary, our evalu-ations will have an explicit focus on effect size magni-tude and, as an indication of accuracy and precision, the confidence intervals on these effects. In doing so, we will argue that NHST and p values have been mis-used across many organizational neuroscience works, and that reviewers of this literature too often accept sta-tistical analyses and interpretations of data uncritically (see Table 2 for our full evaluation criteria).
Post-publication peer review
In the following sections we provide a concise overview of each study listed in Table 1. In Part I, we follow this by a systematic post-publication review of the methods, analytic strategy, results, and interpreta-tion of findings of the fields’ two seminal works. In Part II, our post-publication review is focused (and re-stricted) to specific concerns in secondary works that we suggest must be a point of discussion as the field moves
forward. A summary of recommendations for improv-ing post-publication review based on this commentary is given in Table 3.
Part I
Systematic post-publication review of seminal works
Peterson et al. (2008). Neuroscientific Implica-tions of Psychological Capital: Are the Brains of Op-timistic, Hopeful, Confident, and Resilient Leaders Different?
The purpose of Peterson et al. (2008) was to exam-ine the neural basis of psychological capital: a compos-ite trait comprised of hope, resilience, self-esteem, and optimism, and which has been linked to effective lead-ership. Using a sample of 55 business and community leaders, participants were asked to engage in a ‘vision-ing task’, in which they were required to create a spo-ken vision for the future of their business or organiza-tion while EEG measures were recorded. As the authors describe, this visioning task was theorized to evoke an emotional response that is aligned with psychological capital. Expert opinions on the affective behavior wit-nessed during the EEG task were combined with psy-chometric measures of psychological capital and lead-ership, and these measures were used to dichotomize participants as high or low on this trait. Following this, differences in EEG activity were assessed between each group.
The authors reported that analysis of their EEG data revealed that high psychological capital was corre-lated with greater activity in the left prefrontal cortex. This was interpreted as activity associated with greater happiness, as well as having successful interpretation, meaning, construction, and sense-making skills. The authors further reported that low psychological capital was correlated with greater activity in the right frontal cortex and right amygdala. This was interpreted as ac-tivity associated with difficulty in displaying and inter-preting emotions, as well as a greater likelihood to dis-play negative affectivity or avoidance behaviors in social situations. A primary conclusion provided by the au-thors (which has been repeated in subsequent reviews) is that these findings are a demonstration of the impor-tance of emotions in the study of psychological capital. The authors further suggest that future research should look more closely at the role of negative affect (e.g., fear) as a mechanism underlying low psychological cap-ital.
Critical review. The critical evaluation of Peterson et al. (2008) first requires qualification based on the venue in which it has been published. Organizational
Dynamics is a journal that publishes content primarily
aimed at organizational practitioners (e.g., professional managers), and therefore restricts full and transparent reporting of methods, results, and analyses in favor of narrative readability for practitioner audiences (Else-vier, 2018). For this reason, the journal encourages pub-lication of supplementary material (which may include detailed methods and results), as well as sharing of data in data repositories that can be directly linked to the ar-ticle itself. These latter standards may not have been in effect at the time of publication of this early work. In any case, Peterson et al. (2008) does not report any data, or link to any external dataset or supplementary information that can be used to evaluate the content of what is reported. This is problematic because this study has been repeatedly and explicitly cited as an example of high-quality empirical work in almost every review of the literature since its publication (e.g., Butler, O’Broin, Lee, & Senior, 2015; Waldman et al., 2017; Ward, Volk, & Becker, 2015). Because this study is so consistently raised to the status of a high-quality empirical study, Peterson et al. (2008) must be evaluated according to the same standards as any other empirical publication. That is, with adequate post-publication review.
Methods. We first consider the psychometric mea-sures used in this study. The authors claim to have assessed psychological capital using a self-report ques-tionnaire, yet, no information is given regarding what psychological instrument was employed. Furthermore, no information is given regarding the conditions un-der which this instrument was administered, the psy-chometric properties of the instrument, or how data ac-quired from this instrument were processed with respect to outliers or other test assumptions. These same con-cerns relate to the instrument which was used to assess appraisals of participant leadership characteristics. It is also unclear by what process scores on these instru-ments were combined to dichotomize participants into groups that were considered representative of high and low psychological capital. And following this process, it is also unclear by what method the dichotomization was performed. Several possibilities include the mean, median, cut-points based on previous literature, or even selective testing of all quantiles and choosing those that yield the smallest p value in a subsequent inferential test, among others. A further complication is that, in ad-dition to each psychometric measure, the dichotomiza-tion was also based on affective behavior demonstrated during a visioning task. No information is provided re-garding how these ratings were determined, or whether this was implemented correctly. This includes no infor-mation on whether coders had the requisite expertise to perform this task, or to what extent dichotomization
de-cisions were consistent across coders. And no informa-tion is provided on how this informainforma-tion was weighted alongside psychometric measures to perform the group dichotomization.
We now turn our attention to the EEG measures. The authors provide no information regarding: (1) how EEG data were recorded (e.g., number of channels, electrode configuration, reference electrodes, and sampling rate), (2) how the data were pre-processed (i.e., how arte-facts from eye movements, blinks, muscle artearte-facts, and sweating were identified and removed if necessary, or what filters were applied to remove frequencies of no interest), and (3) whether and how the experimenters controlled for typical artefacts resulting from bodily movements during the experiment. The latter is partic-ularly important given that participants were instructed to talk while EEG recordings were obtained. Movement during EEG recordings can create substantial artefacts (Urigüen & Garcia-Zapirain, 2015).
Altogether, it is extremely difficult for readers to eval-uate whether any of the reported measures or methods of data processing were valid, reliable, or implemented correctly. The authors do not provide sufficient method-ological detail to the standard that is required of scien-tific reporting. Because of this, it is unlikely that Peter-son et al. (2008) could be replicated with any reaPeter-son- reason-able level of accuracy.
Analytic strategy. The authors describe that they compared the brain maps of participants who were cat-egorized as high versus low psychological capital. How-ever, they do not specify what analytic strategy was used to perform this test. It is therefore not possible for readers to evaluate whether this analytic strategy was appropriate or implemented correctly. A further concern relates to use of dichotomization itself. Di-chotomization of continuous data reduces the efficiency of experimental design, and can lead to biased conclu-sions that do not replicate across different samples (Alt-man & Royston, 2006; MacCallum, Zhang, Preacher, & Rucker, 2002; Royston, Altman, & Sauerbrei, 2006; Senn, 2005).
Results. The authors report no statistics. That is, the authors report no measures of central tendency, no measures of dispersion, no inferential statistics, no mea-sures of effect size, no meamea-sures of accuracy or preci-sion, and do not report on whether statistical assump-tions were satisfied. It is therefore not possible for read-ers to evaluate any empirical claims on the basis of test statistics.
Interpretation of findings. Peterson et al. (2008) report two main findings: (1) greater activity in the left prefrontal cortex of participants with high psychologi-cal capital was indicative of happiness, and (2) greater activity in the right prefrontal cortex and amygdala of
participants with low psychological capital was indica-tive of negaindica-tive affectivity. This interpretation, however, relies heavily on reverse inference and a highly modular interpretation of regional brain function (for discussion, see Poldrack, 2006). The prefrontal cortex is an incred-ibly large and diverse region, and is involved in a va-riety of executive functions, including, but not limited to: top-down regulation of behavior, generating mental representations, goal-directed behavior, directing atten-tion, reflecting on one’s intentions and the intentions of others, and regulation of the stress response (Arnsten, Raskind, Taylor, & Connor, 2015; Blakemore & Robbins, 2012; Goldman-Rakic, 1996; Robbins, 1996). Similarly, the amygdala is presently considered a complex and di-verse structure that is involved in emotion regulation, motivation, and rapidly processing sensory information of both positive and negative valence (for review, see Janak & Tye, 2015). These regions support functions that lack the specificity to be decomposed into the inter-pretations provided by the authors, particularly with re-spect to the methods and analytic strategy that was em-ployed. Additionally, because EEG mainly detects sig-nals originating from sources close to the scalp, activity of deep brain structures such as the amygdala cannot be detected without sophisticated source localization anal-ysis (Grech et al., 2008). It is not clear that this localiza-tion analysis has been conducted, and had it been con-ducted, whether it would be possible to localize the sig-nal to the amygdala specifically. And fisig-nally, effect size magnitude, accuracy, and precision are not given any consideration. Altogether, the interpretation provided by Peterson et al. (2008) is not substantiated by their methods and analytic strategy. Subsequent claims re-garding the importance of emotion and negative affect in psychological capital may therefore be misleading or entirely false.
Summary. Peterson et al. (2008) lacks an ade-quately transparent account of what was conducted in their empirical study for it to be clearly understood, evaluated, or replicated with reasonable accuracy. It is a sobering reflection on the field that this work has been cited 98 times in the Google Scholar database with little discussion of what are severe and extreme limitations. It is even more sobering that it has been referenced in almost every major review of the literature since its pub-lication without considering these limitations. Indeed, these limitations are so severe and manifest that it is incomprehensible any reasonable scholar is reading this work before citing it.
In the interest of a self-corrective and cumulative sci-ence, we recommend that the findings and conclusions by Peterson et al. (2008) should not be repeated as part of the evidence base for organizational neuroscience in
any future literature reviews. Furthermore, given that this is a highly cited and discussed work in the current literature, we also call on the authors to amend their reports following the full JARS-Quant guidelines, and to publish their data and methods openly to allow for re-analysis.
Waldman et al. (2011a). Leadership and Neuro-science: Can We Revolutionize the Way That Inspi-rational Leaders Are Identified and Developed?
Waldman et al. (2011a) is an EEG study that in-vestigated the neural basis of inspirational leadership, which is a form of leadership that is implicated in desir-able organizational outcomes. In a sample of 50 busi-ness leaders, participants were asked to engage in a ‘visioning task’ while undergoing EEG assessment. Vi-sion statements articulated by each leader were coded on a continuum from non-socialized/personalized (rat-ing of ‘1’: self-focused and self-aggrandiz(rat-ing) to social-ized (rating of ‘3’: collective-oriented with a positive focus). Visions higher in socialized content were con-sidered to be demonstrative of inspirational leadership. Additionally, three to five followers of each leader (e.g., colleagues or employees), respectively, were asked to rate how inspirational their leader was based on two subscales of the Multifactor Leadership Questionnaire (Bass & Avolio, 1990). The subsequent analysis was re-stricted to a measure of coherence in the high-frequency beta rhythm above the right frontal cortex. As the au-thors describe, this measure may have theoretical impli-cations for emotion regulation, interpersonal communi-cation, and social relationships.
The obtained EEG and behavioral data were analyzed through a correlation analysis. Right frontal coherence was positively correlated with socialized vision content coding (r = .36, p < .05), and follower perceptions of inspirational leadership were positively correlated with the socialized vision content coding (r = .39, p < .01). However, coherence was unrelated to follower percep-tions of inspirational leadership (r = .26, p < .10). Based on these data the authors draw two main claims. First, they assert that these data indicate their neuro-physiological measure of inspirational leadership was more strongly related to an explicit inspirational lead-ership behavior (i.e., socialized content in vision cre-ation) than to an indirect measure made through fol-lower perceptions of inspirational leadership. This dif-ference in magnitude of correlations was considered in-dicative of a causal mechanistic chain: right frontal co-herence forms the basis of socialized visionary commu-nication, which in turn, builds follower perceptions of inspirational leadership. And second, the authors claim that the correlation between coherence and socialized
vision ratings represent a meaningful, neural distinc-tion between leaders who espouse high versus low vi-sionary content. Specifically, they argue that this has implications for leadership development. The particu-lar example discussed by the authors relates to targeted training through EEG-based neurofeedback (i.e., use of an operant conditioning paradigm with real-time EEG feedback). Here, they contend that neurofeedback may be used to enhance ideal brain states associated with effective leadership, such as right frontal coherence.
Critical review. As in Peterson et al. (2008), the critical evaluation of Waldman et al. (2011a) requires qualification based on the venue through which it has been published. The Academy of Management
Perspec-tives publishes empirical articles that are aimed at the
non-specialist academic reader (Academy of Manage-ment, 2018). For this reason, full and transparent re-porting of key aspects of empirical work are sometimes eschewed in favor of readability to the non-specialist au-dience. However, Waldman et al. (2011a) is potentially the most influential work in all organizational neuro-science (see Table 1; Figure 1). Therefore, this publi-cation deserves a comprehensive evaluation of its meth-ods, results, analytic strategy, and claims.
Methods. We first consider the psychometric mea-sures. The authors report that perceptions of inspira-tional leadership were obtained from three to six follow-ers of each participant using the Multifactor Leadfollow-ership Questionnaire. The authors also describe that an over-all measure of inspirational leadership was computed by summing these responses, which is a practice they describe is consistent with prior research. A measure of internal consistency is also provided, which demon-strated high scale reliability (i.e., α = .91). However, the authors do not provide a description of data diag-nostics. For example, it is unknown how outliers in the data were identified, whether or not they were re-moved (and by what method they were rere-moved), or how data were to be treated if it did not meet statis-tical test assumptions. The method by which partici-pants were coded on the socialized vision rating scale is also unclear. While the authors describe the criteria by which two expert coders categorized participants, no information is provided on how the coders were trained, or the extent to which there was inter-rater agreement between the coders.
Turning our attention to the EEG measures, the au-thors report the that the 10/20 system has been used, the number of electrodes, and the three electrode lo-cations specific to their analysis. However, there is no information regarding the sampling rate, reference elec-trodes, or of the general setup. This includes a lack of information on fixation and movement control, and if
none were used, how the impact of potential artefacts on the EEG signals have been accounted for. This issue is particularly important given that EEG was recorded while participants were engaged in an active task. As described previously, movement during EEG can cause substantial artefacts. There is also no information pro-vided relating to pre-processing and the use of filters.
Altogether, Waldman et al. (2011a) report a greater depth of information than Peterson et al. (2008). How-ever, Peterson et al. (2008) sets a low standard. Wald-man et al. (2011a) requires further detail for an ad-equate evaluation of the validity and reliability of its reported methods. It may be possible to replicate this method, but the accuracy with which the replication would be conducted may be inadequate.
Analytic strategy. The authors describe that they focused on coherence between three electrodes in the right frontal region of the brain. However, the analytic strategy is not explicitly described and must be inferred from a summary of their findings. Here, coherence data were extracted and subjected to a correlation analysis with ratings of inspirational leadership and socialized vision content coding. The authors do not report the specific correlation analysis that was conducted (i.e., Pearson correlation, Kendall rank correlation, or Spear-man correlation). However, the authors use the nota-tion for Pearson correlanota-tion (r), and computanota-tion of ex-act p values using Fisher’s method (see Interpretation) are consistent with those reported in their publication. It can therefore be inferred that the authors have sub-jected their data to Pearson correlation under the as-sumption of bivariate normality and no bivariate out-liers. Although, the authors do not report whether these latter statistical assumptions were satisfied. Altogether, the lack of transparency of the analytic strategy makes it difficult to evaluate whether it was appropriate or im-plemented correctly.
Results. The authors do not report descriptive statistics (i.e., central tendency or dispersion) required for interpretation of the psychometric data and social-ized vision ratings. This makes it difficult to assess whether the distribution of these data were appropri-ate for the statistical tests that were performed, and their subsequent interpretation. For example, a restric-tion of range on either of these measures may influence the subsequent inferential test, the representativeness of the sample, or the generality of conclusions. The au-thors do report the mean coherence and its range. How-ever, the range is a measure of dispersion that may not be typical of the dataset as a whole, and other measures would be more informative (e.g., standard deviation). Measures of effect size magnitude are reported as Pear-son’s correlation coefficient, and are accompanied by
in-exact p values. Reporting inin-exact p values make it dif-ficult to assess Type I error probability (although, these may be computed from the summary data; see
Interpre-tation). Confidence intervals are also absent. Finally,
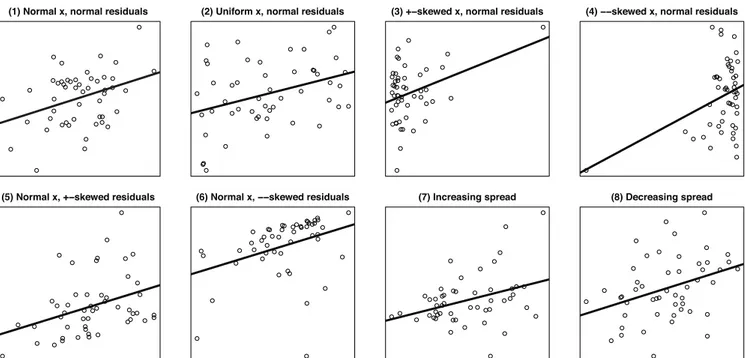
the authors do not report scatterplots of their data. This is problematic because summary correlation coefficients could have been generated by a variety of distributions of data, some of which may render the statistical test inappropriate. For example, Pearson’s correlation is not robust, meaning that a single extreme value can have a strong influence on the coefficient (Pernet, Wilcox, & Rousselet, 2013). As a graphical demonstration of this, in Figure 2 we provide examples of 8 distributions con-sistent with the correlation between frontal coherence and socialized vision content coding reported by the au-thors (i.e., r = .36, N = 50; plot_r function: cannonball package [v 0.0.0.9] in R Vanhove, 2018). Altogether, the authors do not report their results in adequate detail to fully describe the data.
Interpretation. We consider separately the authors two main claims below.
Claim 1: A difference in correlation magnitudes. A critical conclusion in this publication relates to a com-parison of effect size estimates, which in this case in-volves the Pearson correlation coefficient (r). The au-thors suggest that the correlation between right frontal coherence and socialized vision content (r = .36, p <.05) is greater than the correlation between right frontal coherence and perceptions of inspirational lead-ership (r = .26, p < .10). Based on this observation, the authors draw a theoretical conclusion relating to the mechanistic basis of inspirational leadership. This claim appears to be motivated on the basis of eyeballing a dif-ference in the absolute magnitude between these corre-lations, as well as a difference in the all-or-none deci-sion criteria based on the p values. However, the claim that an r of .36 is greater than .26 assumes that each r is equal to the correlations we would obtain if we were to sample the entire population of relevant business lead-ers and their followlead-ers. That is, not just this sample.
In statistical terminology, this is the assumption that each r is equal to the respective population effect size, rho (ρ). However, r represents the best estimate of ρ in a probability distribution of rs that lie below and above each r estimate (Zou, 2007). Therefore, to determine if one r is greater than another, we must examine the dis-tribution of probable scores within which each ρ may plausibly fall. This can be assessed using a parameter estimation approach by computing a 100(1 - α)% con-fidence limit on each r. In psychological science, α by convention is .05 which necessitates a 95% confidence interval (95% CI). This interval can be obtained using Fisher’s r to z transformation by first calculating the
con-(1) Normal x, normal residuals (2) Uniform x, normal residuals (3) +−skewed x, normal residuals (4) −−skewed x, normal residuals
(5) Normal x, +−skewed residuals (6) Normal x, −−skewed residuals (7) Increasing spread (8) Decreasing spread
All correlations: r(48) = .36
Figure 2. Examples of 8 scatterplots consistent with r = .36 in a sample of N = 50. The correlation between right
frontal coherence and the socialized vision scale could have been plausibly generated by any of these data distribu-tions. This demonstrates the importance of reporting scatterplots in order to verify whether Pearson’s correlation analysis was justified, and whether the correlation coefficient is representative of the data that has generated it.
fidence limits for z(ρ) and then back-transforming the limits to obtain a confidence interval for ρ (Zou, 2007). We conduct these analyses below2. For completeness,
we also report the exact p values given by the t statistic from each combination of r and N.
For the correlation between right frontal coherence and socialized vision content we obtain: r(48) = .36, 95% CI [.09, .58], p = .010 (Figure 3A; lower). For the correlation between right frontal coherence and fol-lower perceptions of inspirational leadership we obtain:
r(48) = .26, 95% CI [-.02, .50], p = .068 (Figure 3A;
upper). Focusing on the 95% CI (and ignoring the α criterion for evaluating p values), it can be seen that the distribution of possible values of ρ overlap. To test this statistically, however, we must conduct a statisti-cal test of the difference between these correlations us-ing the null hypothesis of a zero difference (i.e., the 95% CI on the difference contains zero). Zou’s (2007) method has been recommended for testing the statisti-cal difference between correlations2(Cumming &
Calin-Jageman, 2016, p. 320). In this case, Zou’s method takes into consideration the overlapping dependent cor-relation between socialized vision content and ratings of
inspirational leadership (r = .39). Using this method we obtain: r1−r2= .10, 95% CI [-.19, .39] (cocor package
for R [v1.1-3]; Diedenhofen & Musch, 2015). The best estimate of r1−r2 is .10, however, the 95% CI on this
effect is consistent with an interval of values ranging from -.19 to .39 (Figure 3B).
These analyses indicate that we are insufficiently con-fident to conclude that r = .36 is greater than r = .26 in these data, and that the difference between these cor-relations may be zero. Any theoretical claim that relies on a difference between these correlations is therefore not an accurate reflection of the data. Claiming that a difference between a statistically significant correlation and a non-significant correlation is itself statistically sig-nificant, is a common misinterpretation of NHST. This is referred to as the interaction fallacy, and has been discussed comprehensively elsewhere (Gelman & Stern, 2006; Nickerson, 2000; Nieuwenhuis et al., 2011).
2Note: These analyses assume bivariate normality, meaning
robust alternatives may yield more accurate intervals (Pernet et al., 2013). However, as the author’s analyses and claims are performed under this assumption, we also proceed with an assessment of claims assuming this is satisfied.
.36 [.09, .58]
.26 [−.02, .50]
−0.05 0.00 0.05 0.10 0.15 0.20 0.25 0.30 0.35 0.40 0.45 0.50 0.55 0.60 r.10 [−.19, .39]
−0.20 −0.15 −0.10 −0.05 0.00 0.05 0.10 0.15 0.20 0.25 0.30 0.35 0.40 r1 – r2A
B
Figure 3. Plot (A): graphical representation of Pearson’s r = .26 and r = .36 and their 95% confidence intervals
(CI) with a sample of N = 50 (values are given in each label). The 95% CI has been computed using Fisher’s r to
z transformation under the assumption of bivariate normality. While r = .26 is not statistically different from zero,
its 95% CI has considerable overlap with r = .36. Plot (B): a statistical test of the difference between Pearson’s r = .26 and r = .36 and its 95% CI, accounting for the overlapping dependent correlation of r = .39 (tails = two-sided, null hypothesis = zero) using Zou’s (2007) method. The difference between each correlation is compatible with zero difference.
Claim 2: The meaningfulness of a correlation magni-tude. The second critical conclusion in this work is that there is a meaningful, neural distinction between lead-ers who were considered high vlead-ersus low in espousing socialized visions. Statistically speaking, this claim rests on the strong assumption that the correlation between right frontal coherence and the socialized vision scale, r = .36, is equal to the population effect size, ρ. However, as we have shown in our calculations above, r = .36 is consistent with an interval of values specified by its con-fidence interval. The 95% CI on a correlation coefficient tells us that in 95% of random samples from the same population, the 95% CI will contain the population pa-rameter, ρ. It follows logically that in 5% of cases the 95% CI will miss this value. Therefore, we can deduce that it is plausible (although, not certain) that a 95% CI will contain the true value of ρ. In this case, ρ could plausibly range from .09 to .58 (see Figure 3A; lower).
There is indeed a statistically significant neural dis-tinction between leaders who espouse different quanti-ties of socialized content in their visions. However, the
precision of the estimate of this association is extremely low. That is, the 95% CI is so wide that the margin of error (quantified as the half-width of a confidence inter-val) is approaching the magnitude of the estimate itself (i.e., margin of error = .24). This means that there are a great many plausible values for which ρ could take. These values may potentially be negligible for everyday purposes (.09) or even very large (.58). The claim that this correlation is sufficient evidence for use of neuro-feedback to enhance coherence is therefore staggeringly disproportionate to the precision with which this effect has been measured.
Drawing substantive conclusions based on a dichoto-mous all-or-none decision in the absence of effect size magnitude, accuracy, and precision is one of the most widespread misuses of NHST (Cumming, 2014). One of the main reasons that scholars conduct empirical stud-ies is to learn about an effect of interest. When a p value describes an effect as statistically different from zero, yet the confidence interval is very wide, we un-derstand very little about the effect beyond its
direc-tion (i.e., positive or negative). For this reason, there has been increasing interest in recent years for planning studies to estimate the magnitude of an effect within a confidence interval that is adequately narrow in width. This has been referred to as accuracy in parameter es-timation (AIPE; Kelley & Rausch, 2006; Maxwell et al., 2008; Peters & Crutzen, 2017) or precision for plan-ning (Cumming, 2014). In this paradigm, a key ques-tion prior to conducting a study is: what sample size is required to provide a sufficiently precise estimation of an expected effect size of interest? What is sufficiently
precise depends on one’s research objectives. However,
one suggestion is to target a margin of error of at least half of the expected effect size (although this is not al-ways a practical solution; Cumming & Calin-Jageman, 2016, p. 266). If Waldman et al. (2011a) considered
r = .36 to be their best estimate of the expected
pop-ulation effect, ρ, they may consider designing a study that yields a margin of error of no more than .18. This would require a minimum of 92 participants to attain this level of precision with 95% confidence3 (confIntR:
userfriendlyscience package [v 0.7.2] in R; Peters, Ver-boon, & Green, 2018). It has been suggested that taking a parameter estimation approach to research planning may assist in the production of empirical work that is accurate, precise, and more likely to replicate (Peters & Crutzen, 2017).
Summary. Like Peterson et al. (2008), Waldman et al. (2011a) lacks an adequately transparent description of their study for it to be clearly understood, evaluated, or replicated with reasonable accuracy. Furthermore, the level of description that can be extracted from this report reveals that NHST has been misused or misinter-preted, and has led to interpretations of findings that are not substantiated by the data. This is the seminal work in organizational neuroscience: it has been cited 177 times in the Google Scholar database and is dis-cussed at length in most reviews of the literature. Yet, little attention has been given to what are important limitations in methods, analytic strategy, and interpre-tation of results.
On the basis of this review, we recommend that schol-ars familiarize themselves with the interaction fallacy and other misuses of NHST (see Gelman & Stern, 2006; Nickerson, 2000; Nieuwenhuis et al., 2011). We also recommend that the results of NHST be considered with explicit reference to effect size and precision to allow for a more informative judgment of research findings. And we further recommend that researchers consider preci-sion for planning in order to attain sufficiently narrow confidence intervals that allow for meaningful conclu-sions to be drawn from findings. Finally, in the inter-est of a self-corrective and cumulative science, we
sug-gest that scholars do not carelessly recite the contents of Waldman et al. (2011a) in future reviews of the lit-erature without sufficient critical evaluation. Given that Waldman et al. (2011a) is the seminal work of the field, we also call on the authors to amend their reports fol-lowing the JARS-Quant guidelines and to publish their data openly for re-analysis.
Part II
Focused post-publication review of secondary works Boyatzis et al. (2012). Examination of the neu-ral substrates activated in memories of experiences with resonant and dissonant leaders.
Boyatzis and colleagues (2012) is one of the ear-liest fMRI studies conducted in organizational neuro-science. This study was an exploratory investigation into the neural basis of the personal and interpersonal consequences of interacting with resonant and disso-nant leaders, with the implication that such knowledge may inform leadership training and practice. As the au-thors describe, resonant leaders are considered those whose relationships are characterized by mutual posi-tive emotions, while dissonant leaders are those who invoke negative emotions.
Using a sample of eight individuals with extensive employment experience, participants were interviewed to describe two distinct interactions with two lead-ers they considered resonant or dissonant, respectively (i.e., four leaders, describing eight interactions total). Audio statements based on each of these eight interac-tions were created for each participant (8 – 10 s) to be used as cues to recreate an emotional memory of the interaction while undergoing fMRI (5 s). As a manip-ulation check, participants were also presented with a 4-item question that gauged the valence of their emo-tional response from strongly positive to strongly neg-ative (2 – 3 s), where recall of resonant and dissonant leaders were expected to yield positive and negative af-fective responses, respectively. Using an event-related design, each of the eight different cues were randomly 3It is important to note from our discussion that r = .36
may not be the best estimate of ρ. The authors may therefore take a conservative approach and choose to plan for precision based on the lower limit of the plausible range of values for which ρ could take (i.e., .09). To estimate ρ = .09 with a mar-gin of error of no more than half of this expected effect size (i.e., .045) and with 95% confidence, a study would require 1867 participants (confIntR: userfriendlyscience package in R). Conducting studies with precision will require more re-sources than researchers are accustomed to, particularly when an expected effect size is very small.
presented six times across three runs which resulted in 48 trials in total.
Results of the manipulation check confirmed that emotional responses were all in the predicted direction. Following preprocessing, fMRI data were then analyzed using a fixed-effects analysis. For the contrast between the resonant and dissonant conditions (i.e., resonant > dissonant), the authors reported greater activation in seven regions of interest (ROIs): the left posterior cin-gulate, bilateral anterior cincin-gulate, right hippocampus, left superior temporal gyrus, right medial frontal gyrus, left temporal gyrus, and left insula. Because the au-thors tested no hypotheses in this exploratory study, re-sults were interpreted through reverse inference based on existing social, cognitive, and affective neuroscience research. For example, some of these regions have been implicated in the putative mirror neuron system. This system comprises a class of neurons that modulate their activity when an individual executes motor and emo-tional acts, and when these acts are observed in other individuals (Molenberghs, Cunnington, & Mattingley, 2012). As the authors describe, several regions im-plicated in this network were activated in response to memories of resonant and dissonant leaders. However, some of these regions were less active during the dis-sonant memory task. The authors interpreted this as a pattern of avoidance of negative affect and discomfort that was experienced during moments with dissonant leaders, and which may indicate a desire to avoid these memories.
Critical review. Boyatzis and colleagues (2012) de-scribe this study as an exploratory study. Therefore, we critically evaluate this publication as an example of a pi-lot research and overlook limitations that characterize such works. Such limitations may include (although, not necessarily) a lack of directional a priori hypotheses and a strong reliance on reverse inference. Here we focus specifically on the type of fMRI statistical analy-sis that has been performed, and the implications this has for drawing inferences from a sample to the whole population.
Drawing inferences about the population from an fMRI analysis. Organizational behavior researchers are typically interested in what is common among a sample of participants in order to permit generaliz-ability of an effect to the full population from which they are sampled. That is, scholars wish to predict and explain organizing behavior beyond the random sample that is included in their study in order to in-form organizational theory and practice decisions. The same principle applies to fMRI data analysis. In any fMRI study, the blood oxygen-level (BOLD) response to a task will vary within the same participant from
trial-to-trial (within-participant variability) and from participant-to-participant (between-participant variabil-ity). Therefore, in order to draw inference from a sam-ple group to the full population of interest, a mass univariate fMRI analysis must account for both within-and between-participant variability (Penny & Holmes, 2007). This is what is referred to as a random-effects (or mixed-effects) analysis, which allows for formal in-ference about the population from which participants have been drawn.
Boyatzis et al. (2012) report that only a fixed-effects analysis has been conducted on their fMRI data. Fixed-effects analyses account only for within-subject variabil-ity, and for this reason, inferences from such analyses are only relevant to the participants included in that specific fMRI study. In this case, inferences therefore only describe the eight participants recruited in Boyatzis et al. (2012). Because between-participant variance is much larger than within-participant variance, fixed-effects analyses will typically yield smaller p values that overestimate the significance of effects. For this rea-son, fixed-effects analyses are not typically reported in the absence of a corresponding random-effects analysis, particularly since the very early days of neuroimaging research (Penny & Holmes, 2007).
The results of fixed-effects analyses are useful if a researcher is interested in the specific participants in-cluded in a sample (e.g., a case study), or if it can be jus-tified that the sample represents the entire population of interest. However, because Boyatzis et al. (2012) con-ducted only a fixed-effects analysis, this means it would be uncertain if the same pattern of activations would be observed if an additional participant were to be in-cluded in the study, or if a replication were to be per-formed. Indeed, the authors report that the exclusion of the single female participant rendered eight regions of interest non-significant, demonstrating the instabil-ity of their reported effects and the strong influence of outliers when using fixed-effects analyses. A random-effects analysis is the appropriate analysis to perform if researchers seek to generalize their findings to the pop-ulation at large.
Summary. Boyatzis et al. (2012) aimed to ex-plain the neuronal basis of interactions with dissonant and resonant leaders, with the implication that such knowledge could improve leadership training and prac-tices. The authors take this step in an extensive review piece describing the neural basis of leadership (Boy-atzis, Rochford, & Jack, 2014) and provide explicit rec-ommendations on leadership practice on the basis of these exploratory findings (Boyatzis & Jack, 2018).
This study has been cited 99 times in the Google Scholar database. However, almost no attention has
been directed to the inadequacy of the analytic strat-egy, and the implications this has for generalizing find-ings from sample to population. While random-effects analyses are consistently reported in fMRI work in the broader social and cognitive neurosciences, we recom-mend that scholars remain vigilant of this practice in organizational neuroscience. We also recommend that scholars should be aware of this concern when dis-cussing Boyatzis et al. (2012) in future reviews of the literature. Finally, in the interest of a self-corrective and cumulative science, we also call on the authors to re-peat their analyses using a random-effect analysis. If these results do not replicate, we call on the authors to correct potentially misleading claims based on these data, and, if necessary, amend their recommendations for leadership practices accordingly. It is also notewor-thy that in any case, an adequately powered replication study is required to confirm these findings given that the sample size was very small.
Waldman et al. (2013a). Emergent leadership and team engagement: An application of neuroscience technology and methods.
Waldman et al. (2013a) is an empirical study that used real-time EEG recordings to examine emergent leadership and team engagement. The aim of this study was to investigate whether individual self-reports of en-gagement could predict whether that individual is likely to be appraised as an emergent leader in a team
con-text. A second aim was to examine whether fellow
team members were likely to be more engaged when an emergent leader (compared to a non-leader) used verbal communication during a group-based problem-solving task. To assess these research questions, the au-thors used psychometric measures of engagement and leadership, and an EEG-based measure of engagement that could be determined in real-time and on a second-by-second basis.
To this end, 146 business administration students were allocated to 31 teams of 4-5 individuals and given 45 minutes to solve a corporate social responsibility case problem in a team setting. During this task, EEG was measured continuously from each participant and time-matched to individual speaking times using video recordings. As the authors describe, the EEG measure was based on a discriminant function that has been used to classify an individual’s cognitive state into dif-ferent levels of engagement (Berka et al., 2004; Berka et al., 2005). At the conclusion of the task, participants were asked to assess their level of engagement retro-spectively using the Rich et al. (2010) job engagement measure, and to assess fellow team member levels of
emergent leaders behaviors using items from the Multi-factor Leadership questionnaire (Bass & Avolio, 1990).
In the analysis that followed, emergent and non-emergent leaders were identified in each of the 31 groups based on the extreme (i.e., highest and lowest) follower ratings of emergent leadership. Using logis-tic regression (and controlling for gender, age, and the number of friends in each team) self-reports of individ-ual engagement were found to be a significant predic-tor of categorization as an emergent leader on behalf of other team members (b = 0.97, p < .05).
Having demonstrated that self-reports of engage-ment predicted emergent leader status, the authors con-ducted a test to determine if other team members were more engaged during periods of emergent leader verbal communication (compared to individuals who scored lowest on follower ratings of emergent leadership). In their methods section, the authors indicated that the team sample size was reduced from N = 31 to 26 in the following analyses, due to technical problems with EEG recordings. Pearson correlation analysis was performed between aggregate measures of team-level engagement using the self-report and the EEG measure, which re-vealed a positive relationship (r = .32, p < .05) that the authors interpreted as evidence of moderate convergent validity for their EEG measure. A one-tailed dependent-samples t-test revealed no difference in real-time (EEG-based) team engagement for the total time an emer-gent leader vs. non-leader was communicating during the task (t = 1.33, p > .05). However, when restrict-ing the analysis to solely the final instance of emergent leader and non-leader communication, real-time team (EEG-based) engagement was found to be greater dur-ing emergent leader communication compared to non-leader communication (t = 2.24, p < .05).
The authors concluded that individuals who are highly engaged (as measured by self-report) are likely to be appraised by fellow group members as an emer-gent leader. In turn, the claim is made that emeremer-gent leaders may be responsible, in part, for team engage-ment. This is because the EEG-measure of engagement was greater during the last period of emergent leader versus non-leader communication. From these results, the authors also claim that real-time EEG recordings us-ing their discriminant function represents a valid mea-sure of engagement. It is asserted that such meamea-sures may be particularly useful to organizational behavior research investigating ongoing team processes.
Critical review. Waldman et al. (2013a) represents a single dataset that has been reported through multi-ple venues, where each venue provides a different level of detail regarding methods, analytic strategy, and re-sults. Our critical review is therefore guided by the