THE CLIMATE CHANGE IMPACT OF
POSSIBLE MUNICIPAL SOLID WASTE
MANAGEMENT SCENARIOS IN ESTONIA
Harri Moora
Evelin Urbel-Piirsalu
Stockholm Environment Institute Tallinn Centre, Estonia
Viktoria Voronova
Tallinn University of Technology, Estonia
ABSTRACT
Waste management has an influence on the greenhouse gas (GHG) formation. The emissions of greenhouse gases vary between the EU countries depending on waste treatment practices and other regional factors such us composition of waste. The aim of this paper was to examine, from a life-cycle perspective, Municipal Solid Waste (MSW) management in the context of greenhouse gas formation and to evaluate the possible reduction of climate change potential of alternative waste management options in Estonia. The paper summarises the results of a case study in Estonia, assessing the climate change impact by 2020 in terms of net greenhouse gas emissions from two possible management scenarios. As a result it can be concluded that better management of municipal waste and diversion of municipal waste away from landfills could significantly reduce the emissions of GHG and, if high rates of recycling and incineration with energy recovery are attained, the net greenhouse gas emissions may even become negative. It means that these waste management options can partly offset the emissions that occurred when the products were manufactured from virgin materials and energy was produced from fossil fuels. This is especially important concerning the climate change impact.
KEYWORDS
Greenhouse gas emissions; municipal solid waste; life cycle assessment; scenario analysis; climate change potential
1 INTRODUCTION
Climate change is a serious international environmental concern and the subject of much research and debate. It is emphasised worldwide that the main climatic parameters such as air temperature, precipitation, etc. have changed and the changes are related to the increase of greenhouse gases [1]. Estimation of climate change impacts on different ecosystems is based on different rates of GHG emissions. GHG emissions represent one of the most significant environmental impacts of waste management. The GHG
emissions from the waste sector depend on a number of factors including waste generation, waste composition and used waste management practices.
The generation of MSW in the European Union (EU) has increased steadily in the past decades as Europeans have become richer and consume more. The amount of MSW per year is expected to grow by 25% within the EU from 2005 to 2020, with striking differences between Member States [2]. The new EU Member States including Estonia have recently experienced a rapid economic development, resulting in a significant increase of waste quantities, while their waste management systems still require much effort to be adjusted to the European state-of-the-art. The generation and treatment of municipal waste varies significantly across different EU member states. The old Member States (EU-15) landfilled less than 50% of the municipal waste in 2008, while the majority of the new Member States (EU-12) landfilled most of the MSW (more than 80%) [3]. Therefore, in the context of climate change the diversion of municipal waste away from landfills and choosing optimal waste recovery practices is especially important in the new Member States.
Through iterative examination of various waste management technologies and treatment alternatives, life cycle based methodologies can help to identify optimal environmental solutions for managing the waste. Life-cycle information can also help to identify the benefits and trade-offs of different waste management options in terms of direct GHG emissions (from landfills, incineration plants, recycling and collection of the waste) and indirect GHG emissions that are associated with the extraction and processing of primary resources or fossil fuels versus those associated with recycling or incineration operations. In the new Member States the life-cycle assessment (LCA) models are not widely used for waste management planning and calculation of GHG emissions. The major limitation of using LCA in waste management planning in these countries is the lack of relevant data and knowledge of the analysed systems [4].
The main aim of this paper is to examine the climate change impact in Estonia in terms of GHG emissions from MSW management. Two most feasible waste management options for Estonia, material recycling with biological recycling in terms of composting and material recycling with intensive incineration, were compared in terms of their possible contribution to climate change in the period 2002 - 2020.
Most of the earlier studies have focused on the calculation of direct GHG releases associated with municipal waste management. In this paper calculations are based on life-cycle information and the calculated emission levels include not only direct emissions from MSW management, but also the ‘avoided’ emissions from material recycling and energy recovery. The study is based on the LCA model for waste management planning – WAMPS [4].
2 THE SOURCES OF GREENHOUSE GAS EMISSIONS IN ESTONIA
Estonia has signed and ratified the Kyoto Protocol, according to which emissions of GHG must be reduced by 8% in 2008-2012, compared to the baseline year 1990. All EU Member States report regularly their direct and projected GHG emissions in order to apply policies and measures to reach this target. The methodology used for the estimation of GHG emissions follows so called IPCC guidelines [5] produced by international expert groups for the IPCC and are followed also by Estonia to calculate
the national yearly GHG emissions. These calculations focus mainly on direct GHG emissions of different sectors.
Figure 1. Share of GHG emissions by main sources in Estonia in 2007 [7]
According to the latest GHG emission calculations, which were made for the 5th National Communication under the United Nations Framework Convention on Climate Change (UNFCCC) in 2010, the total emission level in 2007 was 22 Mt of CO2
equivalents. The main contributors to GHG emissions in Estonia are energy supply together with transport (86,7%) (Figure 1).
The electricity production in Estonia is mainly based on an Estonian specific fossil fuel - oil shale. The production of electricity from oil shale entails higher emissions of CO2
than most of the other fossil fuels used in EU [6]. The share of waste management (mainly CH4 emissions from landfills and waste water sludge treatment) is only ca 3%
of the total GHG emissions. However, waste management is an important source of GHG reductions, since new waste-to-energy technologies are closely linked to energy production. Therefore, when planning waste management systems the context of climate change should be taken into account, since it contributes to the meeting of the Kyoto targets.
3 GREENHOUSE GAS EMISSIONS FROM WASTE MANAGEMENT
The GHG emissions from the MSW management are sum of the direct emissions (from landfills, waste-to-energy plants, recycling operations and collection of the waste) and indirect emissions. Indirect emissions arise from the energy and secondary products produced when incinerating and recycling waste replace energy production from fossil fuels and the use of raw materials for plastic, paper, metals, etc.
Figure 2. Main sources of GHG emissions from the waste management sector in EU-27, 2008 [8]
Direct emissions from the waste management sector in the EU-27 contributed by 2,8 % of the total GHG emissions in 2008 [8]. The key sources of waste-related greenhouse gas emissions are illustrated in Figure 2.
As shown in Figure 2, the main sources of direct GHG emissions from waste management are landfills. It could be estimated that GHG emissions from landfills are larger in new Member States including Estonia due to a bigger share of landfilling in these countries. The landfilling of biodegradable waste results in the formation of landfill gas which contains mainly methane (CH4). In the modern landfills the landfill
gas is partly (usually 10-50%) collected and either disposed by flaring or used as a fuel for energy production. Contrary to GHG emissions from other waste management practices (e.g incineration or recycling), landfill GHG emissions are characterised by the large time lag of emissions [9].
The most widely practised alternative to landfilling is mass-burn incineration where MSW is burnt with little or no pre-treatment. The modern MSW incinerators are required to recover energy released by the combustion process. Incineration is a source of GHG emissions like other types of combustion process. GHG emissions are estimated by the carbon content of the incinerated waste material. The carbon content contributes mainly to CO2 emissions and less to CO, CH4 and NMVOC emissions.
Exhaust gas cleaning or incineration technology does not influence CO2 emissions.
Emissions of CO2 from incineration of biological waste material do not contribute to net
GHG emissions and should therefore not be taken into account. Calculation of net CO2
emissions from waste incineration is based on the fossil carbon content of the MSW. The net climate change impact of incineration depends on how much fossil carbon CO2
is released – both at the incinerator itself (direct emissions) and in savings of fossil fuel from marginal energy sources displaced by incineration.
Recycling diverts components of the waste stream for reusing the materials. If the GHG
emissions resulting from the separating and processing of the recycled material into new products are less than those generated while manufacturing the products from primary material, net savings of GHG emissions results.
Composting is an aerobic process and a large fraction of the degradable organic carbon
(DOC) in the waste material is converted into CO2. CH4 is formed in anaerobic sections
of the compost, but it is oxidised to a large extent in the aerobic sections of the compost. The estimated CH4 released into the atmosphere ranges from less than 1 percent to a
few per cent of the initial carbon content in the material [10-11]. Composting can also produce emissions of N2O. The range of the estimated emissions varies from less than
0,5 % to 5 % of the initial nitrogen content of the material [10-14]. Poorly working composting process is likely to produce more both of CH4 and N2O [e.g.14]. This is the
reason why the so-called home composting could have a relatively high climate change impact in terms of CH4 emissions. The life cycle based climate change impact of
composting depends on how much compost is substituting mineral fertilisers. The quality and marketing of the end product (compost) is the most crucial composting issue.
Anaerobic digestion is especially suitable for treating wet bio-waste, including fat (e.g.
kitchen waste). It produces a gas mixture (mainly CH4- 50 to 75% - and CO2) in
controlled reactors. Therefore the emissions to the air are significantly lower and easier to control than from composting. Similarly to waste incineration, biogas produced in anaerobic digestion process can reduce indirect GHG emissions significantly if used for energy production.
There are several other waste management options available. One of the most common practices is mechanical-biological treatment (MBT), which is a combination of mechanical and biological steps to reduce the amount and biological activity of the processed MSW. As most emissions from MBT operations result from biological treatment of biodegradable waste, the emissions into air are similar to composting or anaerobic digestion. However the end product is usually contaminated to a level which hinders its further use. Combustible waste sorted out in MBT processes may be further incinerated because of its energy recovery potential.
A common link between different waste management practices is the need for
collection and transport from the source of the waste to the waste treatment/disposal
facilities. It all has GHG impacts, mostly through the use of fossil fuels and associated emissions of CO2. N2O is also emitted from vehicle engines, but this has a minor
impact.
4 METHODOLOGY
As a basis for determination of GHG emissions from studied municipal waste management scenarios the LCA model for waste management planning WAMPS was applied. WAMPS model is intended to be applied during the waste management planning process to find optimal solutions and alternatives for waste management systems [4]. WAMPS presents the environmental and economic consequences of different waste management scenarios in a life cycle perspective. WAMPS was developed by the Swedish Environmental Research Institute and is based on a more in-depth LCA model ORWARE [15-17]. WAMPS compares a waste management system with a background system. The waste management system can produce different products depending on the choice of treatment and recycling: heat, steam, electricity, vehicle fuel (biogas), compost, paper, plastic, metals, etc. In background system similar products are produced from virgin origin. When a product is produced from waste, it substitutes a product in the background system. Each waste product has an alternative in the background system with a virgin raw material source and a production process that is included in the model. In WAMPS different recovery options are compared with the
background system and potentially ‘saved emissions’ are assessed. The net emissions from the studied system are calculated according to:
Enet =Ewaste – EBackground
Enet: Net emission (tonnes/year or kg/year)
Ewaste: Emission from a waste process that produces a certain amount of product
(tonnes/year or kg/year).
EBackground: Emission from the same amount of alternative virgin production in the
background system (tonnes/year or kg/year).
This calculation can give negative net emissions. This means for example that the waste incineration could give lower emissions than the corresponding energy production in the background system. The global warming impact is calculated as CO2-eqivivalent
emissions. The basic functional unit in WAMPS is the waste generated within a specific region.
5 MUNICIPAL WASTE GENERATION AND COMPOSITION
The contribution made by the waste management sector to climate change is primarily determined by the volume and composition of municipal solid waste as well as the waste management technologies chosen.
Data on waste generation and composition in many European countries are quite poor in terms of availability, comparability, consistency and quality [18]. This is especially relevant for the new Member States including Estonia. Since the lack of information on actual waste composition is one of the main barriers for waste management planning in Estonia, the composition of mixed municipal waste was explored by a countrywide sorting analysis of MSW in 2007/2008 [19]. Based on the results of the sorting analysis and the corrected statistical data, the most updated information on MSW generation and composition (Figure 3) was compiled. The biodegradable fraction (organic waste, paper and cardboard, wood and textiles), which is the main source of GHG emissions, makes up a considerable share of municipal waste in Estonia (63%). The packaging waste amounts to 27% and the share of combustible waste to 80% of total MSW.
The quantity of municipal waste strongly depends on the socio-economic conditions of the region [20]. The generation of MSW relates mainly to the nature and intensity of economic activities and the size of the population. In general there is a strong link between Gross Domestic Product (GDP) and waste generation. The quantity of municipal waste in Estonia has rapidly risen in line with the economic growth and growing consumption (see Figure 4). According to specified statistical data, approximately 435 000 tonnes of municipal waste (302 kg per person) were generated in 2000. The amount of municipal waste was growing rapidly during 2004-2007, on the average by 5% per year and reached 540 000 tonnes in 2007 (400 kg per person). Along the economic decline in 2008-2009, the MSW generation has dropped in correlation with GDP degrease. It can be anticipated that municipal waste generation in Estonia will start to grow along with the recovery of economy. Since the number of population is expected to remain roughly the same in Estonia, the possible economic development will be the key driving force behind the changes in waste volumes in the next decade. During the period 2000 to 2020 the generation of municipal waste is projected to increase by approximately 60% (Figure 4). In 2020, the generation of municipal waste
per person is estimated to be ca 510 kg (690 000 tonnes). In general, this is a bit less than the projections made by the EEA - in the new Member States, the generation of MSW is projected to increase by approximately 50% from 2005 to 2020 [18].
Figure 3. The average composition of MSW for Estonia [19]
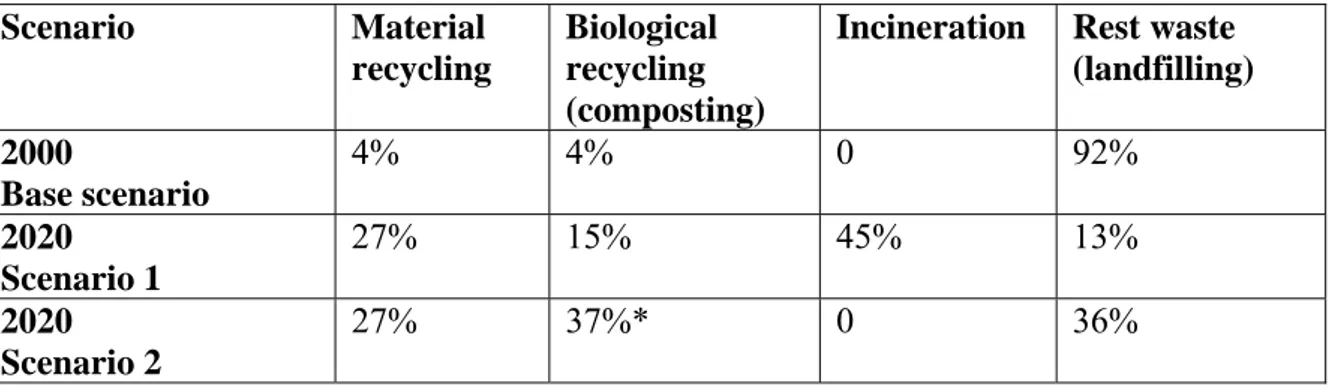
6 WASTE MANAGEMENT SCENARIOS STUDIED
For the GHG emission calculation the waste management situation in 2000 was taken as a starting point or a base scenario. Two waste management scenarios were developed to analyse possible future alternative waste treatment options and their climate protection potential by 2020. Estonia, similarly to other new EU Member States, has to comply with the EU legal requirements and recovery targets for waste management. Since the pros and cons of waste incineration as a possible MSW management option were recently discussed in Estonia, the incineration-based scenario was compared with the scenario where legal targets are achieved with intensive biological recycling (composting) (see also Table 1). Both alternative future scenarios are in compliance with the requirements and recycling targets of the following legal acts: European Packaging Directive 2004/12/EC - minimum packaging recovery target 60% for packaging waste; Landfill Directive 1999/31/EC - target amount of biodegradable municipal waste going to landfills must be reduced to 35% by 2020.
The predictions about the future MSW generation presented in the earlier chapter were considered when developing the alternative future scenarios. It is assumed that waste composition remains the same during the studied period. For both future scenarios it is also assumed that all landfills will be equipped with a landfill gas collection system at the latest by 2010 and the landfill gas recovery rate will increase up to 50 % by 2020. Before 2010 the collected gas is flared and after 2010 it is used for electricity and heat production, which is substituting oil shale based electricity and natural gas based heat used for district heating. The energy produced in waste incineration is also substituting the electricity produced from oil shale and heat from natural gas.
Base scenario (scenario 0) - In 2000, waste management in Estonia primarily involved
landfilling of MSW (92% of the total MSW). There was no landfill gas collection in landfills at that time. Only a small amount of packaging waste (mainly PET-bottles and cardboard) was collected separately and sent to recycling. There was no centralised collection system for biodegradable waste. Approximately 17000 tonnes of biodegradable waste (mainly garden waste) were composted in the households (4% of the total MSW). It is assumed that the share of home composting will remain the same till 2020.
Material recycling with intensive incineration (scenario 1) – This scenario is a
projection for 2020, where the dominant option of MSW management in Estonia is incineration. 45% of MSW is incinerated in the mass-burn incineration plant. This assumption is based on the plans to build an incinerator close to the capital of Estonia, Tallinn. The incineration plant is expected to start its operation in 2012. The incinerator complies with all the EU requirements and it is assumed that the gross efficiency of energy recovery from the incineration process will be relatively high (80%). A large amount of the heat could be utilised since Tallinn has large dwelling areas with district heating system. In this scenario increased amounts of recyclable materials (mainly packaging, paper, cardboard and metals) are separately collected and recycled to fulfil the recycling targets of the EU Packaging Directive. The recycling of material is expected to be 30%. As incineration is already contributing to the reduction of biodegradable waste, the share of biological recycling is not expected to exceed 15% of the total MSW. The centrally collected kitchen waste is composted using static composting method with forced aeration. Collected garden waste is composted in open windrows. Intensive material recycling and incineration leads to a relatively small amount of rest waste, which is landfilled (13% of the total MSW).
Material recycling with biological recycling in terms of composting (scenario 2) – This
scenario is a projection for 2020, where the legal targets are archived by material and biological recycling. Also in this scenario material recycling is expected to amount to up to 30% of the total MSW. The Landfill Directive requirement to divert biodegradable waste away from landfilling, is fulfilled by increasing composting to 37% of the total MSW. An increased amount of wet biodegradable waste is composted using centralised reactor-composting method (without gas collection and energy recovery). It is assumed that the remaining waste will be deposited in a landfill.
Table 1. Municipal Solid Waste management scenarios
Scenario Material recycling
Biological recycling (composting)
Incineration Rest waste (landfilling) 2000 Base scenario 4% 4% 0 92% 2020 Scenario 1 27% 15% 45% 13% 2020 Scenario 2 27% 37%* 0 36% 7 RESULTS
The results of the scenario analysis in terms of net GHG emissions are shown in Figure 4. The diagram shows the net GHG emissions from the waste management system minus saved emissions in the background system. When the emissions from the studied waste management scenario or waste management practice are less than the saved emissions in the background system then net result is negative.
The results indicate that net GHG emissions from the management of municipal waste in Estonia are projected to decline significantly by 2020 from a peak of around 1.1 million tonnes CO2-equivivalents per year in 2000, largely because of increased
recovery of MSW and the diversion of waste away from landfills.
When comparing the two studied scenarios we can see that the incineration scenario (scenario 1) has a higher climate protection potential than the alternative composting scenario (scenario 2). In scenario 1 where high rates of recycling and incineration with energy recovery are attained, the net emissions of CO2-equivivalents are even negative.
The reason for the negative net GHG emissions is a relatively low amount of waste sent to landfills as well as a high share of material recycling (avoided primary production of materials) and recovered energy in incineration plants (avoided emissions as a result of substituting heat and electricity produced from natural gas and oil shale in the background system). Incineration gives approx. 75% and recycling almost 25% of the total avoided emissions. In scenario 2 sources of GHG savings are mainly material recycling and the avoided emissions from landfilling. As in this scenario composting without energy recovery is applied, the net GHG emissions are higher than in scenario 1.
Figure 4. Emissions of net GHG from studied waste management scenarios, 2000-2020 (tonnes CO2-equivalents)
Direct emissions from landfills continue to be a major source of GHG emissions till 2020 despite of the fact that the landfilling rate will degrease significantly and a relatively high share of landfill gas is recovered in both studied scenarios. The GHG
emissions from waste collection and transport will increase by 2020 due to increased recycling. In scenario II a higher collection rate of biodegradable waste causes slightly more emissions of CO2-equivivalents. In spite of that, the collection and transport of
waste accounts for a relatively small amount of estimated net GHG emissions in both future scenarios.
8 CONCLUSIONS
The aim of this study was to evaluate the climate change impact of the possible future waste management options in Estonia and not to predict the exact GHG emissions generated in the waste sector.
As a result of the scenario analysis in Estonia it can be concluded that better management of municipal waste and especially diversion of municipal waste away from landfills could significantly reduce the emissions of GHG despite an almost 60% increase in waste generation between 2000 and 2020. This is valid even if landfill gas is recovered at a high rate. Material recycling and incineration with high rates of energy recovery should be favoured compared to other waste management options where energy is not recovered (e.g. composting). It is important to stress that if high rates of recycling and incineration with energy recovery are attained, the net GHG emissions may even become negative, which means that these waste management options can partly offset the emissions that occurred when the products were manufactured from virgin materials and energy was produced from fossil fuel/oil shale. Intensive recycling and incineration of MSW usually also lead to a lower landfilling rate of MSW compared to other possible waste management scenarios. Overall, emissions of GHG associated with the collection and transport of the waste and recovered materials are small in comparison with other waste management practices. However, along the increased recycling rate (especially additional collection of biodegradables) the collection system and transport distances could have considerable impact on the overall GHG emissions of the waste management options.
In general, the conclusions of the study concur with other recent LCA studies [2, 21-22], but due to the fact that in Estonia energy produced from waste substitutes oil shale based electricity which has high climate change impact in terms of CO2 emissions,
incineration and other waste-to-energy options (e.g. anaerobic digestion) where energy is produced and utilised, should be preferred to other waste management practices. The total emissions of GHG from MSW management depend on several factors. The waste composition was assumed to be the same throughout the studied period. In reality, the fluctuations in the economic situation may lead to changes in waste composition [4]. Therefore, it would be good to study the possible change in the composition of waste and its possible impact on the results. Also the future energy source in Estonia is assumed to change including more renewable and nuclear energy while the share of oil shale is assumed to decline [23]. Thus, it would be interesting to analyse how a possible change of the marginal energy source would affect the net GHG emissions, especially the relative effects of waste incineration.
REFERENCES
[1] IPCC, 2007. Summary for Policymakers. In: Solomon, S., D. Qin, M. Manning, Z. Chen, M. Marquis, K.B. Averyt, M.Tignor and H.L. Miller (eds.) Climate
Change 2007: The Physical Science Basis. Contribution of Working Group I to the Fourth Assessment Report of the Intergovernmental Panel on Climate Change. Cambridge University Press, Cambridge, United Kingdom and New York, NY, USA.
[2] ETC/RWM, 2008. Municipal waste management and greenhouse gases. Working paper 2008/1. Copenhagen. Available http://waste.eionet.europa.eu/publications. [3] Eurostat, 2010. Available at http://ec.europa.eu/eurostat
[4] Moora, H., 2009. Life Cycle Assessment as a Decision Support Tool for System Optimisation – the Case of Waste Management in Estonia. Doctoral thesis. Tallinn University of Technology, 174p.
[5] IPCC, 2006. 2006 IPCC Guidelines for National Greenhouse Gas Inventories, Prepared by the National Greenhouse Gas Inventories Programme, Eggleston H.S., Buendia L., Miwa K., Ngara T. and Tanabe K. (eds). Published: IGES, Japan. Available at http://www.ipcc-nggip.iges.or.jp/public/2006gl/index.html
[6] OSELCA, 2006. Introduction and implementation of Life Cycle methodology in Estonia: Effects of oil shale electricity on the environmental performance of products, Layman’s report. LIFE03 ENV/EE/000194, pp.2-3. Available at
http://www.energia.ee/OSELCA/eng/index.php.
[7] EEA (2009), “Greenhouse gas emission trends and projections in Europe 2009”, report No 9/2009.
[8] EEA, 2010. Annual European Union greenhouse gas inventory 1990–2008 and inventory report 2010. Technical Report. Submission to the UNFCCC Secretariat 27 May 2010.
[9] Sundqvist, J.O., 1999 Life cycle assessments and solid waste – Guidelines for solid waste treatment and disposal in LCA. Stockholm, AFR - Report 279.
[10] Beck-Friis, B.G., 2001. Emissions of ammonia, nitrous oxide and methane during composting of organic household waste. Doctoral Thesis. Uppsala: Swedish University of Agricultural Sciences, 331 p.
[11] Detzel, A., Vogt, R., Fehrenbach, H., Knappe, F. and Gromke, U., 2003.
Anpassung der deutschen Methodik zur rechnerischen Emissionsermittlung und internationale Richtlinien: Teilbericht Abfall/Abwasser. IFEU Institut - Öko-Institut e.V. 77 p.
[12] Petersen, S.O., Lind, A.M. and Sommer, S.G., 1998. Nitrogen and organic matter losses during storage of cattle and pig manure. J. Agric. Sci., 130: 69-79.
[13] Hellebrand, H.J. (1998), “Emissions of nitrous oxide and other trace gases during composting of grass and green waste”, J. agric, Engng Res., 69:365-375.
[14] Vesterinen, R., 1996. Impact of waste management alternatives on greenhouse gas emissions: Greenhouse gas emissions from composting. Jyväskylä: VTT Energy. Research report ENE38/T0018/96. (In Finnish). 30p.
[15] Sundqvist, J.O., Granath J., Reich Carlsson M., 2002. Hur skall hushållsavfallet tas om hand? Utvärdering av olika behandlingsmetoder. Stockholm, IVL Report B1462. Available at http://www.ivl.se
[16] Björklund, A., 2000. Environmental systems analysis of waste management – experiences from applications of the ORWARE model. Doctoral thesis. TRITA-KEM-IM 2000:15, ISSN 1402-7615, AFR report 30. Stockholm, Sweden: Royal Institute of Technology; 2000.
[17] Eriksson, O., 2000. A systems perspective of waste and energy”, Licentiate thesis TRITA-KEM-IM 200:16, ISSN 1402-7615, AFR report 30. Stockholm, Sweden: Royal Institute of Technology; 2000.
[18] ETC/RWM, 2007. Environmental outlooks: municipal wastes. Working paper 2007/1, Copenhagen. Available at http://waste.eionet.europa.eu/publications. [19] Moora, H., Jürmann, P., 2008a. The analysis of the quantity and composition of
mixed municipal solid waste in Estonia - Municipal solid waste composition study. SEI-Tallinn.
[20] Beigl, P., Wassermann, G., Schneider, F., Salhofer, S., 2004. Forecasting municipal solid waste generation in major European cities. In: Pahl-Wostl, C., Schmidt, S., Jakeman, T.(Eds). iEMSs Int. Congress - Complexity and Integrated Resources Management, Osnabrück, Germany.
[21] German Federal Environmental Agency (2005), “Waste Sector’s Contribution to Climate Protection”, Research Report 205 33 314 UBA-FB III, August 2005. Available at http://www.bmu.bund.de/files/pdfs/allgemein/application/pdf/klima_ abfall_en.pdf
[22] Sander, K., 2008. Climate protection potentials of EU recycling targets. Ökopol GmbH, Germany. Available at http://www.eeb.org/publication/documents/
RecyclingClimateChangePotentials.pdf
[23] Moora, H., Lahtvee, V., 2009. Electricity Scenarios for the Baltic States and Marginal Energy Technology in Life Cycle Assessments – a Case Study of Energy Production from Municipal Waste Incineration. Oil Shale 26(3 Special), 331 - 346.
![Figure 1. Share of GHG emissions by main sources in Estonia in 2007 [7]](https://thumb-eu.123doks.com/thumbv2/5dokorg/3686174.45564/3.892.290.609.237.437/figure-share-ghg-emissions-main-sources-estonia.webp)
![Figure 2. Main sources of GHG emissions from the waste management sector in EU-27, 2008 [8]](https://thumb-eu.123doks.com/thumbv2/5dokorg/3686174.45564/4.892.309.578.126.306/figure-main-sources-ghg-emissions-waste-management-sector.webp)
![Figure 3. The average composition of MSW for Estonia [19]](https://thumb-eu.123doks.com/thumbv2/5dokorg/3686174.45564/7.892.173.612.253.523/figure-average-composition-msw-estonia.webp)