FOOD SUPPLY CHAINS’ SUSTAINABLE
PERFORMANCE IN THE CASE OF REPLACING
DISPOSABLE TRANSPORTATION BOXES
WITH THE RECYCLABLE BOXES
Hanne Vuorenmaa
Elina Ojala
University of Vaasa, Finland
Seinäjoki University of Applied Sciences, Finland
ABSTRACT
Paper introduces theories about sustainable supply chain management and a case study which illustrates the way to include environmental and social issues as a part of the strategic supply chain decision making. This paper describes the quantitative changes which case food supply chain’s sustainable performance meets when disposable transportation boxes will be replaced with recyclable boxes. In case study the economic and environmental success of the proposed transportation box change depends most on how well the box recycling and cleaning is possible to fit to the supply chain infrastructure.
KEYWORDS
Supply chain, sustainability, performance
1 INTRODUCTION
A supply chain management and the environmental issues are widely discussed topics in the industry, but there are limited numbers of studies combining those two topics. Food supply chains, as well as supply chains in general, are globalizing and competing in the retail and in the catering markets with global brands.
The objective of this paper is to introduce a case study and a method used in the case study. The objective of the case study is to clarify how supply chain’s economical, ecological and social performance changes if the recyclable transportation box system would replace the disposable transportation boxes.
Chapter 2 introduces theoretical background such as supply chain performance and sustainability. Chapter 3 introduces a SCOR- model based supply chain’s sustainability performance analysis model, which is the method used in this study. Case study in the chapter 4, describes how the sustainable performance of the case food supply chain would change if the transportation boxes would be replaced with recyclable transportation boxes. Chapter 4 also includes analysis of the effects of the recyclable box system to the supply chain’s sustainable performance. Chapter 5 concludes the usability of the SCOR based supply chain’s sustainability performance analysis model.
2 SUPPLY CHAIN MANAGEMENT AND SUSTAINABILITY
The objectives of the supply chain management (SCM) are to achieve a suppliers’ and customers’ integrated value chain with the help of information technologies and systems [1]. The performance measurement is an essential part of supply chain management [2]. The suitable performance measures would help organizations to achieve better competitiveness in global markets [3]. A supply chain performance is measured often with money, time and quality. The performance of the supply chain can be measured from many viewpoints for example supplier relationships [4], sc risks [5], and after-sales service network [6]. The customer is important in supply chain management. The impact of customer orientation and interactive system infrastructure throughout enterprise networks is not fully understood [7].
2.1. Supply chain management
Intangible and non-financial supply chain performance measures are nowadays more important [2]. A modern supply chain tools are needed, for example financial tools [8] and approaches for expressing the overall performance of a SC are proposed [9].
There are differences between best supply chains from the usual supply chains [10]. The six most important broad practices are making supply chain strategy an explicit part of the business strategy, segmentation, optimizing network, standard methodologies such as lean value chain, integrated planning, and talent management.
Cash to cash- strategies (C2C) are one recommendation to the supply chain management [11]. C2C-calculation includes tree balance sheet indicators which are inventory, accounts receivable, and account payable. Even if there are lots of supply chain management studies there are still no standardized and generally accepted or used model or framework for supply chain management which expresses overall performance of the supply chain. The Supply Chain Operations Reference-model (SCOR) seems to be the best available attempt to describe, measure, and compare supply chain operations, but the number of the companies who use the model is not huge [12].
2.1. Sustainability
Sustainable development aims to responsible use of natural sources in the long time scale. Corporate responsibility promotes sustainable development in society and international affairs. Corporate responsibility can be divided into three parts which are economical, environmental and social responsibility [13]. Sustainable performance of the company should take into account the direct impacts from on-site processes but also indirect impacts embodied in the supply chains of a company [14].
Company social responsibility CSR has motivated companies to add attention to the social issues [15]. Economical responsibility means taking care of the economical sustainability and consequences of the business actions to the economical situation of the reference groups. Economical responsibility includes e.g. profitability, compatibility, efficiency, and ability to response to owner’s expectations of the return on investment and competitiveness.
3 THE METHOD
The method used in this study bases on the SCOR-model which is accomplished with scope sustainability viewpoint. Later the method is called supply chain sustainable performance estimation method.
3.1. SCOR model
The SCOR model is a supply chain process reference model developed by SCC and it divides management processes into five major management processes (Figure 2).
Customer’s Customer Deliver Suppliers’ Supplier Supplier Your Company Customer Source Deliver Make Deliver Make Source Source Plan
Return Source Make Deliver Return
Return
Return Plan
Plan Plan Plan
Return
Return Return
Return
Figure 2. SCOR is organized around five major management processes [12]
The SCOR model has tree levels [16]. The first level is strategic level and the third level is most detailed level. The first level includes metrics for customer-faced and internal-faced supply chain performance attributes, which are reliability, responsiveness and flexibility and costs and assets (table 1).
Table 1. SCOR. Level 1 metrics (Supply Chain Council, 2009)
re li ab ilit y re spo ns iven ess flex ib il ity cost s asse ts
perfect order fullfillment x order fullfillment cycle time x upside supply chain flexibility x upside supply chain adabtibility x downside supply chain adabtibility x supply chain management cost x
cost of goods sold x
Supply chain attributes means in the words of the Supply Chain Council that reliability means the performance of the supply chain in delivering: the correct product, to the correct place, at the correct time, in the correct condition and packaging, in the correct quantity, with the correct documentation, to the correct customer. Responsiveness means the speed at which a supply chain provides products to the customer.
Flexibility means the agility of a supply chain in responding to marketplace changes to gain or maintain competitive advantage. Costs means the costs associated with operating the supply chain and the supply chain asset management means the effectiveness of an organization in managing assets to support demand satisfaction. This includes the management of all assets: fixed and working capital.
3.1. Supply chain sustainable performance estimation method
Sustainability includes economic, environmental and social viewpoints. The metrics describes the selected performance attributes. Most important criteria in metric selection process have been usability, general acceptance and ability to collect data. That is why amount of carbon dioxide emissions in the sc (g), energy usage in the sc (kW), and number of countries impacted by the sc. The method is intended to improve individual supply chains and for estimating effects of changing supply chain strategies. The method is not suitable for comparing unaffiliated supply chains without standardizing metric definitions.
Most of the attributes of the SCOR-model are financial while social and environmental viewpoint are missing. For improving sustainability Because of that it do not cover well sustainability do not include so many measures from all the tree elements of the sustainability.
Table 2. SCOR based supply chain sustainable performance estimation method
re li ab il it y re spo nsi ve ne ss flex ib il ity cost s asse ts su st ai na bi li ty
perfect order fullfillment x
order fullfillment cycle time x
upside supply chain flexibility x
upside supply chain adabtibility x
downside supply chain adabtibility x
supply chain management cost x
cost of goods sold x
casg-to-cash cycle time x
return on supply chain fixed assets x
return on working capital x
carbondioxide emissions x
energy use x
number of impacted countries x
4 CASE STUDY
The aim of the case study was compare effects of replacing disposable transportation box system with recyclable box system to the sustainable performance of the supply chain. Transportation box means a box where consumer packed products are placed during transportation, order collection and sorting. Transportation boxes are piled to the pellets during the transportation. The case supply chain is a middle-sized Finnish food supply chain. The data were collected from source, make, planning, deliver and return processes [13]. Case study is limited to supply chain processes from box production to box recycling / deteriorating processes.
4.1. Data collection and analysis
The collected data in both scenarios included e.g. boxes’ producing, self-life and destruction information and also dimensions, volume, capacity and palletizing information. Information was collected from the producing, packing, box labeling, box sourcing, planning and management.
Collected information included also distances, and transportation capacity and shares and route information in the supply chain between box supplier, factory, warehouse, terminal, market, washing department, destroying, and box storage. Data was inserted into MS Excel-based data sheet. Many input values included uncertainty. This was taken into account with a Monte Carlo based Crystal Ball MS Excel add-in tool. The Crystal Ball allows to set distributions values as and application runs a simulation and gives distribution graph as a result.
Table 3 expresses the basic mathematical formulas and units of the outputs of the case. Most definitions in the case are adapted from the SCOR [13]. This paper introduces a method for comparing alternative scenarios it is necessity to use same definitions in the same case. Because all the limitations and definitions are not expressed in this paper, results are not comparable to the other cases.
Table 3. Metric definitions
perfect order fullfillment % (Perfect Orders) / (Total Number of Orders) x 100%
order fullfillment cycle time days Order Fulfillment Cycle Time= (Sum Actual Cycle Times For All Orders Delivered) / (Total Number Of Orders Delivered)
upside supply chain flexibility
days
Total elapsed days between the occurrence of the unplanned event and the achievement of sustained plan, source, make, deliver and return performance. Note: Elapsed days are not necessarily the sum of days required for all activities as some may occur simultaneously. Upside Source Flexibility: The number of days required to achieve an unplanned sustainable 20% increase in quantity of raw materials. Upside Make Flexibility: The number of days required to achieve an unplanned sustainable 20% increase in production with the assumption of no raw material constraints. Upside Deliver Flexibility: The number of days required to achieve an unplanned sustainable 20% increase in quantity delivered with the assumption of no other constraints. Upside Source Return Flexibility: The number of days required to achieve an unplanned sustainable 20% increase in the return of raw materials to suppliers. Upside Deliver Return Flexibility: The number of days required to achieve an unplanned sustainable 20% increase in the return of finished goods from customers.
upside supply chain adabtibility
%
Adaptability measures are based on the actual number of returns compared to the maximum number of returns which can be achieved within 30 days. The weakest component determines the overall volume Note: The calculation of Supply Chain Adaptability requires the calculation to be the least quantity sustainable when considering Source, Make, Deliver and Return components. Upside Source Adaptability: The maximum sustainable percentage increase in raw material quantities that can be acquired/received in 30 days. Upside Make Adaptability: The maximum sustainable percentage increase in production that can be achieved in 30 days with the assumption of no raw material constraints. Upside Deliver Adaptability: The maximum sustainable percentage increase in quantities delivered that can be achieved in 30 days with the assumption of unconstrained finished good availability.Upside Source Return Adaptability: The maximum sustainable percentage increase in returns of raw materials to suppliers that can be achieved in 30 days with the assumption of unconstrained finished goods availability. Upside Deliver Return Adaptability: The maximum sustainable percentage increase in returns of finished goods from customers that can be achieved in 30 days.
downside supply chain adabtibility %
Least quantity reduction sustainable when considering all components. Current elements needed to fully understand future requirements, to establish the volume delta that can be sustained based on the question “How much of a reduction in quantities sourced (expressed as a percentage) can the company sustain, given 30 days?”
supply chain management cost €
order management costs + material acquisition costs + inventory carrying (Indirect Plan) costs + planning/finance costs + and information technology costs (Indirect Enable) costs
cost of goods sold € TSCMC = Sales – Profits – Cost to Serve (e.g., marketing, selling, administrative)
casg-to-cash cycle time days Cash-to-Cash Cycle Time = Inventory Days of Supply + Days Sales Outstanding – Days Payable Outstanding return on supply chain fixed assets
%
Return on Supply Chain Fixed Assets = (Supply Chain Revenue – COGS – Supply Chain Management Costs) / Supply-Chain Fixed Assets
return on working capital % The excess of current assets over current liabilities, representing the funds available for financing business activities carbondioxide emissions eqv. carbon dioxide emissions = (distance)*(emission per unit km/vehicle) * (share of the product under study of the load) energy use kW energy use of the process * time to used to the process per unit
number of impacted countries pcs. Number of countries where 90% of the raw materials are sourced, where wastes are placed, products are stored or produced waste kg amount of product per year * share of destroyed of lost goods
Data was collected from ERP systems, personnel interviews, expert discussion panel, general databases (e.g. emissions per vehicle type), and accounting system. In the case of uncertainty input information is replaced by estimation. Some input data is expressed as a distribution.
4.3. Results
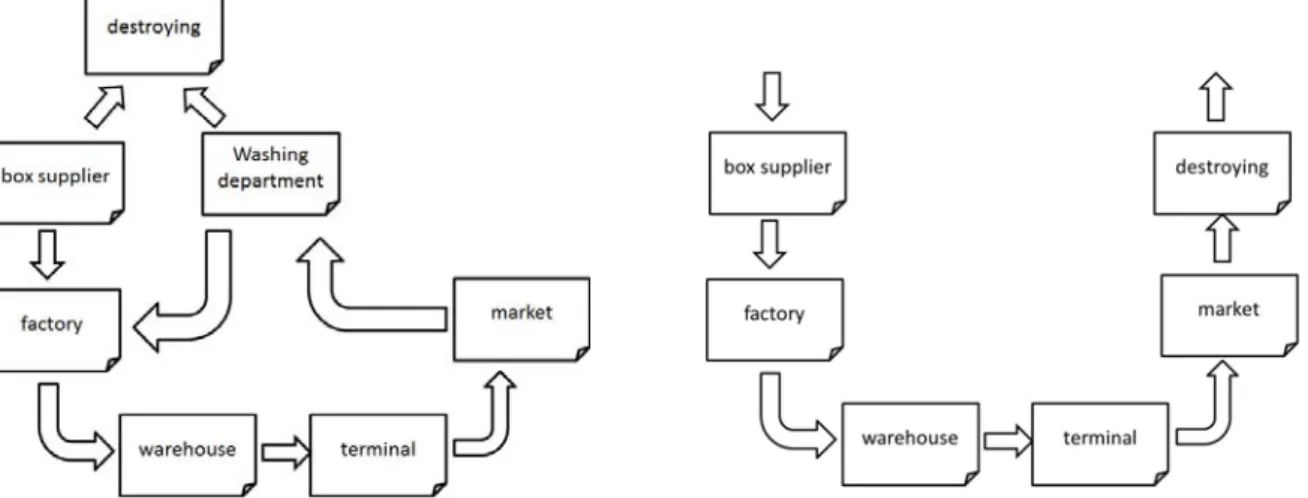
Change of the transportation box system changed many operations in the supply chain (figure 2). Disposable transportation (DB) box goes destroying or recycling from markets but recyclable box (RB) washing and returning is completely new process in the supply chain. Probably there are need for new dirty and clean box transportation routes, but at the same time some recycling flow will decrease. Washing process, not only transportation from markets to factory via washing department, will need water and energy but also personnel hours.
Figure 2. Case scenarios recyclable RB (on the left), and disposable transportation DB (on the right) boxes
Number of boxes needed and box warehousing space and conditions are different in the case of RB. RB system needs new investment, but also improves traceability and delivery reliability. Customer order collection and identification, box preparing process, packing, unpacking and sorting operations. Systems cause different effects in production and destroying stages also. Even if the boxes do not have same capacity measured with number of the case products. RB’s need more space in the vehicle but it is possible to make higher piles with recyclable boxes in the case study than with disposable boxes. RB and DB systems have some differences in the ability to protect products quality. RB protects products better from shocks and getting lost but DB system keeps temperature more stable.
For example things mentioned before cause changes in the sustainable performance of the supply chain. Table 3 is an example of the results of the sustainable supply chain performance metrics.
Table 4. Example of the case supply chains’ sustainable performance re cycl ab le bo xes ( R B ) di spo s ab le bo xe s (D B ) c h an ge %
perfect order fullfillment 78 72 % 8
order fullfillment cycle time 18 19 days -5
upside supply chain flexibility 60 84 days -29
upside supply chain adabtability 35 33 % 6
downside supply chain adabtibility 22 20 % 10
supply chain management cost 8 5 % 60
cost of goods sold 75 78 % -4
casg-to-cash cycle time 51 55 days -7
return on supply chain fixed assets 12 11 % 9
return on working capital 10 9 % 11
carbondioxide emissions 5 6 eqv./product -17
energy use 0,95 1 kWh/product -5
number of impacted countries 3 2 pcs. 50
waste 0,1 0,15 kg -33
Sustainable performance of the transportation box system mostly depends on the possibilities to integrate current systems in the supply chain and operative infrastructure, materials used in the boxes. Most important individual things effecting to the sustainable performance were how and where box returning washing systems were organized and how well was possible to take advantage of the existent routes and increase the load capacity.
5 CONCLUSIONS
Sustainable development is needed from everywhere. Also companies need to carry their company responsibility. Different size companies in different industries need different ways to improve their sustainable performance. They need tools for setting sustainable goals and measuring their performance.
This research introduced a SCOR-based method accomplished with few sustainability metrics. The introduced method was used in the case study. The case study gave encouraging results. The case showed that sustainable supply chain performance estimation method gives information what helps management to see a bigger picture of the supply chain performance and develop supply chain toward more sustainable future. Performance is complex and dynamic term. At the same time some kind of performance can improve while some other kind of performance may get worse.
References
[1] Gunasekaran, A.; Lai, K-H.& Cheng, T C E., 2008. Responsive supply chain: A competitive strategy in a networked economy. Omega, 36 (4), 549.
[2] Gunasekaran, A; Patel, C., & McGaughey, R. E., 2004. A framework for supply chain performance measurement. International Journal of Production Economics, 87(3), 333-347.
[3] Gunasekaran, A. & Kobu, B., 2007. Performance measures and metrics in logistics and supply chain management: a review of recent literature (1995-2004) for research and applications. International Journal of Production Research, 45(12), 2819.
[4] Giannakis, M., 2007 Performance measurement of supplier relationships. Supply Chain Management, 12(6), 400-411.
[5] Ritchie, B & Brindley, C., 2007. An emergent framework for supply chain risk management and performance measurement. The Journal of the Operational Research Society: Risk Based Methods for Supply Chain Planning and Management, 58(11), 1398-1411.
[6] Gaiardelli, P.; Saccani, N., Songini, L., 2007. Performance measurement of the after-sales service network-Evidence from the automotive industry. Computers in Industry, 58(7), 698. [7] Jeong, J. S., Hong, P., 2007. Customer orientation and performance outcomes in supply chain management. Journal of Enterprise Information Management, 20(5), 578-594.
[8] Seeking modern financial tools, 2009. Industrial Engineer, May 1, 14. http://www.proquest.com/ (accessed August 4, 2009).
[9] Berrah, L., Clivillé, v., 2007. Towards an aggregation performance measurement system model in a supply chain context. Computers in Industry, 58 (7), 709.
[10] Grosspietsch, J., Swan D., 2009. TRANSFORMING YOUR SUPPLY CHAIN. Supply Chain Europe, May 1, 14. http://www.proquest.com/ (accessed August 4, 2009).
[11] Hutchison, P., Farris M., Fleischman G., 2009. Supply Chain Cash-to-Cash: A STRATEGY FOR THE 21ST CENTURY. Strategic Finance 91, no. 1, (July 1): 41-48. http://www.proquest.com/ (accessed August 4, 2009).
[12] Supply Chain Council, 2009. Supply Chain Operations Reference Model Version 8.0 SUPPLY CHAIN STANDARD: Take the green route out of the red. 2009. Logistics Manager, May 1, 28. http://www.proquest.com/ (accessed August 10, 2009).
[13] Forsman- Hugg, S.; Paananen, J.; Isoniemi, M.; Pesonen, I.; Mäkelä, J; Jakouo, K., Kurppa S. Laatu- ja vastuunäkemyksiä elintarvikeketjussa. 123 pg. http://www.mtt.fi/met/pdf/met83.pdf
[14] Wiedmann, T., Lenzen M., Barrett J., 2009. Companies on the Scale: Comparing and Benchmarking the Sustainability Performance of Businesses. Journal of Industrial Ecology 13, no. 3, (June 1): 361. http://www.proquest.com/ (accessed August 10, 2009).
[15] Ganesan, S., George, M., Jap, S., Palmatier, R., & Weitz, B., 2009. Supply Chain Management and Retailer Performance: Emerging Trends, Issues, and Implications for Research and Practice. Journal of Retailing: Enhancing the Retail Customer Experience, 85(1), 84-94. Retrieved August 4, 2009, from ABI/INFORM Global. (Document ID: 1661447601).
[16] Bolstorff, P. & Rosenbaum, R., 2003. Supply Chain Excellence: A Handbook for Dramatic Improvement Using the SCOR Model. Journal of Supply Chain Management, 39(4), 38.
![Figure 2. SCOR is organized around five major management processes [12]](https://thumb-eu.123doks.com/thumbv2/5dokorg/3688843.45838/3.892.120.768.339.555/figure-scor-organized-major-management-processes.webp)