1 | P a g e
Distributed underwater
sonar
Master Thesis in electronics at
Mälardalen University
Written by:
Ukrit Meesangphrao
2 | P a g e
Abstract
This thesis is focused on possibility of constructing distributed underwater sonar which has an ability to increase or decrease number of sensor elements without any modification on its hardware. Each sonar module works individually. Its synchronization and communication between modules and the image processing unit are archived by using CAN protocol. This new design concept gives several advantages over conventional design.
Only one prototype was made, but several modules must be combined in the actual application. The discussion about a complete system can be found in the future work section.
The project composes of two main parts: design and building a prototype. The testing procedure and result of both parts are described and summarized with a conclusion.
3 | P a g e
Table of contents
Contents 1 Introduction 1.1 Project Specifications………... 4 2 Backgrounds 2.1 Natural of sound and theory………... 52.2 Type of ultrasonic transducers……….. 6
2.3 Type of underwater sonar……… 6
2.4 Beam pattern of ultrasonic transmitter……… 6
2.5 Basic concept Direction of arrival(DOA)………. 7
2.6 Basic concept of Delay-And-Sum beam forming and beam steering technique………... 8
2.7 Periodic function and Polar coordinate system……… 10
3 Preliminary design and construction 3.1 Micro-controller stage……….. 13
3.2 Ultrasonic Driving stage……….. 13
3.2.1 Low voltage drive……….……….14
3.2.2 High voltage/power transformer drive……….14
3.2.3 Buck-Boost switching drive………...15
3.3 Filtering stage………. 16
3.4 High voltage analog switch and high voltage power supply………. 17
3.5 Trigger stage………... 18
3.6 Phase and amplitude calculation stage………... 19
3.7 CAN communication stage………. 22
4. Preliminary result……….. 22
5. Improved design……… 25
6. Testing result and discussion ……….. 27
7. Conclusion……….. 30
8. Future work………. 30
9. References……….. 31
4 | P a g e
1. Introduction to underwater sonar
SOund Navigation And Ranging or SONAR is a technique of distance measuring between detector and an object base on sound reflection. The distance can be calculated from propagation time and speed of sound in specific mediums. This technique is widely used in many applications, for example, obstacle detection, level measurement, distance measurement, sonar imaging, underwater navigation etc.
Inspecting objects underwater with optical devices can be done within a short range in clear water with proper light, but it is impossible to capture picture in turbid water or long range target. Since acoustic wave can travel so far in the water without significantly loss, creating underwater pictures with acoustic imaging system is an effective solution.
Sonar imaging technology can determine objects beneath water by spotting sound wave to the target and listening the echo signal in order to measure the distance. Scanning sound wave over the whole object will get data which can be converted into digital picture ,moreover; the advantage of constructing pictures base on measuring distance is dimensional result .This technology is implemented in vast underwater applications such as submarine navigation, underwater structural inspection, fish school volume measurement and etc.
The common hardware of sonar imaging technology comprises of an array of ultrasonic sensors, one central processing unit, and a display module. Signals from an array are picturized in a single controller which is designed to work with predefined number of sensors, changing size of the sensor array is almost impossible. This is where the idea of distributed sonar module comes in.
The distributed sonar module is a system that consists of a self-controlled sonar module which has its own communication hardware. Each module can drive its transmitter independently and it is able to compute an analog signal to preferred digital data before sending to computer via communication bus. This feature will open up endless possibilities for the sonar imaging application in different situation.
1.1 Project specification
The purposes of this thesis are particularly in design and implementation of a prototype array of distributed underwater sonar. The project constitutes three main parts: Transmitter circuit, Receiver circuit and CAN communication.
The concrete concept of the project is the modular design that each sonar element must has its own controller and can communicate to others via CAN protocol. The advantage of modular design over conventional one central processor is the flexibility to add or remove sonar elements easily without major modification in software. Each sensor module may has one transceiver or two separated sensors which are transmitter and receiver. These different design concepts will be mentioned in detail in section 3 Preliminary Design and Construction.
To construct a picture, each module must be able to calculate phase shift, distance, and amplitude of an echo signal. All of these necessary data will be sent to main processing unit via CAN bus.
5 | P a g e
An operating frequency of the ultrasonic sensor is one of the major concerns, high ultrasonic frequency like 100 kHz and above gives more accurate distance measurement than lower frequency; on the other hand, high frequency is more attenuated than low frequency in the same environment. This means that high ultrasonic frequency works in a short range with high accuracy while lower ultrasonic frequency can work in longer distance but less correctness.
The other issue to be considered is the availability and price of sensor. High ultrasonic frequency sensor is far more expensive and difficult to find in the market than low frequency sensor. The most common and inexpensive sensors operate at 40 kHz, it is found to be suitable for this application; therefore, it was selected. The table 1 shows specification of ultrasonic that used in this project.
Table1 Specification of ultrasonic transducer. 2. Background
2.1 Natural of sound and theory
Sound is a mechanical wave that comes from a vibration of pressure; it can travel through elastic medium such as gas, liquid or solid material. Sound wave can be reflected and attenuated by obstacle or medium during propagation.
Sound composes of frequencies, human can perceive sound in the frequency ranges of 20-20kHz, the frequency above 20kHz is called Ultrasound which is inaudible. The speed of sound depends on mediums; the properties of medium such as temperature, density, compressibility, stiffness are main factors that affect speed of sound. Sound propagates faster in solid and fluid but slower in gas, for examples: the speed of sound in dry air at 20 °C is approximately 343.2 m/s[1]while in fresh water is about 1,484 m/s[1] at the same temperature. In sea water like ocean, salinity, temperature and pressure (hence depth) play an important role in speed.
Wavelength is the distance measurement of one period of sinusoidal wave. It can be calculated by the formula below.
6 | P a g e
Where v = velocity of sound in a specific medium f = frequency
λ = wavelength
2.2 Type of ultrasonic transducers
There are two main types of ultrasonic transducer which are electrostatic type and piezoelectric type. Ultrasonic signals can also be produced from regular loudspeaker like tweeter. This report will focus only on piezoelectric type that used in the project.
The piezoelectric transducers are device that have complex impedance. Piezoelectric transmitters produce the maximum mechanical distortion when it is applied with voltage at the resonance frequency. At this point, voltage drops across the transducer is the lowest which allow the highest current feed through the sensor. On the other hand, piezoelectric receivers produce highest electric charge when receive vibration at resonance frequency.
2.3 Type of underwater sonar
As mention earlier that sonar is the equipment that uses sound to detect objects beneath water. There are two main categories of underwater sonar: Passive sonar and Active sonar.
The Passive sonar is the device that designed only for listening to the sound that generate by target itself whereas the active sonar emits pulse (ping) signal to the target and listen to an echo. There are two configurations of the active sonar in general which are 1) one sensor is used as a transceiver and 2) two sensors are used where transmitter and receiver are separated.
2.4 Beam pattern of ultrasonic transmitter
The acoustic devices radiate sound wave in a beam pattern as shown in figure 1.
Fig.1 Three-dimension of ultrasonic beam pattern [2]
The narrowest beam at the center of radiation is called main lobe, while the rest are called side lobe. They are separated by nulls. The main lobe defines the beam width of a transducer since it contains most transmit energy. Beam width is defined by the angle between half power(-3dB) of the main lobe. Beside, the beam width of transducer can be determined from the ratio of vibration element diameter to the wavelength of transmitting
7 | P a g e
sound at resonance frequency. The larger size of vibrating element compares to a wavelength of sound, the narrower the beam width. The figure 2 shows this relation.
Fig.2 Effect of wavelength and diameter Ratio on Sound Field Divergence [3]
An Ideal ultrasonic produces only main lobe but in reality, none of ultrasonic transducers can transmit a single lobe. Echo that produced from side lobe can possibly fool the correct location of an object so transducer should produce low side lobe as possible. Narrow beam width propagates longer distance than wide beam width and also gives more capability of object detection and discrimination. Since narrow beam width transmits more concentrated acoustic energy to an object, thus, more energy is reflected back.
A graphical pattern which is commonly used to describe characteristic of ultrasonic transducer is a two-dimension plots. As shown in figure 3, the main lobe is centered at 0 degree and surrounded by side lobe. Although the total beam width of the main lobe is about 70 degree, the actual beam width measured at -3dB is 30 degree.
Fig. 3 Two-dimensional plot of beam pattern [2]
It is important to select ultrasonic transducer which has appropriated beam width according to specific application. It should be noted that sensor area outside beam angle still has sensitivity, thus, undesired objects close to the target can be detected.
2.5 Basic concept Direction of arrival (DOA)
In signal processing, direction of arrival means the direction of propagated signal that arrives at a point. Considering the two sensor elements, A and B mounted on a straight line with a distance D between them, as shown in figure 4.
8 | P a g e
Fig.4 Direction of arrival geometry [4]
As seen in the picture, signal arrives both sensors at different times because it takes longer Y distance to reach sensor B than sensor A. By using a trigonometric function, unknown variables can be calculated as the following equations.
[eq. 2.5-1]
[eq. 2.5-2] [eq. 2.5-3]
where v = Velocity of sound wave in a specific medium.
= Difference of arrival time between two sensors. This technique is useful for transducer array to determine a location of sound source. DOA is related to Beam forming technique which is going to be discussed in section 2.6. 2.6 Basic concept of Delay-And-Sum beam forming and beam steering technique
Delay-And-Sum beam forming is a signal processing technique which is implemented on sensor array. It controls directivity of both radiation and reception of analytical signal. A sensor array which uses this technique is called phased array. This technique allows a group of transducers to steer transmit signal or receive incoming signals at the preferred direction without moving their position. Beam forming is widely used in numerous applications such as radar, sonar, wireless communications, microphone, loud speaker and etc. The principle of this technique based on the fact that when several transducers are formed to be an array, a signal comes from any direction will arrive each transducer at different times. Figure 5 shows this phenomenon.
9 | P a g e
Fig. 5 Signal arrive transducer at different angle.[5]
When signals that arrive each sensor of the transducer array at the same time (or they are in phase) like the one in the middle, the summation will be constructive. Therefore, the amplitude of signal is triple. But, if the DOA of incoming signal is not perpendicular to the wave front of the array, then, arrival time of signal at each sensor will be different. The summation of out-of-phase signal will be destructive or constructive. Moreover, in the case that phase shift of signals are more than 360 degree, then the array output will give a train of signal.
The differences of arrival time can be compensated by adding an individually adjustable delay unit to each transducer. Then, received signals from each sensor will have the same phase at this stage. Summing these time compensated signal will result in a particular preference signal from a chosen direction. The figure 6 shows graphical illustration of Delay-And-Sum beam forming principle.
Fig.6 The graphical illustration of Delay-And-Sum beam forming principle.[5] On the other hand, in the transmitting mode, transmitting signal can be steered to a specific direction by giving a delayed pattern to the phased array as shown in figure 7. A beam steering from linear phased array can be archived by activating each sensor with a
10 | P a g e
different delay. A transducer at far left is activated first then continuously followed by the next one at right side. Finally, the far right is the last activated one.
Fig.7 Steering beam pattern of a phased array [6]
In addition, an alternative delayed pattern can perform an electronic lens which focuses the transmitting signal to a specific point as shown in figure 8. In general, focusing and steering can be done at the same time.
Fig.8 Electronic focus of phased array [6]
There is a limitation that affect steering angle of phased array. Since energy of transmitting signal decays as the angular deviation from central axis increases, thus, limits the allowable steering angle. So, the lowest amplitude of the transmitting signal at any angle must not be lower than -6dB.
2.7 Periodic function and Polar coordinate system
Periodic function is the function that repeats again and again, it can be formulated into function under the form
[eq. 2.7-1]
Where A = Amplitude
t = time = period δ = phase shift
11 | P a g e
This equation can be transformed into another form which is easier to understand.
[eq. 2.7-2]
Where a, b = known constants
x =
Equation 2.7-2 can be transformed to equation 1 by the following steps a. Find amplitude (A)
A = [eq. 2.7-3]
b. Calculate phase shift
[eq. 2.7-4] In contrast, periodic function with unknown “a” and “b” elements can be calculated to get amplitude and phase shift by taking integration. The following computation gives an example for finding “a” element.
a. Multiply [eq.2.7-2] with
[eq. 2.7-5] b. Take an integral of [eq.2.7-5] in the range of (0 to
)
[eq. 2.7-6]
c. The derivative of
,
then[eq. 2.7-7]
d. Calculate the right part
,
= = 0
12 | P a g e
e.From the formula
[eq. 2.7-9]
[eq. 2.7.10]
f. since
and
= 0,
then[eq. 2.7-11]
The “b” element can be calculated in the same manner but multiply [eq. 2.7-2] with . Once “a” and “b” elements are known, amplitude and phase shift and be easily figured out using [eq. 2.7-3] and [eq. 2.7-4] respectively. This solution is useful in the real world application of signal processing when determine an unknown
periodic waves.
The implementation of this calculation will be discussed later in section 3.6.3. Preliminary Design and Construction
This section will describe all approaches associated with designing and construction of the first version of distributed underwater sonar; from circuit consideration, simulation, components selection to printed circuit board (PCB) making.
The first design concept of this project is to use one ultrasonic transducer as a transceiver. A transducer driver, receiving unit and all necessary circuits must be integrated on one PCB. Size of the PCB is the major concern; it has to be as small as possible since several modules will be installed to make a complete system. Below is the circuit diagram of the first version.
13 | P a g e
Fig.9 Circuit diagram of the first version
The ultrasonic transceiver which used in this project is a waterproof type, it requires140 Vp-p of driving voltage to transmit the maximum ping signal. The high voltage
analog switches were added to separate receiving unit from ultrasonic driver. Without high voltage analog switch, receiving unit will be completely destroyed by high voltage from ultrasonic driver. On the other hand, when the sensor listening to echo which are usually weak signal, analog switches make a direct path from transceiver to receiving unit without any connection to ultrasonic driver. The receiving unit must be able to remove unwanted noises and calculate phase shift thus it composes of band-pass filter, phase multiplier, integrator, analog to digital and trigger circuit. All activities of sonar module are controlled by micro-controller; synchronization between modules can be archived via CAN communication. Although each circuit was made individually at the first place in order to simplify error handling, the final design was assembled in one PCB. All electronic devices that were going to be installed on the final PCB must be SMD type to save space as much as possible.
3.1 Micro-controller stage
In this project, 8 bit micro-controller (MCU) is found to be suitable since it has several functions and plenty of I/O, beside there are varieties of MCUs available in the market with low price. One important requirement that need to be considered for selection of MCU is an integrated CAN controller because it is the communication protocol that will be implemented in this project. Choices are much narrow with this requirement, finally AT90CAN128 from Atmel was chosen.
3.2 Ultrasonic Driving stage
The ultrasonic driver is the circuit that provides pulse signal to oscillate the ultrasonic transducer. An output of ultrasonic transducer archives the maximum yield when the pulse frequency is the same as resonance frequency of transducer together with an appropriate voltage level. The maximum driving voltage of the transducer ranged from tens to around 200 volts depends on types of the ultrasonic sensor and its applications. Air ultrasonic transducers are generally required much less driving voltage level than a waterproof type.
There are several ultrasonic driving techniques available today but only three alternative driving circuits are described in this report.
3.2.1. Low voltage drive
This driving method is the most common technique because of simple construction. It works well with low power ultrasonic sensor especially air type sensors. The schematic of this circuit is shown below.
14 | P a g e
Fig.10 Low voltage drive [7]
This circuit needs an oscillator to provide frequency to input “1”. The input pulse is then separated to two branches, one branch has one step of inverting gate while another has two steps and subsequently combined together. The result is double driving voltage level compare to the input. The advantages of this circuit are low cost, very simple construction and demand a few components; however, it can deliver only low voltage/power due to limitation of devices.
3.2.2. High voltage/power transformer drive
This method is designed especially for transducers that require high driving voltage or power such as a waterproof type sensor or a huge transducer. As it is clearly stated in the name of topology, transformer is a necessary for the circuit. Calculation procedures for number of windings, core selection or losses to make a transformer will not be described in this report because it is out of concern. There are various approaches to drive primary winding of the transformer including half bridge and full bridge methods.
Fig.11 Full bridge drive [7]
Note: R1 symbolize an ultrasonic transducer which has impedance 500 ohm.
The mechanism of full bridge drive begins with V3 feed pulses to switching pair transistors Q1, Q4 and Q2, Q3 alternately. The secondary voltage depends on V1 and winding
ratio. Half bridge topology is similar to full bridge drive but requires only two transistors. The benefit of High voltage/power transformer drive is the highest power/voltage deliver ability
15 | P a g e
compare to other methods, the disadvantages are complex design, high cost and bulky size due to using of transformer.
3.2.3. Buck-Boost switching drive
This is an alternative way to provide high voltage to ultrasonic transducer; this method requires small amount of components to convert a few volts to a hundred volts. The working principle of the circuit is exactly the same as buck-boost switching converter circuit.
Fig.12 Buck-boost switching drive [7]
Current flow when the transistor is “on” increases energy which stored in the inductor. When Transistor is “off”, inductor tries to keep the flow of current by releasing energy out of the inductor. This action produces high voltage across the transducer. The good points of this circuit are low cost, simple construction and able to deliver high voltage. The disadvantage of this method is unable to drive high power transducers.
Refer to the three methods exist for driving ultrasonic transducer, Buck-Boost switching drive was considered to be better than others in regards to space saving, high voltage drive capability and simple construction. As a result, it was selected.
16 | P a g e
3.3 Filtering stage
Underwater is a noisy environment, noise sources beneath water can be swimming fish, waves hitting the shore, ship’s engine and etc. These kinds of noise can severely disturb ultrasonic receiver while receiving echo. Electronic filter is an effective solution to remove undesired signal before an amplification stage. There are generally two types of filter, an active type and a passive type which depend on electronic components that made the filters. Active filter is more suitable for this project because of small size and easy to adjust quality factor [8], moreover inductor can be avoided thus remove the possibility that inductor may pick unwanted noise.
The possible configurations of filters that can be implemented in this project are low pass filter and bandpass filter. Low pass filter attenuates all frequencies above cut-off frequency. The more frequency above cut-off frequency, the more attenuation will be. Another type is bandpass filter, this filter is designed particularly for application that need to filter all frequencies but keep only certain ranges, therefore it is considered to be suitable for this project.
An active bandpass filter MAX275 was chosen, it composes of two sections of 2nd-orders that can be cascaded to get 4th-order filter. This will be an advantage for sonar applications which need only single frequency; moreover each section has an individual gain which is adjustable by one resistor. The design instructions stated in datasheet must be strictly followed when designing the filter. The Q factor and center frequency of bandpass filter were tuned into 15 and 40 kHz respectively. It is also importance that components are selected carefully to optimize its performance. All resistors that used in the circuit must have resistance tolerance equal or less than 0.1%. The bandpass filter need to be fine tuned before using thus it was tested with function generator to see the actual ranges of allowable frequency, the result was appreciated at 38.87 kHz to 41 kHz.
17 | P a g e
3.4 High voltage analog switch and high voltage power supply
Since the transducer must be driven at high voltage (more than 100 volts). A high voltage analog switch must be installed in the circuit to protect low voltage devices in receiving unit. Most of analog switches available in the market can tolerate analog signal up to around 60 volts. Hence, they are obviously impossible to use. Fortunately, there are very few and costly high voltage analog switch that designed especially for sonar application; after all, the affordable price MAX4802 was selected. MAX4802 provides high voltage switching capability on 8 channels; its functions are controlled by serial peripheral interface (SPI).
Fig.15 High voltage analog switch, MAX4802
One problem that arises for using these devices is that the voltage supply must cover the ranges of analog signals; in this case, the positive high voltage supply must higher than 140volts (but not over 200Volts according to specification) and the negative high voltage supply connected to ground. Based on this requirement, a special high voltage power supply must be created. The high voltage switching power supply (HV power supply) for a kicking device of the soccer robot which designed by the author in the previous project was reused. It is able to supply voltage up to 350 Volts which was too high to use with MAX4802. Hence, its output voltage was downgrade to 170 Volts by reducing secondary turns of the transformer. This power supply has on/off function which can be remotely controlled from external circuit. The design procedures of high voltage switching power supply are not mentioned in this report because it is out of the project scope.
18 | P a g e
Fig.16 High voltage switching power supply 3.5 Trigger stage
The trigger stage provides an acknowledgement to MCU when echo arrives the transducer. This stage is importance since it will activate the following circuits which are phase multiplier and analog to digital converter at the arrival of echo. Any false triggering will give wrong phase shift and ADC value.
The circuit composes of simple single comparator LMV331, its reference voltage was shift to 0.2 Volt above ground to avoid noise interferences which can make false triggers. The comparator was used in an open loop configuration (amplify with the maximum gain), thus input signal will be converted to square wave. The picture below shows the schematic the of trigger stage.
Fig. 17 Trigger stage 3.6 Phase and amplitude calculation stage
This signal processing stage is the most complexity and also the key of distributed underwater sonar application, it is responsible for phase calculation. When echo arrives receiving circuit, it will be multiplied with or . This depends on which elements (a or b) is going to be computed. The result will be integrated by integrator afterward. The multiplication process is archived by using synchronous detector while using a simple
19 | P a g e
lowpass filter as the integrator; this will emulate mathematical calculation mentioned earlier in section 2.7. The building block of operation is shown in fig.18
Fig.18 Block diagram of a synchronous detector.[9]
An important aspect of the synchronous detector is the production of sine and cosine reference frequencies which are the same as the frequency that drive the ultrasonic driver. These two forms of reference frequency must be carried out before working on synchronous detector; therefore some components are added to the circuit. Figure 19 shows frequency division and phase shifter circuit. The 80kHz produced from MCU is fed in to Clk pin of D flip-flop(IC3) which pin D is connected to invert output terminal (not Q) giving a feedback path, the input frequency is divided by two at this stage, hence output frequency at is 40kHz, it will be used as the sine reference frequency and also for ultrasonic driver. The 40 kHz is then connected to phase shifter which is XOR gate (IC4), another XOR input is connected to 80kHz giving the same 40kHz frequency at the output but 90 degree phase shift. This frequency will be used as the cosine reference frequency. The synchronous detector also requires inverting of sine and cosine reference frequency which are archived by logic inverter (IC5 and IC6).
20 | P a g e
Fig.20 Complete circuit of phase and amplitude calculation stage which compose of synchronous detector, integrator and analog to digital converter.
The schematic of synchronous detector which shows in figure 20 composes of an ADG411R (IC1) quad analog switches, OPA134 (IC8) ultralow distortion op-amp, LF412D (IC10) dual op-amp, MC1522TT(IC12) 2.5 volt precision voltage reference and MCP606 general purpose op-amp. To calculate “a” element, the sine form reference frequency and its inverting are connected to control pins of (IC1D) and (IC1C) respectively, the output of these two switches are connected to summing amplifier (IC3B). At this point a 2.5 volt precision voltage reference (IC4) is added in order to offset the output; this method will allow the calculation of phase shift over four quadrants. Switches will be activated and deactivated at the rate of reference frequencies; therefore incoming echo will be multiplied with the gain 1 and -1 depending on the switch state. The output signal then go through integrator (R36, C20), resulting in “a” elements. The magnitude of integrator output will determine quadrant, if an average output voltage is above 2.5 volt means that it can be in quadrant 1 or 4, but if it is lower than 2.5 Volt the quadrant will be 2 or 3. The final decision on quadrant will be upon the magnitude of “b” element. Calculation process of element “b” can be done with the same procedures.
The figure 21 shows the relationships between phase shift and output waveform of synchronous detector. When echo and reference frequency are in phase, high potential DC term (above reference voltage for 0 degree and below reference voltage for 180 degree)
21 | P a g e
dominate the output. The amplitude of output signal is directly proportional to the strength of echo. When echo and reference frequency are 90 or 270 degree out of phase, the DC term at the output will be absolutely canceled.
Fig.21input and output signal of synchronous detector [10]
The last part of this stage is the digitization; the voltage at the output of integrator is sampled by two external 10 bits ADCs. The digitized data will be sent to MCU via SPI communication. Finally, MCU will send these data to the main processing unit of the system (e.g. computer) via CAN bus.
The simulation of this stage was tested in Multisim before making a test on real PCB in order to confirm its function. The result of the simulation showed that the circuit was able to determine phase shift in the ranges of 0 - 360 degree. Once the simulation is completed, a sample PCB was constructed and tested with a function generator, only an “in phase” condition (0 or 360 degree) can be tested because the function generator cannot change phases. The result is shown in figure 22.
22 | P a g e
3.7 CAN communication stage
CAN protocol is a real time communication which is widely used in automotive applications, industrial automation, communication systems and etc. There are a number of benefits of using CAN bus, while; only some prominent features are given in this report. CAN are inexpensive, reliable, and durable network. The CAN bus is a broadcast bus, all devices can see all messages and can decide which one should be accepted or rejected. CAN protocol use an intelligent bit-wise arbitration method to manage the bus accessibility, so each message is assigned with a unique identifier which also defines its priority. Higher priority messages have rights to transmit before lower priority. This method can avoid data collision and satisfy the requirement of real-time communication.CAN provides high speed transmission up to 1 Mbit/sec
Even though AT90CAN128 has built in CAN controller, it requires CAN driver to interface with CAN physical bus. A CAN controller interface PCA82C250T was selected. To avoid damage from transient voltage that can be induced on the bus, high speed opto-couplers are deployed to separate CAN devices from physical bus.
Fig.23 CAN circuit 4. Preliminary result
This section describes the integration of all stages that mentioned in the section 3 as well as the testing result and problems from the first version of distributed underwater sonar.
After each stage was constructed and tested, they were assembled to make a testing prototype. Apart from the circuits that mentioned in section 3, a readymade motor controller board which had been designed for soccer robot “SAGA” by the author was reused. It composes of AT90CAN128 MCU with available I/O connectors and CAN communication module. This could save a lot of time because making PCBs are considered to be one of the most time consuming task.
23 | P a g e
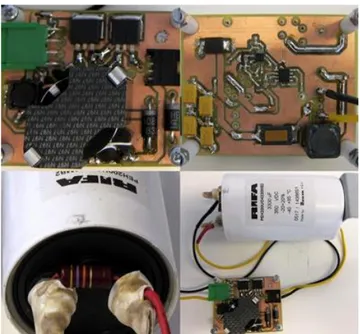
Fig. 24 The assembly of the first prototype (high voltage switching power supply and battery were placed under the plastic plate)
All the circuits are supplied by eight cells of Li-Po battery for portable purpose. The first problem that came up at the very beginning of the test was the strong electromagnetic interference from HV switching power supply. The analytical signal at the output of bandpass filter was completely destroyed while running the HV switching power supply. The first idea to solve the problem was to limit electromagnetic emission by covering the HV power supply with metal sheet. This attempt was found to be inadequate since it was not possible to cover the whole circuit due to wiring connection to other PCBs. Therefore, the best way to get rid of this problem is to stop the operation of HV power supply when the distributed underwater sonar is running. Since the HV power supply can be controlled remotely by an external circuit, one output of MCU was assigned to do the task. To archive this solution, the HV power supply charges the output capacitor (a white capacitor in figure 16 in sections 3.4) until its voltage reaches 170 volts. Then, disable the HV power supply before activate the distributed underwater sonar. In this case, the output capacitor will act as a temporally battery that supply the high voltage analog switch. One thing that needs to be concerned when select the output capacitor is the capacity. The capacity must be large enough to store electric charges for one operation of the sonar but not too oversize since the charging time depends on the capacity which means that a large capacitor requires more charging time than a smaller one. In addition, a huge fully charged capacitor can be very dangerous if a person accidentally touch its connection.
Although the second solution gives ultimately smooth high D.C. voltage and also no interference originated from HV power supply, other three problems occur.
The first one is the remote control function of the switching controller IC of HV power supply cannot handle continuously transition between on and off. During the test, MCU altered on and off state at the speed 1 time per second, it could run for some amount of time before collapsed. Since there was no spare at the time, it takes couple of days to reorder a new one.
24 | P a g e
The second problem is a ringing phenomenon of ultrasonic transducer. Ideal ultrasonic transducer will oscillate when alternate voltage is applied and stop vibration immediately when power removed. However, real ultrasonic transducer does not have the same characteristic as the Ideal. Transducer still vibrates for a short period after excitation ceases. This unwanted occurrence is called ringing. Ringing is the main factor that limits the minimum distance between transducer and an object. At the same time, ringing is considered to be a kind of noise. If an analog switch which connects between transducer and the receiving unit turns on immediately after pinging, ringing will be the first signal that enters the receiving unit. This will cause a false triggering which generates wrong calculation. This problem can be fixed by putting some delays that long enough to get rid of ringing noise before switching on the analog switch.
Fig.25 Ringing of ultrasonic transducer
The third problem is a ringing phenomenon of high voltage analog switches MAX4802. This problem is similar to the ringing of ultrasonic transducer; however, it comes from analog switch itself. Every time when switch changes state from off to on and Vice Versa, it generates small ringing which has almost the same size of amplitude as incoming echo. Thus, the trigger stage considers it as a preferred signal and makes false triggering. It should be noted that it is not the case that the bandpass filter will remove ringing noise because high voltage analog switch is located after the filter. This problem is neither mentioned in its datasheet nor any electronic forum.
These are the major problems which make full functional testing impossible. Finally, this version of distributed underwater sonar is determined to be unqualified.
25 | P a g e
5. Improved Design
The first version of distributed underwater sonar is suffered from the problems that mentioned in section 4. The major modification of the second version associated with a new design concept which separates the transmitter and the receiver. This means that another ultrasonic transducer must be added to the circuit. Noise interferences from surrounding environment and the circuit itself become an important issue that needs to be carefully concerned. The circuit diagram of the second version is shown below.
Fig 26 Circuit diagram of the second version.
The first issue to be solved was to remove the critically imperfect high voltage analog switch and high voltage power supply stage. Thus, the flow of analog signals must be redesigned. As seen in the figure 26, the transmitter and the receiver are completely separated so that the internal interferences which occurred when using one sensor as a transceiver are greatly reduced. Defects of each stage were clarified and fixed. The first version was divided into several PCBs which founded to be difficult to assemble into a complete module. Besides, long and messy cables are susceptible to noises and also made a lot of confusion to the tester, many components burnt or broken during the test because of this error. Therefore, the second version was decided to be constructed in one PCB as shown in figure 27
26 | P a g e
The noise immunity was improved by grouping analog devices separately from digital devices; moreover, an analog ground plane which was placed on both side of the PCB covers the whole area of analog circuits.
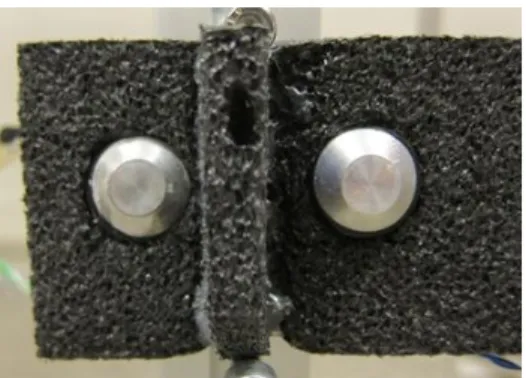
Once the manufacturing of the new distributed underwater sonar was finished, its functional testing was conducted. The receiver and transmitter were mounted on a sponge. Since sponge can absorb vibration, so vibration from the transmitter is not directly transmitted to the receiver. Moreover, a piece of sponge is placed between the two transducers in order to be sure that interference does not come from the transmitter.
Fig.28 Installation of the transducers.
At the beginning, an unshielded twisted pair cable (CAT5 cable) was used to carry analog signal between the transducers and the distributed underwater sonar module. It was discovered that electromagnetic radiation from the transmitter coupled to the receiver cable. This kind of noise has much higher amplitude than preferred signal and it cannot be rejected by the bandpass filter since it has the same 40 kHz frequency. To solve this, the receiving transducer’s cable was replaced by a shielded cable. A termination of shielded cable was attached to the analog ground plane as shown in figure 29.
Fig. 29 a termination of shielded cable attached to analog ground plane.
It should be noticed that braid or metal foil that cover the cable must not be twisted together (pigtail). The single point terminations like pigtail can act as a noise receptor or radiator. It also forces shield current to flow unsymmetrical which result in increasing the transfer impedance [11]. These defects from pigtail termination can generate worse interference.
The using of shielded cable brought a better result; the interference in receiving cable was significantly reduced but not completely removed. It is very important to reject all unwanted signals that enter to the receiver unit before echo. Thus, a single analog switch B
27 | P a g e
was added to the receiving unit as seen in the figure 26. The analog switch was controlled to be activated after finish pinging for 1 millisecond. This delay limits the minimum allowable distance between object and transducer. The figure 30 expresses a comparison of the circuit without analog switch (on the left) and with analog switch (on the right).
Fig. 30 Comparison of the circuit without analog switch (left) and with analog switch (right). The channel 1 represents a ping signal while Channel 2 represents a signal at receiver. 6. Testing result and discussion
When the hardware and the embedded software of distributed underwater sonar were ready, the tests were carried out in air at the first place. At this point, the reference voltage of the trigger circuit, the gain of bandpass filter and the amplifier stage were fine tuned as well as the Software code for MCU.
At the beginning, the underwater testing was planned to do in the lake Mälaren but it was canceled due to lack of 220 volts supply and difficulty of moving the equipments. An oscilloscope is required to check weather incoming signal is an echo or noise. Therefore, the test was finally set up in the pool in the university. The water depth is around 40 cm. which is considered to be very shallow. The sonar module was placed 1 meter against the pool’s wall. The elevation of the transducer was set at half of water depth or 20 cm. The first problem that found was an noisy interference came directly from the transmitter. The noise was last longer and also the amplitude was much bigger than testing in air. A solution to this problem is to increase delay of the single analog switch B from 1 millisecond to 1.4 milliseconds. Thus, this will increase the minimum distance between object and the transducer from 74.2 cm to 103.8 cm (Note that: sound velocity in fresh water is 1484 m/s [1]). Once the first problem was cleared, another one came out which is the underwater ambient noise. The continuously and randomly short pulses of 40 kHz ambient noise brought about false triggering to the sonar module. The amplitude of ambient noises was varied; some were small and not affected the trigger circuit while some were big enough to activate triggers. The reference voltage of the trigger circuit was changed several times to solve the problem, however, the higher reference voltage decreases echo detection distance. Beside, for several times, the noise amplitude was about the same as echo. The source of the ambient noise may originate from water flow or overflow water that falling from the pool above. There are two important factors affected to the result which is depth of the pool and material of the pool’s floor. Since the pool is very shallow, so noises that generated underwater will reflect back and forth between water surface and the pool’s floor more frequently. Also, the floor is made of concrete tiles which are a good sound reflective material; therefore, ambient noise in the pool is severe.
Because of the problems and difficulties stated above, the test was decided to do in air only. Thus, delay of the single analog switch B was set back to 1 millisecond. The first function to be tested was a time of flight measurement. The sonar module was set up against wall at different distances started from 90 cm. and gradually increased the distance by 10 cm.
28 | P a g e
for each test up to 120 cm. For the elevation, it was set up150 cm. above floor. The transmitter emitted 20 cycles of 40 kHz burst which equal to 0.5 milliseconds. The time of flight is measured by timer 1 of MCU, It starts counting at the falling edge of the last cycle of burst. The counter’s value is kept in a register when echo arrive the receiving unit which is acknowledged by an activation of an external interrupt 0. The timer 1 continuously runs until ADC finish sampling then stop. The time of flight, “a” and “b” elements are sent to computer via CAN bus. A laptop interfaces with CAN bus by using a CAN to USB converter “Kvaser leaf”. The test results are shown in table 2
Actual distance (Centimeter)
Time of flight (round trip) (Millisecond) Measurement result (Centimeter) 90 4.91 84.25 100 5.5 94.38 110 6.24 107.07 120 6.76 116
Table 2 Distance measurement using time of flight Note: The speed of sound in air is 343.2 meters per second [1]
As can be seen in the table 2, small deviations between actual distance and the measurement result are considered to be acceptable. The changes of phase can also be seen during the test. However, the distances between wall and sensors were not guaranteed to be exactly at 90, 100, 110, 120 cm. Since the speed of sound in dry air at 20 °C is 343.2 meters per second [1], thus the wavelength of 40 kHz ultrasound is equal to 8.58 mm. The changing of the distance by 1 mm will cause phase difference equal to 41.958 degree; therefore, special equipment is needed for precise measurement. The Figure 31 shows the arrangement of the test set up.
Fig.31 An arrangement of test set up
Considering the round trip of ping signal, if the position of the object (plywood) changes 1 mm, then the travelling distance of sound will differ 2mm. or equal to 83.916
29 | P a g e
degree phase shift. This means that phase shift will be 360 degree (in phase again) when the object is moved 4.29 mm from its origin. The object was placed at 100 cm and 120 cm from sonar module and measured phase shifts. The result is shown in table 3 and 4 respectively.
Table.3 The object placed at 100 cm. from sonar module
Note: Lead = echo waveform is advanced relative to transmitting signal Lag = echo is delayed relative to transmitting signal
Table.4 The object placed at 120 cm. from sonar module
Note: Lead = echo waveform is advanced relative to transmitting signal Lag = echo is delayed relative to transmitting signal
The position “1”in table 3 and 4 is the starting position of the object while position “2” to “5” represents the next position which is consequently moved from the original (position “1”). The distance between two adjacent positions is 1 mm and the total distance from the first position and the last one is 4 mm. The results show that the sonar module is able to calculate phase shift and amplitude from incoming echo. The possible reasons of differences between actual phase shift and preferred phase shift may come from human error when looking at the ruler scale or thecircuititself.
30 | P a g e 7. Conclusion
This project introduces the distributed configuration of an array of underwater sonar in which each sonar module has its own controller and CAN communication interface. Beside, it is capable to calculate time of flight, phase shift and amplitude of incoming echo. This new platform gives an opportunity to increase or reduce number of ultrasonic sensors in an array without major modification to the whole system.
The work on this project begins with studying the principles of sonar especially an active type as well as analyzing the construction detail of exists under water sonar. The following stages are designing, making a prototype and testing. The designs of complex circuit such as phase and amplitude calculation stage and the ultrasonic driver were simulated before making PCBs. The implementation of the first prototype which has only one sensor as a transceiver was unsuccessful since the HV power supply and high voltage analog switch has some drawbacks. The second prototype was developed base on a new conceptual design which is a separation of transmitter and receiver, thus two sensors are required. Some improvements also added to the new prototype.
Although the current version of distributed underwater sonar cannot be tested in the water, the result obtained from testing in air show that it is fulfill the initial specifications. The improvement of the final prototype will be a major step towards to the complete system.
8. Future work
Although the single module of the distributed underwater sonar works fine, it is not capable to construct underwater picture. In order to make a practical system, integration of several transducer modules as well as an image processing software, communication interface between transducer modules and the main processing unit must be developed. Once the complete system is ready, a fully test should be conducted in an open water such as Lake Mälaren or at least the standard swimming pool for more accuracy and credible result.
The accuracy of analog to digital converter units can be improved without the need of software compensation by adding precision 5 volts reference voltage instead of using the main power supply which is not accuracy.
Finally, the size of each module can be reduced by using 4-layers PCB and removing or reducing size of big components such as DE9 connector, inductor. Also, each transducer module has to be installed in a watertight enclosure. In addition, the layout of the PCB can be improved to reduce noise reception and radiation which will improve overall performance of the circuit.
31 | P a g e 9. References [1]. [ http://en.wikipedia.org/wiki/Speed_of_sound ] [2]. [http://www.massa.com/fundamentals.htm] [3]. [http://www.ndt.net/article/wcndt00/papers/idn151/idn151.htm] [4]. http://www.labbookpages.co.uk/audio/beamforming/fractionalDelay.html [5]. [http://www.labbookpages.co.uk/audio/beamforming/delaySum.html] [6]. [http://www.ndt.net/article/wcndt00/papers/idn151/idn151.htm] [7]. [http://www.ee.latrobe.edu.au/~djc/UltraSonics/Ultrasonics.htm] [8]. [http://en.wikipedia.org/wiki/Active_filter] [9]. [http://www.cappels.org/dproj/selflocksyncdet/Synchronous_Detector.html] [10]. [http://libinfo.uark.edu/aas/issues/1991v45/v45a20.pdf]
[11]. Electromagnetic Noise Reduction Strategies forCable Systems
,
Richard J. Hare #1, Arthur T. Bradley *2, Linda Vahala #3#, Electrical and Computer Engineering, Old Dominion UniversityHampton Boulevard, orfolk VA 23529, USA32 | P a g e 10. Appendix
Improved Version Schematics
- Microcontroller and JTAG connector
33 | P a g e
- Phase and amplitude calculation stage
34 | P a g e
- Trigger circuit
- Ultrasonic driver and single analog switch A
35 | P a g e
![Fig. 3 Two-dimensional plot of beam pattern [2]](https://thumb-eu.123doks.com/thumbv2/5dokorg/4826031.130075/7.892.290.602.171.401/fig-dimensional-plot-beam-pattern.webp)
![Fig. 5 Signal arrive transducer at different angle.[5]](https://thumb-eu.123doks.com/thumbv2/5dokorg/4826031.130075/9.892.246.691.119.441/fig-signal-arrive-transducer-at-different-angle.webp)


![Table 2 Distance measurement using time of flight Note: The speed of sound in air is 343.2 meters per second [1]](https://thumb-eu.123doks.com/thumbv2/5dokorg/4826031.130075/28.892.96.770.283.479/table-distance-measurement-using-flight-note-meters-second.webp)
