Location choices of the Creative
Class in Finland with a special
focus on Helsinki
JMYD29V12 Master Thesis in Economics (Two Years) Author: Veronica Fossa
Tutors: Charlotta Mellander, Özge Öner, Pia Nilsson Jönköping, September 2012
Acknowledgements
This thesis is the product of an intense time spent in Helsinki, amongst people who like me are in love with this city and believe in its potential. Thanks to this thesis and the interviews I conducted I managed to meet many of these people who have been really helpful for my research and have allowed me to discover hidden gems and see Helsinki with new eyes.
My thanks go to Professor Charlotta Mellander, my supervisor, who has kept my feet in the ground and always reminded me what economics is about. Also has provided an organized structure to my work when my diffusive writing style had taken me too far away. PhD candidate Özge Öner, also my supervisor, for her guidance, especially on the quantitative part.
Research Director oft he IDBM program Toni-Matti Karjalainen from Aalto Uni-versity School of Economics for his precious comments and insights about crea-tivity in Helsinki; Researcher Miikka J. Lehtonen from Aalto University School of Economics, for the brainstorming on the blackboard when I felt really lost, Aku Alanen from Statistics Finland for the encouragement to keep on working with figures and his in depth knowledge about the creative sector in Finland.
I want to thank my parents and my brother for their endless support, emotional and financial, despite the big distance that separates us. My parents, Maurizia and Antonino, have always encouraged me to study, take challenges and ex-plore the world even though this would have meant to have their daughter far away from them.
Last but not least, I am very grateful to my friends in Sweden for the great time spent with them at Jönköping International Business School. They have enri-ched my life with new experiences, knowledge and fun. A big thank also goes to my friends in Finland for the time spent at “kauppis”, the endless writing process at Aalto Hub and the great time spent together exploring Helsinki.
JMYD29V12 Master Thesis in Economics (Two Years)
Title: Location choices of the Creative Class in Finland with a special focus on Helsinki.
Author: Veronica Fossa
Tutor: Charlotta Mellander, Özge Öner, Pia Nilsson
Date: [2012-09-04]
Subject terms: creative class, human capital, cities, Finland, Helsinki, knowledge concentration
Abstract
We are currently living in an age of creativity, in which new economic realities based on knowledge and embracing new technologies and new ways of pro-duction are emerging. Hence, cities around the world compete in order to attract and retain the highly educated and talented individuals who drive these activi-ties, establishing the so-called creative class. Few studies have investigated the location of the creative class in Finland although many studies regarding Ameri-can and European cities are available. Presently, with great attention drawn to Helsinki due to appointment by the International Council of Societies of Industri-al Design (ICSID) as World Design CapitIndustri-al 2012, a study related to the location choices of the creative class in Finland and especially Helsinki is worth conduct-ing.
The first part examines the knowledge concentration in Finland showing that the educated people are mostly concentrated in the south of the country where the biggest cities are also located. However, in Finland although talent is positively related to the size of the municipalites, many small towns manage to have a high share of Human and Super Human Capital. The second part focuses on the location choices of the creative class in Helsinki. This class recognizes Hel-sinki’s advantages in terms of opportunities, however they also note that cultural amenities are not decisive when they designate their place to live and work. The decision is rather based on a combination of several factors such as social life and working possibilities.
Table of Contents
1 Introduction ... 1
1.1 Purpose ... 2
1.2 Disposition ... 2
2 Theories and concepts ... 3
2.1 Creative clusters ... 3
2.2 Cities ... 4
2.3 Human Capital ... 5
2.4 The Creative Class: the key driver force for economic development .... 6
3 Historical Background ... 9
3.1 The city of Helsinki ... 9
3.2 Structural view over the creative individuals´ location choices in Helsinki ... 10 4 Empirical analysis ... 13 4.1 Hypotheses ... 13 4.2 Methodology ... 13 4.3 Quantitative analysis ... 14 4.3.1 Data collection ... 14 4.3.2 Dependent Variables ... 14 4.3.3 Explanatory Variable ... 15 4.3.4 Descriptive Statistics ... 15
4.3.5 The Regression Model ... 15
4.4 Qualitative Analysis ... 16 4.4.1 Sampling ... 16 4.4.2 Interview design ... 17 5 Findings ... 18 5.1 Quantitative analysis ... 18 5.1.1 Regression analysis ... 21 5.2 Qualitative Analysis ... 25
5.2.1 Hypothesis 4: Helsinki is the choice based on living conditions ... 26
5.2.2 Hypothesis 5: Helsinki is the choice for working conditions ... 29
6 Recommendation for further research ... 32
7 Conclusion ... 33
List of references ... i
List of Appendix ... viii
Appendix 1: Questionnaire ... viii
Appendix 2: List of interviewees ... ix
Appendix 3: Shares of Human and Super Human Capital ... x
Share of Human Capital ... x
ii Graphs
Graph 1: Plot of the relation between share of Human Capital and
Popula-tion……….22
Graph 2: Plot of the relation between share of Super Human Capital and Popu-lation………...23
Maps Map 1: Districts of Helsinki……….11
Map 2.1: Location of the top 10 cities in Finland in the Human Capital Share………..…20
Map 2.2: Location of the top 10 cities in Finland in the Super Human Capital Share………...21
Tables Table 1: Location choices of artists and ICT professionals within Helsinki (Mustonen, 2010)………...11
Table 2: Description of variables………14
Table 3: Descriptive statistics………..………..15
Table 4: Shares of Human Capital and Super Human Capital……….18
Table 5.1: Top 10 cities with the largest positive residuals from the relation be-tween Human Capital and Population………...…...24
Table 5.2: Top 10 cities with the largest positive residuals from the relation be-tween Super Human Capital and Popula-tion………...25
”Cities are the greatest creations of humanity”
Daniel Libeskind
1
1 Introduction
We are currently living in an age of creativity, in which the driving forces of the economic development and regional competitiveness are not only technological and organizational, but also human (Peck, 2005; Petrov, 2007). In the contemporary world, creativity has be-come one of the most important engines of society, cities florish creating grow in the cre-ative sector. This linkage is so strong that creativity is no longer something nice to have, but has become a necessity- a must have in order to be competitive (Gertler et al., 2002). This cultural shift is a response to the new economic realities based on knowledge and is becoming increasingly apparent (James, 2006). As a result, traditional industries are em-bracing new ways of production and new technologies, developing innovative ideas and products and generating sources of employment (Scott, 2000; Markusen & Schrock 2006; Hauge & Hracs, 2010). Consequently, cities around the world compete in order to attract and retain the highly educated and talented individuals who drive these activities establishing the so-called creative class (Florida, 2002a; Gertler et al., 2002; Delisle & Shearmur, 2010; Florida et al., 2009b).
A big body of literature emerged to analyse the dynamics of the creative class expecially in the American cities (Currid, 2007; Currid & Williams, 2010; Florida et al., 2009a; Pe-trov, 2007). There is a handful of studies showcasing European cities, including Scandi-navian cities (Markusen & Schrock, 2006; Ardvidsson, 2007; Marlet & van Woerkens, 2004; Trip, 2007;). Nevertheless, only a few studies have investigated the location of the creative class in Finland. Mustonen (2010) has reported data related to working and living situations of the creative class in Helsinki by using occupational data. However, there are barely any studies, which investigate the reasons behind the choice of Helsinki as the lo-cation for living and working. Especially nowadays, with great attention drawn to Helsinki due to its appointment by ICSID1 as World Design Capital 2012 it should be considered worthwhile to fill this gap.
Data about Finland provided by Statistics Finland was employed in order to develop the Human Capital Share and Super Human Capital Share of the 336 Finnish municipalities. Furthermore, a regression model has been developed in order to examine the perfor-mance of Helsinki in terms of knowledge concentration. Besides, eighteen interviews have been conducted with some creative people working in Helsinki in order to investi-gate their perception of Helsinki as a working and living environment. They have been se-lected through the snowball technique by asking each of the respondents who of their network could provide valuable information for the research. The respondents are crea-tive people working in fashion, design, art, IT and culture. The first part examines the knowledge concentration in Finland. The second part focuses on the location choices of the creative class. The analysis showed that the educated people are mostly concentrat-ed in the south of the country where the biggest cities are also locatconcentrat-ed. Besides, in Fin-land although talent is positively related to the size of the municipalites, many small towns manage to have a high share of Human and Super Human Capital. The interviews of the creative people based in Helsinki revealed that the creative people recognize Hel-sinki’s advantages in term of opportunities, however cultural amenities are not decisive when they designate their place to live and work. The decision is rather based on a com-bination of several factors such as social life and working possibilities.
1
1.1 Purpose
The purpose of this study is to examine the location choices of the creative class in Fin-land with a special focus on the performance of Helsinki in terms of knowledge concen-tration. For this reason, I will run a quantitative analysis. A qualitative study will follow up in order to assess why creative individuals choose Helsinki as a place to live and work.
1.2 Disposition
The first part of the thesis will be reviewing the previous theories and concepts that are linked to the purpose of the study. The next section will be presenting Helsinki. The hy-potheses of the research are explained in the successive part. The following section will be reserved for the empirical study with methodology, data and model descriptions, re-gression analysis and qualitative analysis. The study ends with further research sugges-tions and the conclusion part.
3
2 Theories and concepts
In this section, theories and concepts, and previous studies, which are relevant for the study purpose, will be reviewed.
2.1 Creative clusters
Alfred Marshall has described the phenomenon of clusters in terms of “industry agglom-eration” since the 1920s. He developed theories that aimed at explaining why firms ag-glomerate (1920). Firstly, agglomeration saves transport costs by proximity to input sup-pliers or final consumers, secondly, agglomeration allows for labor market pooling, and thirdly, agglomeration facilitates intellectual spillovers. His theories show how an agglom-eration helps in gaining productive efficiency. The term “industry cluster” was coined by Porter in The Competitive Advantage of Nations (1990). According to Montgomery, a cluster is “a grouping of industries linked together through customer, supplier and other relationships which enhance competitive advantage” (Montgomery, 2007, p. 33).
Historically, in the past industry agglomerations were linked to the abundance of raw ma-terial in some specific areas such as the cotton production in Lancashire or New England (Hall & Markusen, 1985); nowadays, this activity involves a second factor. As a matter of fact, the competitive advantage that Montgomery takes into account is determined by the concentration of talented people who sway innovation and economic growth (Florida, 2003).
Saxenian (1994) specifically examines the Silicon Valley. She assesses that the keys of success are not only in that specific geographical location but in that definite environment defined by the financial and intellectual resources of Stanford University. Generally, the capital leadership in Silicon Valley played a role in transferring skills and knowledge amongst firms through the movement of workers across firms. Moreover, the “laid back” corporate culture about sharing of information in both formal and informal settings was beneficial to Silicon Valley if compared to other clusters in the US like the one around MIT and made it what the big technological hub that is nowadays.
Alternatively, the competition between many small firms may act as a drive for new ideas. Also, an entrepreneurial culture can spur innovation on a city level. As a matter of fact, Glaeser et al. (1992) and Miracky (1995) have showed that there is a strong positive connection between the number of firms per worker and growth in a given area. Their studies have focused on economic growth in the cities (cf. 2.2).
Nowadays, the formation of clusters is linked to the increasing importance of human capi-tal and its uneven distribution in the world. Human capicapi-tal is concentrated in some geo-graphical areas and these seem to be the same ones in which firms cluster. This clearly shows a shift if compared to the past trends, as clearly stated by Storper & Venables (2004, p. 4) “cities used to be centers of agglomeration of material production; now the motor force of agglomerations is the production and communication of ideas, knowledge and information”. Clustering involves transitional industries but evidence can be found in various other fields ranging from the entertainment industry (Florida, Mellander, & Sto-larick, 2009b), the music industry (Florida, Mellander, & StoSto-larick, 2009a), arts and cul-tural industries (Currid & Williams, 2010; Currid, 2009).
Despite the fact that, nowadays the information exchange is easier and that distances are not a relevant obstacle anymore, the industries based on communication continue to ag-glomerate. Currid (2007; 2009) documents how artists manage to combine new forms of
production with business people in environments not mainly designed for this specific purpose such as New York’s nightclubs. As well as that many new starts-ups and ven-tures in Silicon Valley takeplace in the close-by cafeterias. Oldenburg (1989, p. 20) labels these places “the third places”, which are more than informal public gathering places. The nomenclature is a result of the consideration that home is the ”first” place in one’s life and the work is the ”second”. The third place refers to social surroundings that are important for civil society and manage to establish feelings of a sense of place (cafes, bars, restau-rants, club etc).
2.2 Cities
The city plays a relevant role in attracting people and businesses and due to gegraphic proximity it allows ideas to move more rapidly than elsewhere. Jacobs (1969) and Lucas (1988) claim that cities are connected with the creation of ideas making the economic growth possible. But, what is a city and how does it comply with this purpose?
Conceptually, a city is a dense conglomeration of firms and people. The benefits of cities come eventually from reduced transportation costs for goods, people and ideas. The density in cities allows people to interact and exchange ideas and knowledge. Converse-ly, the costs of cities include health costs, pollution, congestion, crime and social prob-lems. However, technological developments have eliminated the health and pollution gaps between cities and other areas. Yet, longer commuting times in cities are still an important cost, and social troubles such as crime remain among cities' biggest problems (Glaeser, 1998).
Marshall (1890), Park et al. (1925), Jacobs (1961, 1969 and 1984), and Thompson (1965), have focused their attention on cities from in urbanistic and sociological point of view. According to Park and Jacobs, cities were cauldrons of diversity and difference, creativity and innovation (Florida, 2003). In line with these previous theories, Vernon (1963) and Thompson (1965) call the attention to the linkage between human capital and economic growth.
Yet, over the last several decades, scholars have continued with this theme of urbanism. Harvey (1989) asserts that a city´s image and atmosphere should attract capital and “wealthy and influential” people. Clark et al. (2002) reports the importance of public and lifestyle amenities in cities in order to draw capable high-tech staff. Likewise, Portney (2003) links the level of environmental quality that the individuals experience in a city to a city’s economic growth.
According to Storper (1997) a city is a structural unit, in which human actions are coordi-nated, and where only the coordination of factors of production stirs economic growth, emphasizing how just the right combination of factors lead to innovation and somehow anticipating Florida’s 3T’s theory (Florida, 2002a).
Kelly (1998) writes that the “new economy” operates in a “space rather than a place, and over time more and more economic transactions will migrate to this new space”. Then, the scholar specifies it, adding that: “Geography and real estate, however, will remain, well . . . real. Cities will flourish, and the value of a distinctive place, such as a wilderness area, or a charming hill village, will only increase.” Still, he repeats “people will inhabit places, but increasingly the economy inhabits a space” (Florida, 2003, p. 4).
Putnam addresses his attention to the interaction of districts, communities, and cities, whilst Clark and Glaeser, deal with human capital, consumption, and cities as lifestyle
5
and entertainment districts (Florida, 2003). According to Cohendet et al. (2010), a crea-tive city is compounded by three layers: underground, middleground and upperground. The underground is the layer of the individuals. They all share a common interest for art and culture that is embodied in their identities and lifestyle. Underground culture is an im-portant driving force towards new trends since the individuals are led by passion and sin-cere interest. Ardvidsson (2007) describes this underground urban environment in Co-penhagen arguing that it produces creativity and cultural production for free. It interacts and carries its cultural production to the advertising industry in Copenhagen throughout face-to-face contacts, which, according to Cohendet et al. (2010) is the upperground. This layer is characterized by the presence of innovative firms and institutions such as research labs, universities or cultural and artistic centers. These enable the creative pro-cess to flow since they have the capacity to finance organizations contributing to the cre-ative process by their ability test and finance the forms of creativity. The process that al-lows creative ideas to emerge from the deep underground to the surface of the upper-ground is generally carried out by communities, whose members concentrate on deliber-ate knowledge creation (Cowan et al., 2000). This is accomplished in the middleground. The functioning of communities is critical in the urban milieu, providing the creative city with tools that are essential in the need to explain and disseminate creative ideas. Com-munities are the physical place where knowledge is encoded and communicated starting from the stage in which the individuals do not have the capabilities to transfer ideas in or-der to achieve the point where the idea is unor-derstood and can becometo economically viable (Callon, 1999; Amin & Cohendet, 2004).
2.3 Human Capital
The supporters of the human capital theory contend that the highly educated people are the key to regional growth although there is debate over how to measure it. Lucas calls “Jane Jacobs externality” the productivity that comes from a cluster of human capital and that spurs the regional economic growth. Glaeser and his collaborators support this posi-tion as well (Glaeser, 1998; Glaeser, 2000; Rauch, 1993; Simon, 1998; Mathur, 1999). Others observe that universities, amenities or service diversity; openness and tolerance influence the distribution of human capital (Mellander & Florida, 2007).
What exactly is the human capital and how is it measured in a city or more extensively, in a region?
Alternative measures have been identified in order to assess talent or human capital: 1. Based on educational completion, by measuring the percentage of a population
with a bachelor’s degree and above (Florida, 2002b; Lucas, 1988; Glaeser, et al., 2001). This method is reasonable, since education and training are the most im-portant investments in human capital and easy to measure and because relevant data are usually easy to access. However, it does not include the college drops-out that have immensely contributed not only to the economic growth of some re-gions in the US but also to the global economy (Florida, Mellander, & Stolarick, 2008). Steve Jobs would be an example, amongst others. Moreover, it does not permit to identification of specific kinds of human capital nor does it capture the features that improve labour productivity, such as creativity, intelligence, on-the-job knowledge and accumulated experience (Florida et al., 2008).
2. Based on the measure of the “creative class” (see 2. 4) thus using occupational categories instead of educational completion. Several studies have shown the effi-cacy of this occupationally based measure (Markusen 2005, 2006; Marlets & van Woorken, 2004). This methodology finds criticism mostly due to the incapability by
some researchers to accept the terminology “creative class”. For instance, Markusen (2006) criticise Florida’s measure, by pointing out the lack of class self-consciousness. Pratt (2008, p. 3) argues that Florida has “prioritised consumption or/and idealised culture” and has failed to identify the importance of cultural pro-duction.
3. By using IQ and Test Scores (Florida et al., 2011). Several studies have shown that behavioural and social skills play relevant roles in adult outcomes (Heckman, 2008; McArdle et al., 2009).
4. By using wages since it is suggested that wage is a function of hours worked, skills and education (Mincer, 1974; Rauch, 1993; Glaeser, 2000) and that wages rise with the level of knowledge or skill (Becker 1964 1993).
The first approach is justifiable, since education and qualification are the most important investments in human capital. Besides, they are easy to estimate, because data is easily accessible. Nevertheless, this method presents a number of disadvantages since it does not include for instance the college drop-outs who have contributed immensely to US and global economies. Such a broad measure does not allow to capture factors that improve labour productivity, such as creativity, intelligence, on-the-job knowledge and accumula-ted experience (Florida, Mellander, & Stolarick, 2008).
However, said so, in this study I will measure human capital by using educational com-pletion. The reason behind this choice can be attributed to the easiness in accessing da-ta.
In addition to the human capital, an additional measure will be used that is the “Super Human Capital”. It includes the percentage of the population holding a Master or PhD degree. The reason of utilising this second measurement is related to the fact that this group of “super educated” people may have distinctive effects on regional performance and development (Tinagli, 2009).
2.4 The Creative Class: the key driver force for economic development
We are currently living in an age of creativity, in which the driving forces of the economic development and regional competitiveness are not only technological and organizational, but also human (Peck, 2005; Petrov, 2007). Consequently, the former categories of class analysis are evidently deficient for this task. As a matter of fact, in this “post-scarcity, post material” (Peck 2005, p. 744) phase of capitalism what matters is no more the tangi-ble but the intangitangi-ble or in the other words the creative capacity that is in this class’ heads (Florida, 2002a).
Florida has coined a neologism for this newborn class: “creative class”. This include a “super-creative core”, computed by IT and math people, workers in architecture and en-gineering, social science; education, training, arts and design work, and entertainment, sports, and media occupations – as well as other “creative professionals,” (Florida 2002a, p. 8) akin to classical knowledge workers, including management occupations, business and financial operations, legal positions, healthcare practitioners, technical occupations, and high-end sales and sales management (Florida, 2002a). It is also defined as a group of occupations in which individuals “engage in complex problem solving that involves a great deal of independent judgment and requires high levels of education or human capi-tal” (Florida 2002a, p. 8). However, what is specific of this “class” is the absence of a concept of group identity (Markusen, 2006), but yet has a common feature: it deals with the immaterial world.
7
The members of the super-creative core create “new forms or designs that are readily transferable and broadly useful, such as designing a product that can be widely made, sold, and used; coming up with a theorem or strategy that can be applied in many cases; or composing music that can be performed again and again” (Florida 2003, p. 8).
Furthermore, they share common features such as high education and higher disposable income (Gottlieb, 1994; Florida, 2002c). Peck points out that they have in common "a preference for intense but shallow and noncommittal relationships, mostly played out in the sphere of consumption and on the street" (Peck, 2005, p. 746). They also share mu-tual values such as diversity, openness, individuality and meritocracy; that is the reason why they seek out “plug and play” communities, where social entry barriers are low and heterogeneity is actively embraced (Florida, 2002a). An indicator of tolerance and ad-vancement is the presence of gays and lesbians, defined here as the “canaries of the creative economy”, serving as “harbingers of redevelopment and gentrification in dis-tressed urban neighbourhoods” (Peck, 2005, p. 745).
The creative class increases the labour mobility, due to an increased attention and will-ingness to take challenges and be flexible in contrast to high wages and bonuses. This affects their lifestyle demands (Florida, 2002c). The places in which they decide to move to and live are open, diverse and tolerant. These are also locations where firms want to establish themselves in order to get access to skills and innovation (Gottlieb, 1995). Hence, places able to attract such talented and productive individuals are able to appeal firms and are likely the centres of economic growth, urban development and prosperity (Currid, 2009).
These places are not performing this well due to traditional economic reasons such as access to natural resources or transportation routes. Nor are they flourishing because of special taxes regulations. They are succeeding largely because creative people want to live there. Creative centres provide the integrated ecosystem where all forms of creativi-ty—artistic and cultural, technological and economic—can take origin and flourish. More-over, these communities are rich in amenities that allow them precariously to maintain a work-life balance, together with experiential intensity and the opportunity to “validate their identities as creative people” (Florida 2003, p. 9).
In several occasions the same Florida admits that the crowding of creative people into gentrifying neighbourhoods might generate inflationary housing-market pressures, that not only run the risk of eroding the diversity that the class craves but, worse still, could smother the fragile ecology of creativity itself (Peck, 2005).
Many critics argue that Florida’s quintessence of creativity in the “creative class” defined by the occupation and education basis is not then appropriate (Markusen, 2006) and that the term ‘class’ is misused (Petrov, 2007). Scott (2000), for instance, states that the presence of creative people alone cannot provide a strong enough base for the long-term economic success of a city; creativity should be mobilized and channeled in order to generate productive learning and innovation.
9
3 Historical Background
3.1 The city of Helsinki
Helsinki, the capital of Finland, is located in the southern part of the country. The metro-politan region of Helsinki that includes the cities of Espoo, Vantaa and Kauniainen, has a population of 1 335 366 people (City of Helsinki Urban Facts, 2010, p. 6), representing one-fifth of the inhabitants of Finland. With its 583 350 residents2 (City of Helsinki Urban Facts, 2010, p.6), Helsinki houses over half of the population of the metropolitan area and a large concentration of the economical and cultural activities.
Alanen (2007) claims that Helsinki is the only truly urban area in Finland. Supposedly, people who live there – especially those who have purposefully chosen this – are more interested in urban activities than people from the other cities (Mustonen, 2010). There are 408 395 jobs available in the Finnish capital, the services sector is the leading with a share of 87.5 percent compared to the whole Finland where the share is 70.8. Converse-ly, the primary production has a lower share in Helsinki (0.3) than in Finland (4.8) (City of Helsinki Urban Facts, 2010, p.16). Helsinki has 30 percent of the jobs in Finland and 34 percent of GVA of Finland as a whole (City of Helsinki Urban Facts, 2010, p.17). The population of the Helsinki Region demonstrates a high and growing level of education: 66 percent of individuals over 15 years of age has a degree (secondary or higher) and 39 percent a University or polytechnic degree (City of Helsinki Urban Facts, 2010, p. 14). The Monocle magazine (Brûlé et al., 2011; 2012) has several times appointed Helsinki amongst the top three most liveable cities in the world. Helsinki topped the ranking in 2011. In 2012 it lost a position ranking the second place after Zurich and followed by Co-penhagen, Vienna and Munich. The cities are evaluated by utilising extensive patterns of criteria, including safety/crime, international connectivity, climate/sunshine, quality of ar-chitecture, public transportation, tolerance, environmental issues and access to nature, urban design, business conditions, proactive policy developments and medical care. Due to the dimensions of its sprawl, Helsinki cannot compete with bigger cities such as Paris or London but considering other dimensions the Finnish capital can provide higher stand-ards of living and be able to attract creative minds. Despite the climate and the remote location, they are not the most important determinants when choosing a place to live and work. Amongst others, the advantages that Helsinki boasts are efficient infrastructures that enable a rapid connection within the metropolitan region, a “new entrepreneurial spir-it” (Brûlé et al., 2012), unidentified “northern spirspir-it” (Mustonen, 2010, p. 13), the high- quality education systems and lot of green that allows the inhabitants for a healthy life (Louekari et al., 2010).
In addition to the Monocle magazine, the Times (Boulos, 2010) listed Helsinki as one of the six new alternative romantic getaways emphasizing gastronomy and restaurants above all.
Like many cities in the world, Helsinki is experiencing a major process of renewal since former industrial and harbour areas are being transformed for new uses based on creativ-ity, knowledge and innovativeness. Most of all, it has undergone a fast overhaul into a knowledge-based economy, and has become one of the technological hot spots in Eu-rope (Kepsu & Vaattovaara, 2008; van Winden et al., 2007). The rapid ICT-based
2
nomic development since the mid- nineties has permitted to Helsinki to rank repeatedly highly in different competiveness indexes. In the most recent European Competitiveness Index (Centre for International Competitiveness, 2007) Helsinki ranks second after Brus-sels. Also, Florida and Tinagli (2004) identify Helsinki as one of the top performers in Eu-rope, being able to compete with a “high level of overall creative competitiveness and rapid growth in its creative capabilities” (Florida & Tinagli, 2004, p. 40) Nevertheless, the main asset by which the Finnish capital is celebrated in the world is design. It is not only embedded in the daily life of Finns, but it also plays a central role in the city’s develop-ment with the purpose of enhancing an everyday life in an ecologically sustainable way.
3.2 Structural view over the creative individuals´ location choices in Helsinki
Mustonen (2010) remarkably represents the creative class of Helsinki in figures. The re-searcher, occupational data in hand, draws an extensive overview of the diverse occupa-tions of the creative class and their living and working settings from year 2005. In the field of “creativity”, Helsinki stands out for design, which also includes arts and architecture, and for information and communication technology. Both of them are part of the so-called knowledge- based economy. To simplify the process of analysing occupational data, Mustonen considers only these two categories: artists and ICT professionals.
The table below sums up the results accomplished in the report. Four are the indicators used:
• “Artists/Resid.”: percentage of artists who live in central Helsinki in relation to the total number in whole Helsinki;
• “Artists/Work.”: share of the artists who working in Helsinki;
• “ICT/Resid.”: percentage of ICT- professionals who live in central Helsinki in rela-tion to the total number in whole Helsinki;
• “ICT/Work”: share of the ICT-professionals working in Helsinki.
Three are the areas of the city considered in the study, which have been aggregated: • All the districts: Vironniemi, Ullanlinna, Kampinmalmi, Taka-Töölö, Lauttasaari,
Reijola, Munkkiniemi, Pitäjänmäki, Kallio, Alppiharju, Vallila, Pasila, Vanhakau-punki;
• Center: Vironniemi, Ullanlinna, Kampinmalmi;
• Inner City: Vironniemi, Ullanlinna, Kampinmalmi, Taka-Töölö, Lauttasaari, Reijola, Munkkiniemi, Pitäjänmäki, Kallio, Alppiharju, Vallila, Pasila.
The map below shows these areas and districts of the city of Helsinki.
11
TABLE 1: LOCATION CHOICES OF ARTISTS AND ICT PROFESSIONALS WITHIN HELSINKI.
Artists/resid.* (n=1337,%) Artists/work* (n=1544) ICT/resid.* (n=8120) ICT/work* (n=12702) All the districts 68.6 77.3 50.5 86.4
Centre 26.9 48.3 14.5 28.7
Inner City 63.6 72.4 43.5 59.1
*The amount (%) of people living/working in the area comparing to those living/working in Helsinki. Source: Mustonen (2010).
Data collected reveals that the majority of artists (77.3%) and ICT professionals (86.4%) work in the center and districts surrounding the center of Helsinki. When considering their living situation, the results differ showing that most of the artists (68.6%) live in these cen-tral districts of Helsinki, but the share of ICT-professionals is just the half of the total share (50.5%). These results can be explained by saying that ICT people and artists might have different lifestyles hence preferring other living situations. The shares differ even more when looking at the individuals living in the center. It is assumed that the living
situation is a factor that an individual can control more than the work location. As a matter of fact, twice the number of artists live in the centre than the ICT-professionals. Consider-ing the work for the ICT professional, the results show that the percentages are not high in the center. This is explained by the fact that IT hubs are located elsewhere than in the inner city.
When considering the national level, in year 2005, 37 percent of all the artists and indus-trial designers of Finland worked in Helsinki and of these more than 72 percent worked in the inner city, and in the southern neighbourhoods almost half. When examining the ICT professionals, 36 percent worked in Helsinki and of these 59 percent in the inner city. Given these descriptive facts and figures, the interviews with the creative individuals will assess the reasons why they have chosen Helsinki as the place to live and work.
13
4 Empirical analysis
In view of the historical background and the theoretical framework, which were described previously, this chapter focuses on illustrating how the empirical study is conducted. In addition to that, the section that will follow also includes precise information about the choice of the research method, the reason of the choice, the research design, the data collection and the elaboration of the data and analysis.
4.1 Hypotheses
Based on previous studies, one can assume that the concentration of Human Capital tends to be higher in larger and internationally connected cities. The Human Capital is measured by the share of the population holding a post-secondary education degree and above whilst the Super Human Capital is measured by the percentage of population with a master degree and above. In this research, Helsinki, the Finnish capital and the metro-politan region, assumes the role of leading region for creativity and talent. Given this, the following hypotheses will be tested:
1. Helsinki is the city with the highest share of Human Capital in Finland.
2. Helsinki is the city with the highest share of Super Human Capital in Finland. 3. On a national context, Helsinki is overperforming, given the population.
(A) considering Human Capital;
(B) considering Super Human Capital;
4. Helsinki is the choice based on living conditions. 5. Helsinki is the choice based on working conditions.
Hypotheses 1 and 2 are based on descriptive data; for hypotheses 3A and 3B, a quanti-tative analysis will be conducted by using a regression model. Hypotheses 4 and 5 will be assessed with a qualitative analysis with the help of interviews.
4.2 Methodology
In order to be able to answer the research questions presented in section 4.1, a com-bined approach was chosen. The most traditional research is valuable but a more inter-active investigation that assembles evidence from previous research studies with the pro-fessional knowledge of those doing fieldwork is critical in conducting research (Condelli & Wrigley, 2004). Therefore, the best research design is a mixed method that combines quantitative and qualitative research. Aliaga and Gunderson (2005) state that a quantita-tive methodology “explains phenomena by collecting numerical data that are analysed using mathematically based methods (in particular statistics)” but has limited explanatory power on the phenomenon I wish to study. On the other hand, a qualitative design pro-vides subjective insights and cannot be generalized. Creswell et al. (2003) argue that giv-ing types of mixed-methods research names has certain advantages. It conveys a sense of the rigour of the research and provides guidance to others about what researchers tend to do or have done. Denzin and Lincoln (2000) claim that qualitative research in-volves an interpretive and naturalistic approach: “this means that qualitative researchers study things in their natural settings, attempting to make sense of, or to interpret, phe-nomena in terms of the meanings people bring to them” (p. 3). By the combination of the two methods, it is possible to achieve a much richer understanding (Condelli & Wrigley, 2004).
Silverman (2010) asserts that these are the ways to combine quantitative and qualitative research. This research will begin with a quantitative study in order to establish a sample of respondents and to determine the broad contours of the field. Then, by using qualita-tive research it will look in depth at key issues.
4.3 Quantitative analysis 4.3.1 Data collection
Finland is divided into nineteen regions and seventy-four sub- regions. However, the fun-damental administrative divisions of the country are the municipalities, which may also call themselves towns or cities. At the beginning of 2012, there are 336 municipalities, 16 of which are in the Åland Islands, which is the only autonomous province in Finland. Da-ta were collected in January and February 2012 from the Official S Da-tatistics Finland da Da-ta- data-base and then analysed with SPSS, the predictive analytics software. Variables were col-lected at municipal level, as listed in the table below.
TABLE 2: DESCRIPTION OF VARIABLES
Variable Description Source Expected outcome
Municipal Population Population in municipal
level. Official Statistics Finland. Year 2009
Positive relation to tal-ent.
Human Capital Percentage of popula-tion with a post-secondary education degree and above.
Official Statistics Finland. Year 2009
Positive relation to mu-nicipal population
Super Human
Capi-tal Percentage of popula-tion with a master de-gree and PhD.
Official Statistics Finland. Year 2009.
Positive relation to mu-nicipal population.
4.3.2 Dependent Variables
Human capital (HC)
It is estimated as the percentage of the municipal population holding a post-secondary education degree and above (Florida, 2002b; Lucas, 1988; Glaeser, et al., 2001). Three different categories of degrees: lower level tertiary (bachelor), higher level tertiary (mas-ter) and doctorate level- per municipality were added and then divided by the municipal population.
Super Human capital (SuperHC)
It is estimated as the percentage of population that has a Master or PhD degree (Tinagli, 2009).
15
4.3.3 Explanatory Variable
Municipal Population (logPop)
It is the population at the municipal level. Because of the size difference between the largest and smallest cities, the data is expressed in logarithmic form so as to facilitate comparison.
4.3.4 Descriptive Statistics
The descriptive data presented below provides an overview of the minimum and maxi-mum values, the mean values, and the standard deviations of the variables.
TABLE 3: DESCRIPTIVE STATISTICS
Descriptive Statistics
N Minimum Maximum Mean Std. Deviation
LogPop 336 4.83 13.28 8.7864 1.20545
ShareHC 336 .08 .45 .1656 .04811
ShareSuperHC 336 .01 .25 .0350 .02282
Valid N (listwise) 336
Logged transformed variables: Population (LogPop)
The above statistical results reveals that municipal population varies in units and conse-quently in city sizes. The wide range of Human Capital and Super Human Capital shows that some cities are more effective at attracting talents than others.
4.3.5 The Regression Model
The formula below is the general equation of linear regression model: y = β0 + β1x1 + ε
• where y is the value of the dependent variable being predicted; • β0 is the y intercept
• and ε is the random error, which is the difference between the observed value of y for xi and the predicted value from the regression model of y for xi (Groebner et al., 2011).
Following regression models are proposed in order to test hypotheses (3A) and (3B) of the study and can be found in the Appendix;
Hypothesis 3 (A): Human Capital = β0 + β1LogPop + εi
In order to validate the model and assess hypothesis 3, a graphical residual analysis will be applied. Residuals are the differences between the responses observed at each com-bination values of the explanatory variables and the corresponding predicition of the re-sponse computed using the regression function (Groebner et al., 2011).
4.4 Qualitative Analysis
King and Horrocks (2010) state ”qualitative research is interested in how people differ in relation to a particular phenomenon, as much as it is in what they have in common”. Re-searchers seek to recruit participants who represent a variety of positions in relation to the research topic, of a kind that might be expected to throw light on meaningful differ-ences in experience. According to Silverman (2010), this is carried out in different ways. The one chosen in this study is in-depth semi-structured interviews with standardized questions that focus on a specific target group. Such interviews enable the participants to present their individual understandings and experiences (King & Horrocks, 2010) and from the interviewer´s side to ”enter, in an empathetic way, the lived experience of the person or the group being studied” (Mc Leod, 1994, p. 89).
As Breakwell (1990, p. 81) states, the interview approach relies heavily upon respond-ents being able and willing to give accurate information. In some cases, the author faced the situation in which the respondent was unable to meet the interviewer in person but available to answer to the questionnaire by mail. Thus, the set of questions was adapted to be either filled in individually by the respondent or conducted as an interview by the re-searcher. This double-way approach is due to time constraints of both the respondents and the researcher.
A deductive research was chosen to analyse the data collected since it seemed the most appropriate one. Deductive qualitative analysis is a method, or series of procedures, use-ful for the testing and reformulation of theoretical models (Gilgum, 2002; 2001). In deduc-tive qualitadeduc-tive analysis researchers begin their research with a conceptual model, study cases in depth, and then reformulate the model to fit the cases. This search for discrep-ancies in evidence guards against the possibility that researchers will impose their model on the phenomena they observe, while missing other phenomena that could contribute to a useful viable theory (Gilgum, 2003).
4.4.1 Sampling
Since the set of questions is aimed at the creative class in Helsinki representative of cat-egories such as art, design, media, music and performing arts, the sampling is selected so that each category provides at least one respondent.
The “snowball sampling” or “chain referral sampling” technique has been utilized in order to find a reasonable amount of respondents. The method yields a study sample through referrals made among people who know or share of others who possess some character-istics that are of research interest. This methodology is self-contained and self-propelled since once it is started it proceed magically on its own (Biernacki & Waldorf, 1981). When selecting the people to interview, the following factors were considered:
• Their field of work: the author’s aim is to give as a wide overview as she could in the limited amount of time available;
• The availability of respondents of a different nationality than Finnish, in order to provide a wider perspective;
17
• The possibility that some of the respondents would be self employed or freelanc-ing;
• The size of the company in which they are employeed or self employeed. The au-thor wanted to represent small, mid-sized and large companies as much as possi-ble.
4.4.2 Interview design
The interview that was designed contains nineteen questions. it covers two section: de-mographics and location choices. The first seven questions covers the dede-mographics, in order to gain knowledge about the name of the respondents, age, gender and marital sta-tus; the field in which they practice their job, the name of the company and the position. The questions from eight to nineteen aim to capture different aspects based on the theo-retical framework model.
All the questions are open, except for the questions related to the demographics. Given the limited time, to get a broad cross-section of experiences and opinions about Helsinki, the author interviewed 18 creative people who vary in age, nationality, gender, training, field of working and experience. These individuals provided invaluable information about living and working in Helsinki.
The interviews were recorded and transcribed verbatim. The goal with the interviews is to establish analytical plausibility and cogency of reasoning (James, 2006). The creative in-dividuals who have been interviewed agreed to be quoted with their names in this re-search.
The questionnaire that was used to interview the creative individuals is in the Appendix. Additionally, a detailed list with full names, professions and companies of employment can be found in the Appendix.
5 Findings
Bearing in mind the historical background, theoretical framework and methodology, which were described previously, this chapter focuses on explaining the findings. The first part is based on the quantitative data and aims at testing hypotheses 1, 2 and 3. The second part is built on hypotheses 4 and 5 and is based on qualitative analysis.
5.1 Quantitative analysis
Hypothesis 1 states: “Helsinki is the city with the highest share of Human Capital in Finland”
and
Hypothesis 2 states: “Helsinki is the city with the highest share of Super Human Capital in Finland”;
Human Capital is conventionally calculated by the share of population with a university degree (Florida, 2002b; Lucas,1988; Glaeser, et al., 2001). However, due to the growing number of post-graduate people, it is reasonable to build two shares of Human Capital: the traditional one, the “Human Capital Share”, and the “Super Human Capital Share”, which includes the percentage of population holding a Master or PhD degree (Tinagli, 2009). The reason of this double construction is related to the fact that this group of “su-per educated” people may have different effects on regional “su-performance and develop-ment (Tinagli, 2009).
The table below shows the two shares with the Top 10 Cities in Finland.
TABLE 4: SHARES OF HUMAN CAPITAL AND SUPER HUMAN CAPITAL
Human Capital Share Super Human Capital Share Position Municipality HC% Position Municipality SuperHC%
1. Kauniainen 44.92% 1. Kauniainen 24.92% 2. Espoo 34.89% 2. Espoo 15.80% 3. Helsinki 31.89% 3. Helsinki 14.10% 4. Pirkkala 29.21% 4. Kirkkonummi 10.58% 5. Kirkkonummi 29.04% 5. Oulu 10.54% 6. Oulu 28.46% 6. Pirkkala 10.31% 7. Tampere 27.41% 7. Tampere 9.88% 8. Vaasa 27.33% 8. Turku 9.56% 9. Jyväskylä 27.13% 9. Jyväskylä 8.99% 10. Kaarina 26.78% 10. Kaarina 8.80%
Source: shares are calculated by using population and educational data from Statistics Finland (2009).
A table with shares for all the 336 municipalities will follow in the Appendix.
From the above rankings, we can infer a number of conclusions. Firstly, Helsinki, which was expected to be the top city in both shares, ranks instead in the third position. One of
19
the reasons might be that since Helsinki is the biggest city in Finland it does not only at-tract well-educated professionals but also workers with lower education due to a larger labour market than elsewhere in Finland. The leading city is Kauniainen that is located in the metropolitan region of Helsinki like the second one, Espoo. Kauniainen has a share almost 15 percent higher than Helsinki when considering the Human Capital and 10 per-cent when looking at the Super Human Capital. The case of Kauniainen is worth further investigation due to the fact that considering its size it seems to be overperforming in terms of knowledge concentration. As a matter of fact, the town is small with only 8 772 inhabitants (OSF, 2009). The educational qualification of the residents is the highest in Finland and people who live there are fairly wealthy (OSF, 2009). Since the local taxation rate is the lowest in Finland (16.5%), the city is attractive to the highest earners, which in most of the cases are the highly educated people (OSF, 2010). Nevertheless, since the town is located close to Helsinki, many individuals with high education might find it bene-ficial to live in Kauniainen for the reasons listed before and commute everyday to their workplaces in Helsinki. As a matter of fact, since the above shares are built by using data of the population residing in these municipalities further studies including data of the pop-ulation working in these cities instead might give different results than the shares pre-sented above.
Secondly, the rankings do not show evident variations. The first three cities are equal in both shares. The only difference appears on position eight with Vaasa included in the Human Capital Share and Turku in the Super Human Capital Share. These results might indicate that afterall in Finland there is no evident variation in the distribution of Human and Super Human Capital. Besides, the talent is not always concentrated in cities with at least a university. In both the Shares, six out of the ten cities are also university cities (Espoo, Helsinki, Oulu, Tampere, Vaasa- in the Human Capital one, Turku- in the Super Human Capital one and Jyväskylä); whereas the others are towns developed around some sort of business or big company (Kauniainen, Pirkkala, Kirkkonummi, Kaarina). Thirdly, in both the rankings the top three cities are part of the metropolitan region of Hel-sinki. In addition Kirkkonummi, which ranks 4th and 5th position is part of a bigger area called greater Helsinki. Despite Helsinki does not rank the first position, the capital region itself perfoms really well in term of knowledge concentration.
Fourthly, overall the distribution of knowledge in Finland shows higher shares in the south of the country, where Helsinki is located like previously said. The maps below shows the knowledge concentration in Finland (with the top ten cities in the shares). The map 2.1 shows the location of the first 10 cities in the Human Capital Share. The map 2.2 displays the location of the first 10 cities in the Super Human Capital Share.
Source: self-elaboration from a map of Finland
21
Source: self-elaboration from a map of Finland
Considering that out of the ten cities included in the shares, seven are amongst the 15 most populated ones in Finland and considering previous studies on cities and talent, it is assumed that Human Capital and Super Human Capital are positively related to munici-pal population. Besides, since Helsinki is the most populated municimunici-pality in the country, given the population it is assumed to overperform. For this reason, the next section will aim to capture this relation.
5.1.1 Regression analysis
Hypothesis 3 asserts: “On a national context, Helsinki is overperforming, given the popu-lation.
(A) considering Human Capital; (B) considering Super Human Capital;
In order to ascertain whether given the population, which has been logged due to size dif-ference as to facilitate comparison (LogPop), Helsinki is overperforming compared to the national level (hypotheses 3A, 3B), the data is visually described by a scatter plot. The scatter plot below provides a graphical display of the relation between population and share of Human Capital.
GRAPH 1: PLOT OF THE RELATION BETWEEN SHARE OF HUMAN CAPITAL AND POPULATION
The relation is positive meaning that as the population of the city increases as the share of human capital is subjected to growth. R2 has a value of 0.409 and the standardized be-ta coefficient has a value of 0.640. Hence the degree of linear correlation between popu-lation and human capital is strong.
The scatter plot displays that there is only a municipality which performs differently from the majority of the municipalities. The outlier is Kauniainen. As discussed before, it re-tains not only the highest share of educated people in Finland but also it performs incred-ibly well given the small size of the city. Considering Helsinki, the city is not an outlier. The table 5 shows that Helsinki ranks the third position in the Share of Human Capital. However, in relation to the population of the built-up area, the city does not outperform. Hence, hypothesis 3A is wrong. The explanation can be that a big city manage to attract individuals with high education due to more resources and job possibilities. At the same time, it is subject also to inbound flow of low or non- educated workers who most likely become city dwellers of the suburbs.
Looking at the scatter plot which relates Super Human Capital to Population (graph 2), the correlation between the two variables is not as strong as the previous one with R2 of 0.326 but still positive while the stardadized coefficient beta has a value of 0.571. This means that the variable population is sufficient to explain the share of Super Human Cap-ital. In this case not only is Kauniainen an outlier but also the cities of Espoo and Helsinki. In this sense, Helsinki overperforms given the population of the city. Hence hypothesis 3B is right.
23
GRAPH 2: PLOT OF THE RELATION BETWEEN SHARE OF SUPER HUMAN CAPITAL AND POPULATION
A closer examination at the residuals from the regression analysis shows the differences between the responses observed at each combination value of the explanatory variables and the corresponding prediction of the response. The values of the residuals of the top 10 cities overperforming for each of the relationships (Human Capital- Population; Super Human Capital- Population) can be observed in the tables below.
Table 5.1 displays the top 10 cities with the largest positive residuals from the regression analysis of the 336 Finnish municipalities when the relation between the share of Human Capital and Population is taken into account.
Table 5.2 shows the top 10 cities with the largest positive residuals when the share of Super Human Capital and Population is considered.
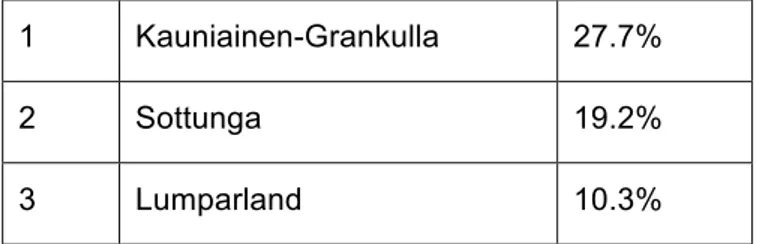
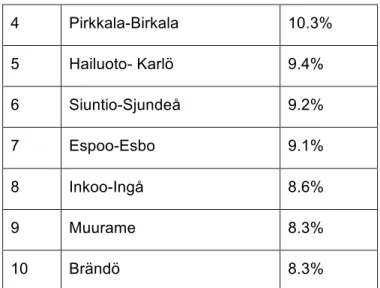
TABLE 5.1: TOP 10 CITIES WITH THE LARGEST POSITIVE RESIDUALS FROM THE RELATION BETWEEN HUMAN CAPITAL AND POPULATION
1 Kauniainen-Grankulla 27.7%
2 Sottunga 19.2%
4 Pirkkala-Birkala 10.3% 5 Hailuoto- Karlö 9.4% 6 Siuntio-Sjundeå 9.2% 7 Espoo-Esbo 9.1% 8 Inkoo-Ingå 8.6% 9 Muurame 8.3% 10 Brändö 8.3%
Kauniainen is the city topping the ranking with a value of 27.7 percent extra of HC given the population size, followed by Sottunga with 19.1 percent and Lumparland with 10.3 percent. Helsinki has not fared well amongst the first ten cities. What is interesting to note from this ranking is that towns ranking second and third, Sottunga and Lumparland; and the town ranking the tenth position are all located in the islands of Åland. Åland forms an archipelago in the Baltic Sea in the Gulf of Bothnia, between Finland and Sweden. It is an autonomous, demilitarised and a monolingually Swedish-speaking region of Finland. Ac-cording to the national accounts, fields of culture and mass media generate a volume of value added per capita of approximately euro 1,000, ranking the second region in Finland after the capital area (OSF, 2010). These figures are impressive considering the size of the region and the population. Also, according to Eurostat (2008), in 2006 Åland was the wealthiest region in Finland with a GDP per inhabitant 47 percent above the European mean.
These top three towns have three factors in common. First they are all wealthy places suggesting that a feasible third variable, which can count in this relationship between tal-ent and population, might be income. Secondly in regard to the size they are all very small sprawls. Kauniainen with its 8 772 inhabitants (OSF, 2009) can still be considered a town but Sottunga and Lumparland are not bigger than villages with a population of about 400 and 100 people. Thirdly Finland has two official languages, Finnish is spoken by 90 percent of the population and Swedish spoken by 5.4 percent. Kauniainen has about 40 percent of the population speaking Swedish, while in the other two towns Swe-dish is the language most spoken. Thus, to sum up, the most overperforming municipali-ties in Finland are wealthy, have a small size, are predominantly Swedish speaking and do not provide a lively cultural life which can be found in bigger cities. This leads to fur-ther considerations: how do these towns manage to draw talents? If this not due to their cultural life, is the reason linked to the low taxation rate offered in these municipalities like previously mentioned in 5.1?
The table below shows the top 10 values of the residuals for the municipalities consider-ing the variable Super Human Capital and Population.
TABLE 5.2: TOP 10 CITIES WITH THE LARGEST POSITIVE RESIDUALS FROM THE RELATION BETWEEN SUPER HUMAN CAPITAL AND POPULATION
25 2 Espoo-Esbo 8.4% 3 Pirkkala-Birkala 5.8% 4 Helsinki-Helsingfors 5.7% 5 Kirkkonummi-Kyrslätt 5.2% 6 Siuntio-Sjundeå 4.9% 7 Muurame 4.1% 8 Sottunga 4.0% 9 Brändö 3.9% 10 Oulu-Uleåborg 3.7%
Once again, Kauniainen is the city that tops the ranking with an extra value of 21.1 per-cent. The town is followed by Espoo and Pirkkala. Espoo is located in the south of the county in the metropolitan region of Helsinki and is the second biggest municipality in Fin-land. Espoo is a hub for technology and a science community including numerous startups and organizations, amongst others the headquarters of Nokia. Pirkkala is close to Tampere, where also the Tampere airport is located, in the province of Western Fin-land. The town is the fastest growing one in the region of Tampere. Conversely the previ-ous table, in which Helsinki did not appear, in this ranking the Finnish capital fares well the fourth position with a value of 5.7 percent extra of the predicted value considering the size. This shows that in this case the capital city is well overperforming amongst the first best performing cities in Finland. This means that on a national level and given the popu-lation Helsinki overperforms in term of Super Human Capital more than in term of Human Capital. This might be explained with the ability of the city to retain talented people once they have graduated. The two rankings display the same municipalities with an array of big cities (Helsinki, Espoo and Oulu) and small towns (all the other ones).
The results from the quantitative analysis showed that Helsinki has a high share of Hu-man and Super HuHu-man Capital when looking at distribution of knowledge in whole Fin-land. It was showed also that the knowledge seems to be concentrated in the South of the country where also the biggest cities are located. Regression analysis revealed that there is a positive correlation between size of the city and concentration of knowledge which is related to higher availability of amenities and cultural activities. However, some small towns manage to overperform due to tax relief. The next session focuses on Hel-sinki and the reasons behind the choices by the members of the creative class of the Finnish capital as a living and working environment.
5.2 Qualitative Analysis
Once provided an overview of the distribution of knowledge in Finland and assessed the relationship between concentration of human capital and population of the municipalities, the next part focuses on testing the hypotheses 4 and 5.
Hypothesis 4 states: Helsinki is the choice based on living conditions. Hypothesis 5 states: Helsinki is the choice based on working conditions.
5.2.1 Hypothesis 4: Helsinki is the choice based on living conditions
In recent literature, creative individuals are recognized to be very mobile in their profes-sional assignments, and hence to change their place of residence frequently (Florida, 2002). Also, they are drawn to cities where their cultural needs can be fulfilled. Florida (2002, 2004) asserts that they have varying urban preferences than other workers, fa-vouring locations with a vibrant urban atmosphere, a good community life, gender equali-ty, political freedom, diversity and high levels of tolerance. This combination is usually observed in inner-city locations, which is supposedly where the creative individuals prefer to be settled.
Of the eighteen people interviewed, only one is a native of greater Helsinki and has been living all her life in the Finnish capital. All the other respondents have moved to Helsinki in their adult age. Altogether, eleven people are born in the the same region where Helsinki is located, the Uusimaa region; two are from elsewhere in Finland and five respondents are originally from other countries than Finland (namely Denmark, Italy, Japan and the United Kingdom).
Taking a closer look at the areas in Helsinki where these creative individuals are settled, seven of them live in the centre. In total, fourteen individuals live in the inner city and only two people live in the outskirts. Unlike other European and American cities with a long history of urbanization, Nordic capitals have been affected by urbanism only in the latest century, especially considering Helsinki. Through industrialisation and migration,its land-scape and culture has changed and developed in a short lapse of time. Effective planning is necessary in order to implement economic activities in areas usually devoted to resi-dential purposes (Boyer et al., 2011). In Helsinki the economical and cultural activities are mainly concentrated in the inner city. Only recently, areas surrounding the inner centre which have become vacant from previous economical activities, are now fertile ground for grassroots initiatives, pop-up events and alternative use of these wastelands.
This means that the suburbs not only often lack cultural initiatives but also frequently re-semble unappealing grey blocks of buildings built around the small local shopping centre. Hence, they do not attract creative individuals. The words of an architect who has been interviewed describes these neighbourhoods:
“As soon as one leaves the inner city, monsters of concrete appear on both sides of the streets. Nothing relevant happens in these places since inhabitants go there only to sleep whilst their dai-‐
ly life take place in their workplaces in the centre. There, the only episodes of life happen around the local shopping centre where all the drunk people meet”. Lorenzo Servi, architect. Despite the harshness of these words, other respondents share the same judgment about these neighbourhoods, especially in regards to east Helsinki. These people highly evaluate the proximity to amenities including the closeness to the sea, cultural life and the historical charm of the central neighbourhoods where they reside. However, two indi-viduals reside in the city’s north district. Their choice was based on the availability of de-sired space, greenery and affordable houses. Despite the awareness of being public transport-dependent due to the distance from the center and all the economic and cultur-al activities, they are not disturbed by the dormitory atmosphere of their districts. They cultur- al-so strongly believe that in a city like Helsinki, in which the center is commercially