www.vti.se/publikationer Björn Carlén Lars Hultkrantz Xing Liu Anders Lunander Svante Mandell Anna Mellin Jan-Eric Nilsson Roger Pyddoke Edith Sorkina Inge Vierth
Landbaserade godstransporter,
klimat och styrmedel
Underlagsrapporter 1-10
VTI notat 28–2014Förord
Detta notat innehåller de tio underlagsrapporter som ligger till grund för VTI rapport 831, Landbaserade godstransporter, klimat och styrmedel – Sammanfattande rapport. Vi tackar Vinnova och Trafikverket för finansiering och alla medverkande för en god insats.
Stockholm september 2014
Svante Mandell Projektledare
Kvalitetsgranskning
Detta notat följer inte mallen för VTI:s publikationer.
Underlagsrapport 1
Björn Carlén and Svante Mandell*
CTS—Centre for Transport Studies and VTI—Swedish National Road and Transport Research Institute, Box 55685, SE-102 15 Stockholm, Sweden
* Corresponding author: Tel.: +46 8 55 57 7038; fax: +46 8 28 50 43. E-mail address: svante.mandell@vti.se
Abstract
Shifting transportation to electrified modes, e.g., rail, is a politically attractive way of reducing greenhouse gas (GHG) emissions from the transportation sector. There is a vivid debate about the effects such a shift has on GHG emission and how these should be assessed and appraised. We argue that this debate largely originates from differences in how the debaters characterize the situation at hand, in particular how markets are organized and which policy instruments are in place. To shed light on this, we start by identifying the appropriate assessment approach in a hypothetical situation without any climate or energy policies and then gradually add realistic circumstances into the equation. Our main conclusion is that evaluating the climate impacts from a transportation shift is a highly complex task in the initial situation. The closer we move towards a climate-policy architecture of the current EU-type, the simpler the task becomes. Given a comprehensive global climate treaty, there is no need for any special treatment of the GHG effects since all relevant effects then would be internalized in producer and consumer prices.
JEL codes: H54, Q51, R42
1. Introduction
Transportation relies heavily on fossil fuels. In most developed countries 90 per cent or more of the energy use in the transportation sector originates from fossil sources. Not surprisingly, the transport sector thus answers for a large share of these countries’ greenhouse gas (GHG) emissions. Furthermore, the demand for transportation, in particular for air travels and freight transports on roads, is expected to continue to grow rapidly. Cost-effective fulfillment of stated climate policy objectives, notably the EU’s objective of reducing its GHG emissions by 20 percent to the year 2020 and by 80 percent to the year 2050, is therefore likely to require substantial adjustments within the transport sector. The palette of policy measures is broad but politicians seem particularly interested in projects that curb the GHG emissions from
transportation without restricting transportation per se. One suggested such project is to electrify (parts of) the transportation system by promoting electric vehicles on roads or facilitating shifts from road to (electrified) railways.
In this paper we discuss principles for identifying and appraising the impact on GHG
emissions from electrifying transportation. We are primarily interested in the road-to-rail case, but the principles apply to other cases as well, both inside and outside the transportation sector. The underlying motive for the paper is an ongoing debate regarding how and to what extent investments in rail infrastructure influences GHG emissions and how to adequately consider these effects in cost-benefit analyses (CBAs) of such investments. Various approaches have been proposed. For instance, some argue that one should use the average GHG-emission factor (AEF) of electricity production, i.e. total emissions from the power sector divided by total production. Other argues that it is the marginal emission factor (MEF) that is of interest, i.e. emissions per electricity unit for the power plant lastly employed. It has also been argued that if the railway operator only purchases electricity based on renewable fuels, the investment would produce no GHG emissions. Still other advocates the use of so-called life-cycle analysis (LCA) of electricity production as well as of the transport
investment. At the other end of the spectrum some note that if power producers are included in a cap-and-trade system, the incremental electricity demand would only influence permit prices, not aggregate emissions.1 Also when it comes to how to value the identified effects on GHG emissions the views diverge. Setting aside the very abstract level, there is no simple and universal answer to how to deal with the impact on GHG emissions of electrifying
transportation. However, we believe that the opposing standpoints to a large extent originate from divergent views on what circumstances are present in any particular case, rather than from misunderstandings. As will be shown, the answers to any of the above-mentioned disputes are highly context dependent. Our objective is to provide a structured discussion that sheds light on the problem of where and when various approaches are valid.
Our discussion is mainly of principal nature. However, references are occasionally made to the Swedish case, which may be of particular interest since the power production there is essentially carbon free and since Sweden has a rather long experience of non-mandatory green
1 Banverket/SIKA (2002a, b) include an early and interesting discussion where SIKA, a Swedish governmental agency responsible for gathering and analyzing transport sector statistics, and the Swedish National Rail
Administration express completely opposing views on some of these questions. For instance, the latter argues for the use of AEF and that renewable fuel contracts play a central role.
electricity contracts as well as a mandatory system of so-called tradable green electricity certificates. To fix ideas, we consider a railway investment that would transfer a certain freight transport volume from road to rail. Such a project may have several significant effects, including a reduction (increment) in the congestion on roads (rails), changes in operational costs and transport time as well as energy use. Here, we focus on two sub-questions, namely the consequences of the incremental electricity demand that follows our investment project and how any changes in GHG emissions should be dealt with in an otherwise complete and adequate cost-benefit analysis of our railway project. Throughout the analysis we assume that market prices reflect the values of all resources but GHG emissions.
The analytical approach adopted below is to start (in Section 2) with a seemingly simple context where there is no climate or energy policies. We then sequentially add circumstances that make the analytical context more realistic. In Section 3 a mandatory system of green electricity certificates is introduced. Thereafter, in Section 4, we add climate policy instruments, e.g. tradable emission permits, carbon taxes and an international climate agreement. The context thereby becomes increasingly complex during the presentation. However, one of the main messages of the paper is that the adequate approach of identifying and appraising the relevant GHG effects of our investment at the same time becomes less complicated, not to say simple. Section 5 sums up and concludes.
2. No Climate Policies
We begin by discussing the short-term impact on GHG emissions of an increased electricity demand in a context where no climate or energy policies are present. By short term we mean the time period during which the electricity production capacity is fixed. Three questions are central for our discussion. First, should one use the MEF or AEF of electricity production to assess the effect a railway investment has on GHG emissions? Second, does the existence of any voluntary contractual arrangement specifying that the railway operator only purchases green electricity matter? Third, how should we value the quantified GHG effect?
Of particular importance to the first question is the merit order of power producing facilities on a competitive power market. Typically, production facilities are employed in a cost-increasing order. Power plants producing at a low short-run variable cost (SRVC) are used before plants with higher costs. High-cost plants are started only when needed to meet
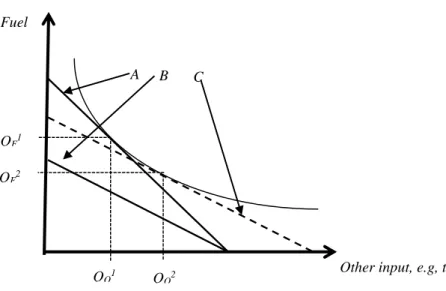
occasional demand spikes. This makes sense since any other procedure would imply waste of scarce resources. Given the uncertainty surrounding future demand for electricity (D) and future fuel prices and the long time it takes to create new production capacity, there usually exists a substantial reserve capacity on the market. This situation is schematically illustrated in Figure 1, where D0 denotes the expected demand schedule in the absence of our railway
project and the graph S illustrates the supply curve2 (the merit order of existing production plants). Our railway project consumes A units of electricity and therefore shifts the demand curve to D1. More costly plants than plant x must then be employed and the electricity price
2 At the Nordic/Scandinavian power market Nordpool, producers submit their individual supply schedules (i.e. how much they are willingly to produce at different price levels) while electricity retailers and large consumers submit their individual demand schedules. Given profit interested firms and a competitive environment this procedure yields a market supply curve close to a merit ordering based on SRVC, Cason and Plott (1996), Joskow et.al. (1998).
increases from p0 to p1. This fosters the electricity demand somewhat. After this demand
adjustment, the produced and consumed amount of electricity has increased from q1 to q0. As
long as electricity demand is not totally inelastic the incremental power production will be smaller than the railway project’s direct consumption of electricity. The GHG effect of the incremental production equals ΔGHG = axΔkWhx + ayΔkWhy, where ai denotes plant i’s
specific emission factor (i.e., GHG emission per kWh production). This is the (true) MEF-approach,3 which is the appropriate approach to use as it thus captures the effects from the project at hand.
Figure 1. Illustration of the power market
Under the AEF-approach, the incremental production is multiplied with the average emission factor a (= total emissions from power production / total production). Then, the assessed GHG-effect becomes a(ΔkWhx + ΔkWhy). If plant y where the only carbon emitting one, the AEF-approach would hold our railway investment accountable for less carbon emissions than actually created, i.e., a(ΔkWhx + ΔkWhy) < ayΔkWhy. If, on the other hand all plants but x and y are emitting, the opposite would apply. The size of the error depends crucially on how heterogeneous power plants are in terms of their specific emission factors for carbon dioxide (CO2). That the error may be substantial is shown by the following example.4
Consider a railway investment that increases the yearly power production with 50 GWh. If this production were coal based (for which ai ~ 890 gCO2 per kWh)5 the yearly CO2 emissions would increase with ~44 kton. If we instead would apply the AEF found in Swedish power production, ~20 gCO2 per kWh i the investment would seem to increase emissions by 1 kton. As an extreme illustration, assume that total annual power production amounts to 135 TWh (approximately true for Sweden). However, assume that, without the investment, no coal based power would be used. This would yield an AEF of ~0.3 gCO2 per kWh. Applying this figure to the investment will hold it accountable for a yearly CO2 increase of only ~15 ton.
3 Hawkes (2010) discusses strengths and weaknesses with existing approaches of estimating the MEF in practice. 4 Also, see e.g. Bettle et.al. (2006) that examine the differences between the AEF and the MEF for the case of England and Wales.
5 See Hondo (2002). TWh SRVC y D0 D1 x z q0 q1 p0 p1 S A pz
We now turn to the second question, namely the effects of voluntary green electricity contracts (i.e., contracts specifying that the electricity purchased should come from carbon free power plants). The selling idea of such contracts is to alter the merit order at the power market in a “climate friendly” direction. However, it is not evident that they actually
accomplish this. A contract giving the owner of plant z a total unit remuneration of at least pz
would make him/her willing to produce electricity. Plant z would thereby exclude plant y from the market and plant x would be the price setting plant also after our railway project. In this case, our railway operator would pay more for electricity but on the other hand create no additional direct GHG emissions. Two things should be noted, though. First, since the market price is unchanged, there would be no fostering of the demand for electricity. Second, we have implicitly assumed that plant z would otherwise be idle. However, it is not likely that such a situation would arise. Instead, we would expect that our operator, when entering a green contract, excludes some other agent from entering a similar contract with plant z and thereby forcing this agent to buy conventional power. In this more likely situation, whether or not our operator engage in a green contract is irrelevant for our railway project’s effects on the GHG emissions from power production.
So far we have considered only direct GHG emissions of power production (essentially carbon emissions from fuel combustion).ii GHG emissions arise also when fuels are extracted, processed and transported. This is so for both fossil fuels and biomass based fuels. To
consider such indirect emissions (IE) a life cycle analysis (LCA) must be conducted of the incremental electricity production as well as the reduced fuel use for road transportation. Studies indicate that these indirect emissions may be substantial, see e.g. Searchinger et al. (2008), and Lapola et al. (2010). Our railway investment’s net-effect on global emissions then becomes.
(1) ΔGHG = ΣaiΔkWhi + ΣΔIEi + (ΔGHGRoad + ΔIERoad)
The first two terms of the right-hand side captures the effects associated with the incremental electricity production while the last two terms capture the change in emissions due to less road traffic.
Electricity is traded across borders, a trade expected to grow in Europe as new transmission cables materialize between countries and regulatory hinders are erased. To only consider domestic power production capacity when assessing equation (1) may therefore be misleading. For instance, Sweden is an integrated part of the North European electricity market for which the marginal power plants are coal fired, implying that the relevant MEF is close to 900 gCO2 per kWh even though the Swedish MEF is much lower, as discussed in the example above.
In the longer run new power plants will be built. This generally takes considerable time, e.g., due to technical complexity, juridical procedures and bureaucracy.iii Consequently, there is a non-negligible mid-term to consider. During this time, an (unexpected) shift in electricity demand will not influence the characteristics of the power generating capital, although some electricity may be produced in new plants. These plants have not been directly motivated by the demand shift, i.e., they were planned but not constructed at the time of the demand shift. Thus, the principles relevant for the short term apply also in the mid-term, although the relevant MEF may be different since new plants are added to the power generating capital. In the long run, our railway-project may influence the composition of the power production. It is then the characteristics of these new plants that will determine how much GHG emissions our project causes. In the absence of energy and climate policies, new capacity is likely to be coal based. However, voluntary green contracts might render “green” power plants to be built in which case ax = 0. Our railway operator would then pay more for electricity in order to
avoid (direct) GHG emissions. It should also be noted that in the long run the LCA of power production also includes emissions from construction of the plants and land use changes, which may be substantial (se e.g., Hondo, 2002, and Wibe 2010).
We now turn to the third question, namely how to value GHG emissions accruing to our railway investment. In this simple context with no international climate treaty or other climate or energy policy instruments, higher GHG emissions from the power sector imply essentially the same increment in global emissions. The risk for climate change is a global public bad. A global and benevolent social planner would therefore attach a value vG to an additional
emission reduction that equals the sum of all individuals’ valuation of the risk thereby avoided. However, in the absence of an international/global treaty coordinating nations’ behavior, it is sub-optimal for any single country to unilaterally abate up to the point where the cost for further abatements equal vG. Instead, a government (with the objective of
maximizing its citizens’ welfare) would only consider the unilateral, domestic valuation of this additional risk (vS) which by definition lies below vG, and by circumstances substantially
so (see e.g., IPCC, 1996). The reader should note that this is not a policy recommendation, just a conclusion consistent with the assumed context. It should also be noted that,
irrespectively of which approach one takes, it is by no means a simple task to arrive at precise estimates of vG or vS. In both cases one has to assess the sum of many future generations
valuation of the climate effects incurred.
To sum up: In this context with no climate or energy policies an amount vSΔGHG, should be
added to the cost side of an otherwise correct CBA of our railway investment. ΔGHG is given by (1) and based on a MEF calculated for the relevant electricity market, which in many cases may be larger than the domestic one. For the Swedish case the relevant market amounts to the North European one. In the short run, voluntary green electricity contracts are not likely to influence the emissions from incremental power production. In the long run they may. Then, the railway operator will pay a higher electricity price in order to lower the project’s climate cost. Whether this increases or reduces the cost-benefit ratio of the project depends on how large the markup on the green electricity is relative the value of emission reductions.
3. Tradable Green Electricity Certificates
We now add to the analytical context a mandatory system that mills in electricity based on renewable energy sources. The system we have in mind resembles the system of tradable green electricity certificates used in several EU-countries, including Sweden.iv Such a system gives producers of green electricity a certificate for each unit produced. This creates a supply of certificates. To create a demand, electricity consumers (or on their behalf electricity distributors) are obliged to hold a certain number of certificates per electricity unit consumed (sold). The producers of renewable energy may sell certificates to the electricity consumers, thus getting revenues over and above the market price on electricity. The policy variable is the number of certificates the consumers are obliged to hold per consumed unit, α. Figure 2 illustrates such a certificate system. For simplicity, we assume a totally inelastic electricity demand, located at q. Thus, the demand for certificates equals αq. We denote this qG which
thus equals the amount of green electricity produced. The remaining electricity demand is catered by conventional power production, qC.
Figure 2. Green electricity certificates
As Figure 2 is drawn there would be no green electricity without the systemv and the supply of electricity would be given by MC1. Consequently, the competitive electricity price would
be p1. By milling in qG units of green electricity the system shifts the supply curve of
conventional electricity rightwards to MC2. The market price then becomes p2, and only qC
units of conventional electricity is produced. Thus, the system reduces the market price on electricity. This is so because it is the most costly conventional power plants that are
substituted away in favor of green electricity. In order for qG units to be produced the price on
green electricity must at least be p3. Given a market price of p2 this implies a competitive
certificate price equal to pG (=p3–p2). The total expenditures on green electricity (= p3qG) is
distributed over consumers by a certain fee on electricity consumption, so the consumers end up paying p2 + pG qG / q per electricity unit.vi
The formula for our railway project’s net-effect on global GHG emissions is still given by (1) and this effect is still to be valued by vS. However, an increment in electricity consumption
will now be met partly by green power plants and partly by conventional ones. So even if the price on the regional (e.g., North-European) power market is set by coal fired plants, the relevant MEF contains domestic green power plants. The green certificate system thereby lowers the direct GHG emissions from power production associated with our project. To what extent the system influences the indirect emissions of power production is an open question. As compared to the non-policy case the CBA of our project is affected in two ways: (i) via the change in net-emissions and (ii) via higher electricity expenditures.
It should be noted that a mandatory system for electricity certificates makes voluntary green contracts insignificant. Such contracts, when leading to investments in green production capacity, will reduce the price on certificates and thereby lead to less investment in green power capacities elsewhere. For a discussion on this topic see e.g. Broberg and Brännlund (2010). So, in the presence of a mandatory green electricity certificate system additional voluntary green power contracts only increases our project’s electricity expenditures.vii
p2 p1 pG MC1 MC2 TWh p D MCG p3 qG qC q
4. Climate Policy Instruments
So far there has been some robustness in the formula constituting the “climate post” in an otherwise perfect CBA of our railway project. The reason behind this is that we so far only have considered second-best responses to the threat of rapid climate changes, i.e., behavior and/or policy measures indirectly affecting parts of GHG emissions, such as voluntary green power contracts and a mandatory system for green electricity certificates. We now add
climate-policy instruments to the analytical context. The instruments we consider steer via the price on GHG emissions and have the capability of attaining the policy targets
cost-effectively.
First we introduce a cap-and-trade system for carbon emissions from electricity production and other energy intensive industries, i.e. a policy instrument akin to the European Emission Trading System (EU ETS). Thereafter we add an emission cap also for other GHG emissions. We then have a policy context closely resembling the current climate-policy architecture in EU. Finally, we discuss the effects of our railway project in the presence of a comprehensive global climate treaty of the Kyoto Protocol type.
4.1 Cap-and-trade system covering power production (EU ETS)
A cap-and-trade system sets a cap for the system’s aggregate emissions and allocates tradable emission permits to the participating firms. Given compliant behavior, aggregate emissions will equal the cap level irrespectively of how permit trading distributes emissions/abatements amongst the firms. Competitive permit trade allocates abatement efforts in a cost-effective way, i.e., so that the unit cost of further abatements equals the permit price, pETS.viii An
immediate implication of this system is that our railway project no longer influences
aggregate (direct) emissions from power producers and other firms under the cap. Increased power production now only leads to that someone else under the cap must abate further. The climate policy effect of our railroad investment now equals pETSΣaiΔkWhi + vs[ΣΔIEi +
ΔGHGRoad + ΔIERoad]. The first term of this expression is included in the electricity price and
will therefore appear as an increment of our project’s expenditures on electricity. Thus, the climate policy post in an otherwise complete and adequate CBA of our railway project reduces to
(2) vs[ΣΔIEi + (ΔGHGRoad + ΔIERoad)]
We no longer have to worry about MEF of power production and how to value emissions from electricity production. However, we still need to quantify and value the project’s effects on emissions outside the cap-and-trade system.ix It should be noted that now neither voluntary green power contracts nor the mandatory system of electricity certificates has any effects on GHG emissions. In the present context they would only serve to increase our project’s electricity expenditures.
4.2 EU Burden Sharing Agreements
It is often believed that only the emissions from the EU ETS are capped. This is not the case, however. The so-called burden sharing agreement between the EU-15 countries (EC, 1999) allots national quotas to the member states for their GHG emissions during 2008-12. The permit allocations to the EU ETS firms are drawn from these quotas. The remaining part of a member state’s quota defines a national cap for the emissions from emitters outside the EU ETS. We subsequently refer to all these non-EU ETS emitters as the other sector (OS).x A second agreement (EU, 2009) defines national caps for the member states OS for the period 2013-20. The caps for the OS and the caps for the EU ETS constitute a cap for EU’s
inter-governmental trade with quota units for the OS. Given well-functioning such quota unit trade there will be an EU-wide price on GHG emissions from the member states’ OS.
Most European countries use domestic fuel taxes to control their GHG emissions. Some countries, such as Sweden, have an explicit CO2 tax. The Swedish carbon tax currently amounts to 1.08 SEK per kg CO2, which is substantially above pETS (approx. .20 SEK per kg
CO2) and most estimates of vG and also vS (Tol, 2008; Brännlund, 2009). However, since the
Swedish carbon tax has dual objectives – to finance public expenditures and to control emissions – we cannot interpret its level as the marginal abatement costs in the Swedish OS. This poses a practical problem for CBAs of our railway project that we return to below. The shift from road to rail induced by our investment will now not influence the EU’s
aggregate (direct) GHG emissions. The reason is that the government will either adjust the tax level so that the emissions in the Swedish OS is kept at a constant level or keep the tax level constant whereby some quota units are freed. In the latter case, the government may sell additional quota units to other governments or save them for future use.xii In both cases revenues are created for Sweden. In the former case, abatement costs are avoided in the Swedish OS. In the latter case, revenues from geographical or inter-temporal emissions trading materialize. For the moment, assume that the revenue of these options are the same (i.e., that the Swedish policy is cost-effective) and let tOS denote this value. The climate policy
relevant effect of our railway investment can then be stated as pETSΣaiΔkWhi + tOSΔGHGRoad+ vs[ΣΔIEi + ΔIERoad]. Since the first two terms are internalized in market prices, the adequate
explicit climate post in our CBA reduces to (3) vs[ΣΔIEi + ΔIERoad]
Now we only have to quantify and value the indirect emissions of our railway project. As indicated above these indirect emissions may be large, especially for bio-fuels. Nevertheless, they are often ignored. It may seem strange that this effect on global emissions should be valued by the domestic (here; Swedish) valuation of reduced risk for rapid and large climate changes. However, as explained above, this is the consistent approach for emissions that is not subject to any international climate treaty.
The market based climate policies we discuss here operate via market prices such that these will be calibrated to reflect the cost of GHG emissions (as it has been defined by political negotiations). These market prices will influence the decisions of individuals and firms and are thus very powerful tools for steering the entire economy in a more “climate friendly” direction. Thus, that the implementation of these climate policy instruments implies that less of our project’s effects related to GHG-emissions require explicit treatment in the CBA should not be interpreted as them being less important.
It should be noted that our railway project may have a climate policy dividend even when not reducing the aggregate demand for emissions. This happens if tOS is sufficiently above pETS.
Then, shifting transport activities from the OS to EU ETS (thereby substituting high-cost abatements with low-cost abatements) will contribute to a more cost-effective climate policy. As noted above, it is not straightforward to interpret the level of the Swedish carbon tax as the marginal abatement cost within the Swedish OS. To arrive at an adequate CBA of our project we need information about to what extent the tax level is motivated by fiscal considerations (i.e., how large the tax would be in the case there would be no climate threat) and which part of it that is motivated by climate concerns.
4.3 A Global Climate Treaty of Kyoto Protocol type.
The world is striving for a global climate treaty. Although some steps have been taken in this direction, e.g., the negotiation of the Kyoto Protocol, the road to such a treaty is by no means
straightforward. Nevertheless, let us here assume the existence of a global climate treaty of the Kyoto Protocol type and discuss what it would imply for the CBA of our railway investment.
Now also the indirect emissions of our project will materialize under an emission cap. The aggregate global emissions will thus be unaffected. Our project now only imply that someone else has to undertake further or less abatements, and therefore leads to that abatement costs are incurred or avoided elsewhere. These effects are reflected by the international quota unit price (pW) under this climate treaty. The climate policy relevant effects of our projects can
then be stated as pETSΣaiΔkWhi + tOSΔGHGRoad+ pW(ΣΔIEi + ΔIERoad). Now also the last term
is internalized in market prices and will therefore appear in various places in a complete and adequate CBA of our railway project. For instance, the initial demand for road transports will be smaller under the current context than under the previous ones. There is therefore no need for a special treatment of GHG emissions in the CBA. Most notable, the planner does not have to assess the environmental cost of GHG emissions.
5. Concluding Remark
We have here discussed principles for assessments of the GHG effects of a railway project that shifts a certain amount of transports from road to rail. Our main message is that the adequate way of considering these effects in an otherwise complete CBA of the project crucially depends on the climate and energy policy context under which the project is undertaken.
In a context with no climate or energy policies at all, the relevant climate post of our railway investment equals the country’s unilateral valuation of the projects net-effect on the global GHG emissions. This net-effect consists of the changes in direct and indirect GHG emissions of power production and the change in dito for road traffic. The direct emissions from power production should be assessed by the means of the marginal emmission factor (MEF) of electricity production derived for the relevant regional electricity market, which often is larger than the domestic market. For the Swedish case this amounts to the North European market, at which the marginal power production is coal based.
Voluntary green electricity contracts between the railway operator and power producers may in the long run imply that the project is responsible for less GHG emissions than a traditional MEF-assessment would indicate. In the short run such contracts only serve to increase the project’s expenditures on electricity. A system of tradable green electricity certificates (of the Swedish type) has three implications in this otherwise non-policy context: (i) the relevant MEF now consists of the weighted sum of the marginal plant on the North European power market and the marginal green power plant in Sweden and (ii) the extra cost of green electricity is now included in the consumer price on electricity and (iii) any voluntary purchases of green electricity (over and above the green certificate system) produce no additional green electricity nor emission reductions.
At the other end of the policy-context spectrum we have a comprehensive global climate treaty inducing a uniform price on GHG emissions. In this case, market prices reflect all relevant climate policy effects and there is no need for any specific and explicit treatment of these effects in the CBA of our railway investment. In fact, by doing so we would count the same effect twice. This is not to say that our project of electrifying transportation cannot produce climate policy dividends, only that such dividends automatically and correctly will be considered in the CBA of the project. Such a comprehensive global climate treaty has yet to materialize although some steps have been taken.
The member states of the EU have agreed upon a rather comprehensive regional climate policy treaty consisting of two cap and trade systems – the EU ETS and a system for
intergovernmental emission quota trade. Thus for a foreseeable future most emissions within the EU are capped. A railway investment electrifying (part of) the transport sector will therefore give rise to mainly pecuniary effects which existing market prices reflect. Even though the effect on global GHG emissions will be minor, reallocating abatements between the road transport sector and the EU ETS may contribute to a cost-effective fulfillment of the EU’s climate policy targets. This would be the case if it is more costly to abate in the former than in the latter sector. Since the relevant effects are internalized in the electricity and fuel prices any such dividends are automatically captured by a comprehensive CBA. An explicit treatment is only called for to the extent the project affects emissions outside EU’s emission caps. Example of such emissions is some of the indirect emissions of power production and (bio and fossil) fuel consumptions. To adequately consider these effects a life-cycle-analysis are needed.
The circumstance that less and less of our project’s climate policy relevant effects needs explicit consideration by the means of an separate climate post in the CBA should not be interpreted as the threat of rapid climate changes being less prioritized. On the contrary, it is a consequence of effective climate policies being implemented, policies that internalize the value/cost of GHG emissions (as it has been defined by the political system) in market prices. Billions of every-day decisions as well as larger investment decisions are now steered in a more “climate friendly” direction.
References
Banverket/SIKA, 2002a. Nya banavgifter? Analys och förslag, SIKA Rapport 2002:2
Banverket/SIKA, 2002b. New rail infrastructure charges? Analysis and proposals – Summary in English, SIKA Report 2002:2
Bohm, P., 1994. On the feasibility of joint implementation of carbon emissions reductions, in Climate Change: Policy instruments and their Implications. Proceedings of the Tsukuba Workshop of IPCC Working Group III (ed. A. Amano). Center for Global Environmental Research, Environment Agency of Japan, Tsukuba, Japan.
Bettle, R., Pout, C.H. and Hitchin, E.R., 2006. Interactions between electricity-saving
measures and carbon emissions from power generation in England and Wales, Energy Policy, 34, 3434-3446
Broberg, T. and Brännlund, R., 2010. Den gröna el vi betalar för har tydliga nyanser av brunt, DN Debatt 2010-03-21
Brännlund, R., 2009. Växthusgasernas samhälleliga kostnad. Vilket värde ska väljas? Bil Sweden.
Cason, T. N., and Plott, C. R., 1996. EPA’s New Emissions Trading Mechanism: A
Laboratory Evaluation, Journal of Environmental Economics and Management, 30, 133-160 Carlén, B., Carling A. and Mandell S., 2005. Svensk klimatpolitik under nationellt
utsläppsmål respektive avräkningsmål, ER 2005:29, Energimyndigheten
Dales, J.H., 1968. Pollution, Property & Prices: An Essay in Policy-Making and Economics, Edward Elgar Pub
EC, 1999. Preparing for Implementation of the Kyoto Protocol, COM(1999)230
EU, 2008. The support of electricity from renewable energy sources, Commission Staff Working Document, SEC(2008) 57
EU, 2009. EU Energy and Climate Change Package
Hawkes, A. D., 2010. Estimating marginal CO2 emissions rates for national electricity systems, Energy Policy, 38, 5977-5987
Hondo H., 2005. Life cycle GHG emission of power generation systems: Japanese Case, Energy 30, 2042-2056.
IPCC, 1996. Climate Change 1995: Economics and Social Dimension of Climate Change, Contribution of Working Group II to the Second Assessment Report to the Intergovernmental Panel on Climate Change, Cambridge University Press
Joskow, P., L., Schmalensee, R., and Bailey, E., M., 1998. The Market for Sulfur Dioxide Emissions, The American Economic Review, 88(4), 669-685
Kyoto Protocol, 1997. The Kyoto Protocol to the United Nations Framework Convention on Climate Change. Kyoto: UNEP/WMO.
Lapola, D. M., Schalach R., Alcamo J., Bondeau A., Koch J. , Koelking C., and Priess J. A., 2010. Indirect land-use changes can overcome carbon savings from biofuels in Brazil, PNAS Montgomery, D. W., 1972. Markets in Licenses and Efficient Pollution Control Programs, Economic Theory 5, 395-418
Rosendahl, K. E. and Strand, J., 2009. Simple Model Frameworks for Explaining Inefficiency of the Clean Development Mechanism, The World Bank, Development Research Group, Environment and Energy team, Policy Research Working Paper 4931
Searchinger T., Hamburg S., Melillo J., Kammen D.M., Lubowski R., Oppenheimer M., Robertson G.P., Schlessinger W., Tilman G.D., 2009. Fixing a critical climate accounting error. Science, 326, 527–528.
Tol, R. S. J., 2008. The Social Cost of Carbon: Trends, Outliers and Catastrophes, Economics, The Open-Access, Open-Assessment E-Journal, 2, 1-24
Wibe, S., 2010. Etanolens koldioxideffekt: En översikt av forskningsläget, Expertgruppen för miljöstudier 2010:1
i Source; Svensk Energi
ii Also combustion of biomass releases carbon. Usually it is assumed that the direct emissions from bio-fuel combustion equal the amount of carbon assimilated by the bio mass during its growing phase, an assumption we here maintain.
iii As an example of the latter; the average time from applying for building approval for a new wind mill to when construction begins is 48 months in Sweden, much because there are currently 27 different instances that have to approve the construction plans. Source; http://www.goldwind.nu/vindkraft.php (110620).
iv Similar systems are in used in, e.g., Norway, the UK, Poland, Romania, Italy and Belgium, (EU, 2008) v This is because MC
G intercepts the p-axis at a price above p1. Thus, the first unit of green electricity costs more
to produce than it could be sold for.
vi In principle this consumer price may lie below or above p
1. However, in practice it is likely to be above. For
more about green electricity certificates, see Carlén, Carling and Mandell (2005).
vii It should be noted that if the mandatory system’s definition of green electricity does not comprise all GHG production technologies, voluntary green electricity contracts may induce additional GHG emission reductions. viii See e.g. Dales (1968) and Montgomery (1972).
ix It is possible that some of the emissions we have labeled indirect now materialize under the emission cap, in which case the term ΣΔIEi now is smaller. However, in practice this effect is likely to be small and is henceforth
ignored.
x Usually, this sector, which broadly comprises transportation, light industry, business and services, is called the non-trading sector. However, as will become obvious below, this is a somewhat misleading terms whereby we instead uses the term OS.
xi For the year 2020 the two caps sum to 80 per cent of the emission level in 1990. The aggregated cap level may be adjusted if member states and/or firms under the EU ETS trade emission quota units/permits with agents outside the EU, i.e., engage in IET, JI and/or CDM. Given compliance behavior, the former two transactions only reallocate emissions. This stand in contrast to CDM projects, which are likely to increase global emission (see
e.g., Bohm (1994) and Rosendahl and Strand, 2009).
xii Only if the government annuls quota units would a global emission reduction materialize. However, such a behavior is not in accordance with an efficiency oriented government.
1
3
Design of a combinatorial bidding market for Green Corridor freight
Lars Hultkrantz*
Örebro University School of Business
Anders Lunander
Örebro University School of Business
Abstract
The Green Corridor (GC) initiative, pursued by the Swedish government and the European
Commission, is intended to be a platform for innovation for long-distance freight transport aiming for more green and efficient solutions by enhanced use of economies of scale and development of new technologies. However, scale has to be traded off by two other aspects (i) freight transport time and reliability; and (ii) economies of scope. In this paper we present an already existing rail corridor case that highlights the need for tools (and/or markets) for making more efficient tradeoffs between economies of scale and scope in long-distance freight transport. This involves making very complex coordination of shipments that are differentiated with respect to origins-destinations, shipment size, time, time reliability requirements, regularity of shipments and involving both ex ante transport planning and real-time control. A market-based method that in principle could be used to solve such complex coordination is combinatorial auctioning and we briefly review a number of Swedish public tendering cases where this is done in practice. However, this raises questions on whether a fragmented vertically separated European rail industry can mobilize the “soft” market infrastructure needed to
support a Green Corridor.
4
1. Introduction
The railway industry, more than other transport modes, is marked by national idiosyncrasies. National differences in track width, electrical power systems, signal systems, safety standards, etc. have been until recently severe obstacles to cross-border rail traffic in Europe. Partly for that reason, train freight has a larger share of long-distance freight transport in the U.S. than in many European countries. Given increasing road congestion and awareness of global warming issues, many industrial and political efforts are therefore made to enhance competiveness of the rail mode on the freight markets for export and import of products within Europe.
The European Commission’s action plan for sustainable freight transport (KOM/200//0607/final)
in 2008 launched the idea of establishing “Green Corridors” (GC) for long distance freight haul in Europe. This initiative origins from previous discussions between government and industry in Sweden and is now a part of the Commission’s policy for meeting climate policy challenges in the transport sector. The action plan states that the “concept of transport corridors is marked by a concentration of freight traffic between major hubs and by relatively long distances of transport. Along these corridors industry will be encouraged to rely on co-modality and on advanced technology in order to
accommodate rising traffic volumes while promoting environmental sustainability and energy efficiency.”
Being a political proposal, the precise definition of GC is open to discussion. Based on a survey to a sample of stake holders, public agencies and academia a draft definition has recently been suggested (Hansen 2011). From this it is clear the GC initiative aims at concentration of national and international freight on specific long-distance transport stretches. By economies of scale in long transport legs, the establishment of GC is supposed to make possible reduction of freight
transportation cost, greenhouse gas emissions, and energy use. Each GC will be defined by a basis of measurable indicators. A GC is “green” only if these indicators are better than the European average
and there is a continuous improvement over time. Green corridors can be co-modal, with parallel long stretches for road, rail and sea transport, and are expected to be inter-modal; in particular since “first mile” and “last mile” road transport may be needed in combination with rail or sea transport on a long
5
leg. A final feature of the GC concept is that is intended to be “a platform for innovation”, for instance for development of new wagon-load systems or more fuel-efficient engines.
Although the Commission´s action plan and other documents thus collect a broad set of actions under the GC hat, it is clear that the focus is on enhancing cost efficiency of freight transport through better use of economies of scale. That can be made for instance by technological, institutional and infrastructural changes that allow use of longer/wider/heavier truck and train configurations.
However, scale has to be traded off by two related aspects (i) freight transport time and reliability, and (ii) economies of scope. These are related since consolidation of freight needed to get large shipment sizes (economies of scale) and high capacity use in all parts of the transport network (economies of scope) is time consuming, and even if time and reliability concerns can be met so as to get economies of scale in one part of the transport system (for instance in a long leg) it may be at the price of lost economies of scope. The tradeoffs with respect to economies of scope concern two aspects: One is the load factor in the long leg in both directions; i.e., a high cost/energy/carbon efficiency achieved by use of fully loaded large truck or train set in one direction may be offset by a low load factor in returning (and/or other) transport lanes. The second is the trade off between low cost per kilometre in the GC long leg and the additional kilometres and handling costs needed in medium range transport to and from the GC.
Some observers (Campagna 2009) have noted that establishing a GC is not just a matter of “hard” infrastructure construction but also of “soft” infrastructure, such as solutions for e-marketplaces, access to information, Intelligent Transportation systems, agreed standards to follow between operators, training and policies. In this paper we focus on some components of such a “soft infrastructure” needed for creation of a GC. In particular we ask whether more efficient trade-offs
between economies of scale and scope in long-distance train freight transport can be made with combinatorial auction methodology.
For this purpose, we first briefly discuss the basic considerations in the choice of freight transport mode, when the alternatives are rail and road, and then describe an already existing “train corridor” solution; a collaboration between Swedish paper companies for rail freight from Sweden to the
6
European continent. This case demonstrates that technical and infrastructural conditions for establishing a GC is already present; what still is lacking to make the train corridor “green” is an improved market mechanism that can fill the load capacity in all directions. Next, we therefore discuss the basic features of combinatorial auctions. To provide some sense for the practical usefulness of this mechanism we briefly present a few tendering cases in which combinatorial auctions have been made by national and local government agencies in Sweden. Finally, we discuss issues that need to be investigated to design a market for train freight transport capacity, based on bidding in combinatorial auctions.
2. The need for an improved market mechanism to make a GC work
In this section we first discuss the basic cost and time trade-offs in a choice between rail and road freight, to get a feeling for the basic challenges in establishing a market clearing mechanism for green corridor transport capacity. We then briefly present an already existing “corridor”, which is a joint venture by some Swedish paper companies for train freight haulage to the European continent. Both the discussion of the various trade-offs and the case study points to the crucial role, and the complexity of, a combinatory mechanism that can establish a high load factor.
2.1 Factors affecting choice between rail and road in long-distance freight haul
Consider a shipper that sends goods to a remotely located receiver and has a choice between road transportation all the way or short to middle range truck transportation to and from railway terminals and rail transportation in between these terminals. The total shipment cost can be decomposed and compared between the two modes in the following way:
1. Freight travel cost. The direct travel cost is the cost of driving a loaded truck or train between two points. Since the main idea of a rail GC is to take advantage of economies of scale, we assume that the cost per tonne kilometre of a fully loaded train is lower than that of a truck. However, the road alternative may still have a travel cost advantage as the truck can choose a direct route to the final destination, while the rail alternative may require a longer route including the short range transport to and from terminals.
7
2. The “generalized” freight travel cost. The total, or “generalized”, travel cost is got by adding the cost of travel time and travel time-uncertainty to the direct travel cost. The travel time cost includes the capital cost of the freight during transportation and the waiting cost of the customer. The cost of travel-time uncertainty depends on the just-in-time-demands of the shipment and the access to back-up systems when a good is delayed. Whether a train or a truck is most fast depends to some extent on running speed but more so on the degree of road and rail congestion. In rail, congestion, i.e., conflicts in track-use, are handled in two ways, by a scheduled time table, and by real-time traffic system control. Trucks, in contrast, are not hindered by scheduled delays, except for scheduled breaks for drivers´ resting time and for ferry crossings, but may be vulnerable to more or less occasional traffic jams.
3. Loading, reloading and consolidation cost. These activities are costly and hence add to the total shipment cost. Freight consolidation is the combination of several shipments to a larger and hence more economical load (Cetinkaya and Lee 2002). Consolidation is time consuming and therefore comes at the expense of inventory carrying costs and customer waiting costs. This means that the larger economies of scale of the rail GC can be assumed to have a price by higher costs and time requirements for consolidation.
4. Return travel load. Assuming a full load capacity transport in the direction from the sender to the receiver, the question is what happens in the other direction. If trucks and trains have to return empty, then the unit transport cost will double, compared to when they are fully loaded. It is not clear a priori how less than full capacity return freight affects the cost comparison of the two alternatives. If the cost of the train alternative is lower in the outbound direction, it will also be lower when the cost of the return travel is included. However, the direct truck alternative may possibly have a more flexible routing, which could affect the possibility to take on return freight.
In summary, we see that train freight have several disadvantages in competition with truck freight. More efficient solutions for train transport on long stretches will give the train mode a competitive edge only if the enhanced use of economies of scale is combined with high performance in use of
8
economies of scope (distribution and return transport) and in planning and real-time coordination of the freight consolidation.
2.2 Supply chain management and transport market design
Modern production is often characterized by complex exchange between multiple levels of production. These relationships are called supply chains. There are often strong complementarities between various inputs, i.e. production requires that specific bundles of inputs are available at the same time or in specific sequences. Freight shipment is a supply chain in itself. Freight is distributed in a logistics network with links and hubs, combining different transport modes and requiring complex synchronization of activities. Freight transportations therefore involves making very complex
coordination of shipments that are differentiated with respect to origins-destinations, shipment size, time, time reliability requirements, regularity of shipments and involving both ex ante transport planning and real-time control.
This coordination task is normally done by separate, or simultaneous, contracting between shippers and transport operators. However, markets where transactions between suppliers and buyers for multiple goods are negotiated in separate distributed negotiations may fail to result in efficient allocations in such settings (Walsh et al. 2000).
In the next section we will briefly consider an existing train “corridor” case, showing that this way
of contracting may not perform sufficiently well.
2.3. A Green Rail Corridor: The case of Scand Fibre Logistics1
In a trial conducted by Deutsche Bahn, very long freight train sets are operated between Maschen (Hamburg) and Ringsted at Zealand in Denmark (Nelldal 2009). A possible next step would be to extend these trains over the Öresund bridge to Sweden, for instance to the rail hub at Hallsberg (200 km west of Stockholm). This is the core of a recent suggestion to launch a GC initiative for Hallsberg-Maschen, possibly as part of an extended North-South European rail corridor from Narvik (in northern
1 Interviews for this case study were made by Jonna Flodman and Maria Gezici in 2010. Some basic facts are found in Godset (2011).
9
Norway) to Naples, Italy. In fact, the Hallsberg-Maschen route is already part of a train corridor operated by freight shuttles. This is the result of a collaborative effort by a group of large paper-exporting companies in Sweden.
Scand Fibre Logistics AB (SFL) thus delivers and develops logistics and rail-based transport services for the Swedish forest industry. Originating from a sea shipping division within Assidomän AB, SFL started train operations in 1999. It is presently owned with equal shares by the five paper companies Korsnäs AB, Billerud AB, SmurfitKappa Kraftliner AB, Mondi Dynäs AB Holmen AB. Only one of the large Swedish paper companies, The Swedish-Finnish Stora Enzo, has not joined SFL. Stora Enzo has developed its own transport system using containers of a non-standard size that
therefore are difficult to integrate with the systems used by SFL.
Until recently the SFL system was based on trains with ordinary wagonload systems running from the paper mills located all over Sweden to the rail hub Hallsberg. From Hallsberg, dual-system locomotives took the wagons through Denmark or by ferries to Hamburg (Maschen). In Maschen, these wagons were connected to train sets for final destinations in Germany, the Netherlands,
Belgium, Poland, Spain, Italy and the Czech Republic. SFL has however now acquired train systems (called Rail11) that can go directly from the ten papers mills at different places all over Sweden to Germany (Hamburg and Dortmund) and further, or to Swedish harbors in Göteborg and other places. It also operates train systems starting in Southern Sweden (Malmö). The trains go via three regional nodes (Ånge, Gävle and Norrköping) and are then combined to as long and heavy train sets as possible in Malmö. In the homeward direction all wagons are collected in Hamburg and driven in long train sets to Hallsberg, from which they are distributed back to the paper mills.
SFL currently has 5-7 daily outward trains (30-trains a week) and it owns 42 000 wagons. This covers 90 percent of the needs; the rest is covered by purchases on spot markets. The trains are operated by Green Cargo, Hector Rail, and Captrain. The total outward annual shipment is 2.4 million tons
10
In Sweden, the cargo is loaded by the shippers; all other loading is done by SFL or is contracted. A German wagonload system is used with long wagons that take three containers. However, shippers often have smaller shipments of specific paper assortments that do not fill a whole wagon, sometimes not even one container, which means that the full rent of the wagon has to be paid. An alternative that is currently considered is therefore to build an outbound distribution warehouse serving several customers for consolidation of freight.
SFL transports import goods to Sweden, for instance wine and liquor, waste paper, construction material and components for Volvo Equipment Construction. The shippers have different
requirements; some, like exporters of pasta, wine and liquors from Italy have strict time demands, others are willing to pay more and also accept a longer transport time for a “green” transport. All
shipments are planned in advance but some are contracted with a short notice.
Shipments on SFL trains are ordered one day in advance; orders must be posted before 9 am the day before the shipment is to be made.
However, while the load capacity is more or less fully utilized in the outward direction, the load factor on return is a mere 40 percent. This is a major weakness of the current system that only to a minor extent is mitigated by the energy efficiency gain accomplished by the longer train sets on the way back to Sweden. This is therefore the main obstacle that has to be overcome if the SFL system is to be part of a “green” corridor.
SFL has operated for a long time and has a well developed marketing department that is
supported by some of the largest paper companies in Sweden. Looking for ways to increase the overall load factor, a natural starting point is to consider the general structure of the market, and in particular how transport contracts are made. As we already have indicated, a natural suspect is the separate contract by contract process between shippers and transport operators. A logistics system is a complex network with intrinsic public good features. In the next section we will present a contracting/ market mechanism that possibly may work better than traditional business contracting as a means to raise the overall capacity utilization in the network.
11
3. The combinatorial auction mechanism
A combinatorial auction is an efficient bidding mechanism that can be applied when multiple contracts are to be awarded in the same tendering process (Vohra and de Vries 2003). The mechanism gives the individual shipper (auction) or supplier (procurement auction) an option to condition his bid on a separate contract upon the outcome of his bids on other contracts in the same tender. Hence, it enables both smaller and larger shipper/suppliers to bid more competitively on more contracts without being exposed to the risk of winning too few or too many contracts. The option to submit bids on bundles of contracts or to express maximum capacity, when multiple contracts are auctioned out (combinatorial bids), has the potential to reduce auctioning/procurement costs, thus value is added to the
auctioner/procurer.
Walsh et al. (2000) consider the use of combinatorial auction for supply chain formation. They consider a case where a “market-maker” auctions the most important activities in the market using a one-shot combinatorial auction. If bidders bid their true valuations then this mechanism, unlike separate distributed contracting will yield an efficient allocation. However, with this mechanism, agents may be willing to place more aggressive strategic bids than they would do with separate negotiations. They conclude that there are roles for both distributed separate and combinatorial auctions in supply chain formation.
Roughly, one can distinguish between two types of combinatorial bids. The first type offers a discount if the shipper/supplier is awarded a package of contracts, pre-determined by the purchaser or arbitrary chosen by her. The second type of combinatorial bids expresses that the shipper/supplier has a limited capacity, or additional costs for engaging, to fulfill more than a certain number of contracts. The shipper/supplier submits stand-alone bids on a number of contracts, but in an addendum states that he is only prepared to accept a maximum number of contracts or contracts up to a given maximum contract value, or up to a given maximum physical volume. The shipper/supplier can also submit stand-alone bids on several of the contracts, but will in an addendum stipulate negative discounts; that is to say, if they are awarded more than a certain number of contracts, then all bids should be raised by
12
Combinatorial auctions are difficult to implement, mainly for two reasons. Firstly, the mechanism is NP-complete as it requires software that can handle the computational complexity to determine the winner. If the number of items and bids – single bids as well as package bids – are sufficiently large, one might end up with an unsolvable problem where a polynomial-time algorithm to find the optimal allocation is unlikely ever to be found. However, progress in combinatorial algorithms and computer-processing capacity in the last few years has increased the use of the mechanism in industrial
procurement, mainly in transportation.
Secondly, combinatorial bidding is strategically very complex for bidders and also very complex to design. Unlike single-item auctions, multiple item environments still lack theoretical guidelines for making general predictions concerning revenue and efficiency ranking for various types of
combinatorial auctions. Krishna and Rosenthal (1996) show in a sealed-bid second-price auction, with two objects and a single global supplier, that a simultaneous auction outperforms the combinatorial auction when synergies are present. The reason is that the global supplier engages in “overbidding”
where the supplier is bidding above his value, thus facing the possibility of a loss ex post.2 When it
comes to the first-price multiple unit auctions, there is to our knowledge, no similar proof derived showing that a simultaneous first-price auction outperforms a first-price combinatorial auction. Also, the number of empirical and experimental studies comparing the outcome from the two auction formats is very limited. If any, there is weak support that the first-price combinatorial mechanism generates, at least, the same low cost as the simultaneous format (e.g. Epstein et al., 2004; Lunander and Nilsson, 2004; Cantillon and Pesendorfer, 2006; Lunander and Lundberg, 2009).
Cantillon and Pesendorfer (2006) refer to the results obtained in McAfee et al. (1989) and show that the presence of a combination bid does not necessarily indicate that the bidding firm is facing synergies. The submission of a combination bid can be equally motivated by strategic price discrimination. Cantillon and Pesendorfer conclude that the welfare consequences of first-price combinatorial procurement auctions are an open empirical question. However, the more that the
2 A similar result is found in Kagel and Levin (2005) in which they derive and analyze bidding behavior in a sealed-bid uniform price auction when synergies are present. They find that a supplier with multi-unit demand has, for some intervals of values, an incentive to submit bids above the valuation. Testing their prediction in an experiment, they find that subjects exhibit no reluctance to overbidding.
13
bidders’ unit costs are negatively correlated in the number of contracts won, the more likely it is that
the combination bids reflect synergies across contracts rather than strategic price discrimination.
A number of studies on combinatorial bidding focuses on the inherent winner determination problem and how to express combined bids (e.g. De Vries and Vohra, 2003; Sheffi, 2004; Cramton et
al., 2006; Abrache et al., 2007). Also, there is quite a large amount of literature analyzing the strategic
implications of combinatorial bidding and how to design combinatorial bidding. A number studies consider the Vickrey-Clarke-Groves (VCG) mechanism (e.g. Krishna and Rosentahl, 1996; Holzman and Monderer, 2004; Yokoo et al., 2004; Ausubel and Milgrom, 2006; Chew and Serizawa, 2007).3
Combinatorial auctions are used frequently today in the procurement of transportation services, especially in the U.S. (Sheffi, 2004, Elmaghraby and Keskinocak 2003). In these auctions, the shipper asks the bidding carriers to quote prices on groups or packages of lanes, in addition to individual lanes. The carriers can form their own packages based on their own economic conditions, their existing client base, their drivers’ domiciles, and their underlying maintenance networks. The idea is to help carriers
form packages that, if granted, will allow them to cut their costs for operating the lanes included in the packages and pass part of the lower costs on to the shipper in the form of lower bids.
Given the theoretical ambiguities, it is clear that the question of the role that combinatorial auctioning can play as a means for improving efficiency in utilization of large-scale transport
capacities is on a case where the proof of the pudding is in the eating, i.e., in the practical experience. For this reason we will in next section briefly review recent experience from some combinatorial auctions in Sweden.
5. Experiences from combinatorial auctions in Sweden
In this section, borrowing from Lunander and Lundberg (2011) we briefly describe the
procurement of four different public services (road resurfacing, elderly care, cleaning services, and bus services) carried out in Sweden over the period from 2003 to 2010. The tenders were all sealed-bid combinatorial auctions where suppliers had the option to submit bids on bundles of contracts as well
14
as the option to declare limited capacity. In all tenders, suppliers were required to submit a stand-alone bid for every contract being part of a package bid. The suppliers were, with some minor exceptions, free to bid on any bundle of contracts. In some of the tenders, the procurer imposed a constraint upon the maximum number of contracts allowed to be in a package bid, or a constraint upon the maximum size of the offered discount in a package bid. Finally, the awarding of contracts was, in some of the tenders, based on the lowest price only, taking the form of the standard first-price sealed bid auction. In other tenders, contracts were based on multidimensional bids awarded according to a scoring rule where suppliers received a negative or a positive discount on their bids depending on the quality dimension of the bid.
Case 1: Asphalt resurfacing. Asphalt resurfacing in Sweden is characterized by a relatively high
degree of homogeneity with different suppliers offering similar quality and performance. Most suppliers operate over the whole of Sweden and submit tenders for contracts in all regions. Contracts are mostly awarded on the basis of price alone. Suppliers do, however, differ significantly in their capacity to produce and lay asphalt and this can vary according to their current workload. Asphalt resurfacing has a high fixed cost and a relatively low marginal cost – the marginal cost being the cost to produce and lay an additional ton of asphalt. At any time, it is likely that there will be a contract size which is most desirable for each supplier, best exploiting their spare capacity and enabling them to bid their most competitive price. In this situation, there is a tendency for collusion between
suppliers which, in their eyes, can be ‘legitimized’ by the fact that it should lead to a reduction in total
cost. The inherent problem when suppliers coordinate their bidding behavior is, of course, that they take advantage of the situation to offer prices which are higher than they need be.
In order to try to lower the incentives for collusion, the Swedish Road Administration (SRA) since 2002 allow suppliers to submit combinatorial bids when bidding for asphalt resurfacing contracts. Lunander and Lundberg (2011) show that suppliers have been very successful in using package bids to get business. For every year that was studied, more than 70 percent of the contracts were awarded to package bids.