SIXTH FRAMEWORK PROGRAMME
PRIORITY 1.6.2
Sustainable Surface Transport
CATRIN
Cost Allocation of TRansport INfrastructure cost
Deliverable D1
Cost allocation Practices in the European Transport
Sector
Final Version
March 2008
Authors:
Heike Link, Anna Stuhlemmer (DIW Berlin), Mattias Haraldsson (VTI), Pedro
Abrantes, Phil Wheat, Simon Iwnicki, Chris Nash, Andrew Smith (ITS)
with contribution from partners
Contract no.: 038422
Project Co-ordinator: VTI
Funded by the European Commission
Sixth Framework Programme
CATRIN Partner Organisations
VTI; University of Gdansk, ITS Leeds, DIW, Ecoplan, Manchester Metropolitan University, TUV Vienna University of Technology, EIT University of Las Palmas; Swedish Maritime Administration,
CATRIN - Deliverable D 1 – January 2008 2
CATRIN
FP6-038422
Cost Allocation of TRansport INfrastructure cost
This document should be referenced as:
Link, H., Stuhlemmer, A. (DIW Berlin), Haraldsson, M. (VTI), Abrantes, P., Wheat, P., Iwnicki, S., Nash, C., Smith, A., CATRIN (Cost Allocation of TRansport INfrastructure cost), Deliverable D 1, Cost allocation Practices in the European Transport Sector. Funded by Sixth Framework Programme. VTI, Stockholm, March 2008
Date: March 2008 Version No: 1.0
Authors: as above.
PROJECT INFORMATION
Contract no: FP6 - 038422
Cost Allocation of TRansport INfrastructure cost Website: www.catrin-eu.org
Commissioned by: Sixth Framework Programme Priority [Sustainable surface transport] Call identifier: FP6-2005-TREN-4
Lead Partner: Statens Väg- och Transportforskningsinstitut (VTI)
Partners: VTI; University of Gdansk, ITS Leeds, DIW, Ecoplan, Manchester Metropolitan University, TUV Vienna University of Technology, EIT University of Las Palmas; Swedish Maritime
Administration, University of Turku/Centre for Maritime Studies
DOCUMENT CONTROL INFORMATION
Status: Draft/Final submitted
Distribution: European Commission and Consortium Partners
Availability: Public on acceptance by EC
Filename: Catrin D1 140308-final.doc
Quality assurance: Jan-Eric Nilsson
Co-ordinator’s review: Gunnar Lindberg
Content
Abbreviations ... 5
0 Executive Summary ... 6
1 Introduction ... 10
2 State of the art – Studies on road infrastructure costs ... 11
2.1 Marginal cost studies ... 11
2.1.1 Econometric cost function studies ... 12
2.1.2 Duration approaches ... 17
2.2 Fully allocated cost studies (FAC studies)... 20
2.2.1 Indications on cost variability and weight-dependent costs ... 29
2.2.2 Allocation procedures and allocation factors used ... 30
2.3 Open issues arising from the review of studies ... 35
3 Rail ... 37
3.1 Econometric studies... 38
3.1.1 Accounting for infrastructure characteristics, capability and condition ... 38
3.1.2 Methodological approach... 41
3.2 Engineering studies... 47
3.2.1 UK ORR’s engineering model (Booz Allen Hamilton & TTCI UK 2005). 47 3.2.2 Proposed methodology for Sweden ... 49
3.2.3 Differences between the UK and the Swedish proposed methods ... 51
3.3 Cost-allocation studies... 52
3.4 Key outstanding research issues ... 52
4 Air transport ... 54
4.1 Marginal cost studies ... 54
4.1.1 Studies on the costs of airport operation... 54
4.1.2 Studies on the costs for en-route services... 63
4.1.3 Studies on wear& tear costs of runways ... 63
4.2 Fully allocated cost studies ... 65
4.2.1 The GRA cost allocation study for the US Federal Aviation Authority... 65
4.2.2 Summary of the discussion of FAA practices of cost allocation ... 70
4.2.3 Cost Allocation Report of Europe Economics for the CAA... 74
4.2.3.1 Approaches suggested by Europe Economics for allocating airport operating costs... 74
4.2.3.2 Approaches to allocating assets ... 77
4.3 Open issues ... 78
5 Conclusions ... 82
CATRIN - Deliverable D 1 – January 2008 4
List of Tables
Table 1: Comparison of econometric cost function studies for road infrastructure... 15
Table 2: Characteristics and results of the duration approach studies ... 19
Table 3: Characteristics of road cost allocation studies ... 21
Table 4: Allocation procedures in fully allocated road cost studies ... 23
Table 5: Indications on variable infrastructure costs in road cost accounting studies ... 29
Table 6: Indications on weight-dependent costs in road cost accounting studies... 30
Table 7: Allocation factors used in fully allocated road cost studies... 31
Table 8: PCU figures used in Germany ... 33
Table 9: PCU figures used in different junction models and in traffic models in the UK... 34
Table 10: PCU figures used in the Dutch allocation method... 35
Table 11: PCU figures used in Sweden... 35
Table 12: Summary of empirical studies on marginal rail infrastructure costs ... 38
Table 13 Infrastructure characteristics, capability and condition measures used in econometric rail cost studies ... 40
Table 14: Methodological approaches used in econometric rail cost studies ... 41
Table 15: Calculation of the scaled usage elasticity for rail infrastructure... 44
Table 16: Results of empirical studies on marginal rail infrastructure costs ... 45
Table 17: Cost variability with traffic by asset type currently in use in the UK... 51
Table 18: Cost variability with traffic by asset type used in the UK ORR’s 2005 access charging review ... 52
Table 19: Model estimates for airport cost categories (Doganis and Thompson 1973) ... 55
Table 20: Long-run average costs for airports with high passenger volumes in the UK... 57
Table 21: Summary of marginal cost estimates for airports ... 61
Table 22: En route service incremental cost estimates in the FAA study for U.S. airports... 63
Table 23: NAPTF flexible pavement tests for 6- and 4-Wheel aircraft configurations... 65
Table 24: Allocation of direct air traffic service costs to facility groups... 67
Table 25: Directly allocated, fixed and common costs of non-air traffic services - U.S. airports ... 67
Table 26: FAA user groups ... 68
Table 27: Output measures and quality indicators of the cost of service models in the FAA study for U.S. airports ... 69
Table 28: Shares of incremental, fixed and common costs per facility group in the FAA study for U.S. airports... 69
Table 29: Costs, revenues and cost recovery of General Aviation in fiscal year 2001... 70
Table 30: Selected air navigation service providers cost recovery practice. ... 74
Table 31: User dependent and fixed costs for maintenance and repair in the Netherlands in 2002, in €/km (costs in million €) ... 80
List of Figures
Figure 1: Marginal cost curves obtained by available studies ... 13Figure 2: Overview of the FAA cost allocation process (Source: GRA Inc. 1997, p. 10)... 66
Figure 3: Share of general aviation costs from a set of FAA cost allocation studies: An allocation of fiscal year 2001 FAA costs in billions of 2001 Dollars ... 72
Abbreviations
AADT Annual average daily traffic
AASH(T)O road test Road test carried out by the American Association of State Highway and Transportation Officials
AC Average costs
AGM Average gross mass
ATM Air traffic movements
CoA Coefficient Agressivite
DLC Dynamic load coefficient
ESAL Equivalent single axle load
EGTM Equivalent gross tonne mile
EVM Equivalent vehicle mile
FAA Federal Aviation Authority
FAC Fully allocated costs
FHA Federal Highway Administration
GTM Gross tonne mile
HGV Heavy goods vehicles (goods vehicles with a maximum GVW
equal or more than 3.5 tonnes)
LGV Light goods vehicles (goods vehicles with a maximum GVW
less than 3.5 tonnes)
MC Marginal costs
ORR Office of the rail regulator
PCU Passenger car unit
USM Unsprung mass
Vkm vehicle km
WLU Work load units (1 WLU equals to 1 passenger incl. baggage or
CATRIN - Deliverable D 1 – January 2008 6
0
Executive Summary
The CATRIN project aims to support policy makers in implementing efficient pricing strategies in all modes of transport, e.g. pricing strategies which arte based on the social marginal cost principle. Specifically, it addresses the allocation of infrastructure costs in all modes of transport. The motivation to conduct a research project on this issue is the fact that available studies on marginal infrastructure costs tend to provide some type of “average” marginal cost estimates but often fail to obtain marginal cost estimates by types of vehicles or groups of users. On the other hand, a range of fully allocated cost studies are available which provide average cost estimates by type of vehicle. However, using these studies for pricing purposes bears problems. Average costs are not the appropriate basis for efficient pricing, and the allocation methods used in these studies often tend to allocate arbitrarily fixed, common and joint costs to vehicle types. As a consequence, average costs by vehicle types vary greatly, depending on the methodology used.
This deliverable D1, Cost Allocation practices in the European Transport Sector, is one of two reports from WP1 – State of the art methodology and survey of existing practice. It summarises the existing practice of cost estimation and cost allocation in all modes of transport. Its purpose is to identify gaps and open issues in allocation methods which currently prevent the use of marginal cost figures in pricing, and to analyse the methodological background of available studies. As the whole CATRIN project, the focus is on infrastructure costs, e.g. on the costs of providing, maintaining, renewing and operating infrastructure. The second deliverable from WP1 provides the internal blueprint for the case studies to be conducted in CATRIN.
As far as available within each mode, two types of studies are analysed: First, genuine marginal cost studies either based on econometric methods or on engineering approaches. The focus in analysing marginal cost studies is rather on the type of results obtained than on figures. Second, fully allocated cost studies. The main interest is here whether the underlying allocation methods are based on coherent assumptions within each country and supported by appropriate databases, as well as to analyse whether assumptions differ across countries.
The analysis of available research shows a varying picture across modes. Marginal cost studies have emerged over the recent years within EU funded projects, in particular for road and rail. Fully allocated cost studies exist traditionally in the road sector where a considerable body of estimation and allocation methods is available, and though to a lesser extent in the rail sector and in aviation. The situation is rather poor in waterborne transport.
The review of available research on estimating marginal infrastructure costs and the analysis of methodologies used and quantitative results obtained has revealed a specific problem encountered in all studies. This problem relates to the need of any quantitative studies to have access to comprehensive databases which allow to extract the necessary information in the required level of disaggregation and to apply advanced estimation techniques. However, across modes data availability on the cost of maintaining, operating and renewing transport infrastructure as well as on the use of infrastructure is poor. Most projects in this line of research therefore have to allocate much resources to compile data in a form which allows to draw any conclusions of policy relevance. It is therefore noteworthy that some common conclusions have been emerging from cost studies in different countries.
From the review of national practice and available research we have gained the following insights:
- Bearing the difficulties in obtaining and compiling appropriate databases in mind and
given the fact that estimating marginal infrastructure costs has been a relatively young field of research, it can be concluded that research on estimating marginal infrastructure costs has made remarkable progress in understanding marginal costs in different modes. Nevertheless, there remain outstanding issues to be solved.
- One of the most important policy-relevant findings from marginal cost studies is evidence
on the degree of cost variability and on the cost elasticity, e.g. the ratio between MC and AC. For both road and rail, the studies provide evidence that the mean value of the cost elasticity is generally below 1 (road) and 0.5 (rail) respectively. Furthermore, the cost elasticity increases with the time horizon of the measure (for example for road operation: close to zero, for road maintenance: 0.12-0.69, for road renewals: 0.57-0.87, for rail maintenance: 0.07-0.26, for rail maintenance and renewals: 0.18-0.302). Across studies, the variation of the cost elasticity is larger for studies which deal with maintenance costs
CATRIN - Deliverable D 1 – January 2008 8
than for those dealing with other types of infrastructure measures which might hint at problems with defining and quantifying maintenance expenditures.
- At the current frontier of research, marginal cost studies have not yet achieved
convergence regarding the shape of the MC curve (decreasing versus increasing). This holds in particular true for the road sector, to some extent also for rail. It appears that for rail the most consistent finding from econometric studies is that i) marginal costs fall with traffic levels, and, ii) are initially very high with low usage levels but fall then sharply. This finding is in contrast to the engineering expectation of a proportional increase of wear & tear with usage.
- For all modes available marginal cost studies obtain “average” marginal cost estimates
but fail to provide estimates which are disaggregated by vehicle types or user groups. The MC results are therefore currently not yet in the form needed for pricing policy.
- In air transport, the majority of studies suggest increasing returns to scale of airport
maintenance and operation which implies a decreasing marginal cost. Similar to rail, non-linearities are strong for a lower range of usage and rather weak for higher output values. The comparability of results is restricted by the use of different output measures (air transport movements, passenger numbers, work load units) in the studies. Similar to road and rail marginal cost estimates per aircraft type are lacking so far.
- Fully allocated cost studies play a major role in for the road sector. The analysis of
allocation procedures used in these studies has shown that there is a considerable variation in the methodologies and allocation factors. Almost all studies split total costs either into fixed and variable costs or into weight-dependent and non-weight dependent costs, an information which can be used as proxy for marginal cost and, in case of weight-dependent costs, as a starting point for allocating marginal costs to vehicle types.
- Further information from fully allocated cost studies are the allocation factors used. The
most important factors are the ASSH(T)O factors for allocating weight dependent costs and PCU figures for allocating other types of costs other parts of variable costs but also fixed costs if such an allocation is necessary to meet a budget constraint). The review has shown that, while in principle the definition and calculation of the ASSH(T)O is straightforward, country-specific differences arise from the different disaggregation of mileage data by vehicle weight classes, the measurements of vehicle loadings, from the
distribution of total weight to the axles and from a different reflection of the fact that axle configurations such as tandem or triple axles cause higher road damages than single axles.
- In contrast to the AASH(T)O factors, PCU figures vary between countries not only to
different disaggregations of vehicle mileage data in transport statistics but also due to methodological differences. Depending on the underlying concept, PCUs are based on average speed, traffic density, average distance between vehicles within the traffic flow, safety distances and delays. The impact of heavier vehicles on traffic flow is considered by vehicle characteristics such as length and the ratio between weight and engine power on the one hand, and the existence and length of gradients, the share of trucks in the traffic flow, the number of lanes and traffic density on the other hand.
CATRIN - Deliverable D 1 – January 2008 10
1
Introduction
The CATRIN project aims to support policy makers in implementing efficient pricing strategies in all modes of transport, e.g. pricing strategies which are based on the social marginal cost principle. Specifically, it addresses the allocation of infrastructure costs in all modes of transport. The motivation to conduct a research project on this issue is the fact that available studies on marginal infrastructure costs tend to provide some type of “average” marginal cost estimates but often fail to obtain marginal cost estimates by types of vehicles or groups of users. On the other hand, a range of fully allocated cost studies are available which provide average cost estimates by type of vehicle. However, using these studies for pricing purposes bears problems. Average costs are not the appropriate basis for efficient pricing, and the allocation methods used in these studies often tend to allocate arbitrarily fixed, common and joint costs to vehicle types. As a consequence, average costs by vehicle types vary greatly, depending on the methodology used.
This deliverable D1, Cost Allocation practices in the European Transport Sector, is one of two reports from WP1 – State of the art methodology and survey of existing practice. It summarises the existing practice of cost estimation and cost allocation in all modes of transport. Its purpose is to identify gaps and open issues in allocation methods which currently prevent the use of marginal cost figures in pricing, and to analyse the methodological background of available studies. As the whole CATRIN project, the focus is on infrastructure costs, e.g. on the costs of providing, maintaining, renewing and operating infrastructure. Obviously, there exists a close relationship between scarcity and congestion costs and infrastructure. This relationship is dealt with in deliverable D3 of CATRIN and will not be discussed in detail here. The second deliverable from WP1 provides the internal blueprint for the case studies to be conducted in CATRIN.
This document is organised a s follows. Chapter 2-5 summarises the review of existing studies for road, rail, air transport and waterborne transport. As far as available within each mode, two types of studies are analysed: First, genuine marginal cost studies either based on econometric methods or on engineering approaches. The focus in analysing marginal cost studies is rather on the type of results obtained than on figures. Second, fully allocated cost studies. The main interest is here whether the underlying allocation methods are based on coherent assumptions within each country and supported by appropriate databases, as well as to analyse whether assumptions differ across countries. Chapter 6 concludes.
2
State of the art – Studies on road infrastructure costs
The available research analysed in this report falls into two groups of studies. First, genuine marginal cost studies which are either based on observed spending for roads and apply neoclassical production and cost function theory on this type of data, or studies which use engineering-based information on road damage, optimal road design and optimal pavement maintenance and renewal cycles for estimating marginal costs. Second, fully allocated cost studies where total road infrastructure costs are estimated for specific cost categories and allocated to vehicle categories by using allocation factors.
2.1 Marginal cost studies
Over the recent years a number of marginal cost studies dealing with maintenance and renewal costs of roads have been performed, mainly within the European research projects UNITE and GRACE. Two general approaches can be distinguished.
First, econometric studies which estimate a functional relationship between the cost of infrastructure operation, maintenance and renewal, and the traffic volume, factor input prices for infrastructure measures, road characteristics and climate. The relationship identified between cost and traffic volume serves then as the basis for deriving marginal costs of infrastructure use. Econometric cost function analysis uses observed, real expenditures for infrastructure maintenance, repair and operation and observations of (potential) cost drivers, either based on cross-sectional or longitudinal data. Second, so-called duration approaches which use (physical) measurements of road damages or measurements of road condition to estimate a relationship between these measurements, traffic volume and other explanatory variables. The obtained damage-traffic relationships are evaluated in monetary terms by using unit costs for road work. These approaches refer exclusively to renewal costs. A lifetime or duration function is estimated as a function of infrastructure characteristics, geographical and climate information and the traffic utilisation as in the econometric approach. The change in the lifetime as a consequence of traffic change affects the present value of future renewal costs and is thus the base for the marginal cost calculation. In the following, we analyse the available studies under three aspects:
- Do these studies provide marginal cost estimates for different types of vehicles? - Can a general pattern for the shape of the marginal cost curve be concluded?
CATRIN - Deliverable D 1 – January 2008 12 - What are the open issues arising from available marginal cost studies?
2.1.1 Econometric cost function studies
The available studies differ regarding the type of road measure anaylsed (operation: 2 studies, maintenance: 4 studies, renewals: 4 studies, sum of maintenance and renewals: 1 study), the type of road (motorways, national roads, all roads) as well as regarding the methodological approach (table 1).
The majority of econometric cost function studies for road infrastructure are based on single-equation models. In these models factor inputs and input prices are neglected, mainly due to lack of the necessary cross-sectional data1. The functional form used is either a log-linear specification (Sedlacek et al. 2002, Schreyer et al. 2002, Bak et al. 2006, Haraldsson 2007) or a translog-model (Link 2002 and 2006, Haraldsson 2006a). Costs are explained by traffic load, and other influence factors such as number of lanes, etc. Haraldsson 2007 uses a dynamic model with a lag cost variable among the regressors which allows to derive both a short-run and a long- run elasticity.
Most of the studies have derived non-linear marginal cost curves, with weaker non-linearities for increasing traffic volumes. The mean cost elasticity (e.g. the ratio between marginal and average costs) is generally below 1 (see table 1), suggesting that infrastructure cost charges based on marginal costs would not recover full costs2.
The cost elasticity is highest for renewals and lowest for road operation with maintenance ranging between the two, indicating that the ratio between MC and AC decreases with a decrease of time horizon of the road measure. Furthermore, there is some evidence that road operation, e.g. measures with less than a 1 year’s horizon, seems to be a fixed cost activity. The average cost elasticity ranges between 0.12 and 0.69 for maintenance (with a value of 0.12 for Poland as an extreme value and 0.27 in Haraldsson 2007 being the short term eleasticity derived from a dynamic model) and between 0.57 and 0.87 for renewals. The variation of the cost elasticity across the studies is larger for studies which deal with maintenance costs than for those dealing with other types of infrastructure measures which might hint at differences in defining and quantifying maintenance expenditures.
1 Some studies also argue that it is reasonable to assume prices to be the same over the sections. 2 Except the Austrian study which obtained a cost elasticity slightly above 1.
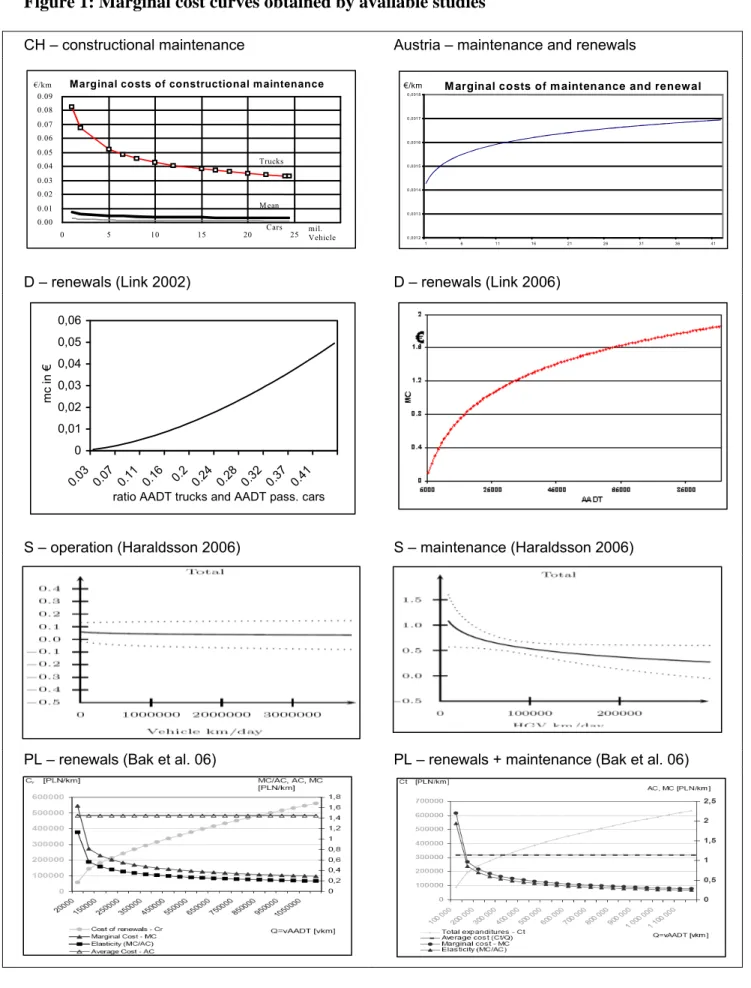
Figure 1: Marginal cost curves obtained by available studies
CH – constructional maintenance Austria – maintenance and renewals
D – renewals (Link 2002) D – renewals (Link 2006)
S – operation (Haraldsson 2006) S – maintenance (Haraldsson 2006)
PL – renewals (Bak et al. 06) PL – renewals + maintenance (Bak et al. 06) 0.00 0.01 0.02 0.03 0.04 0.05 0.06 0.07 0.08 0.09 0 5 10 15 20 25 mil.Vehicle €/km Cars Trucks M ean
Marginal costs of constructional m aintenance M arginal costs of m aintenance and renewal
0,0012 0,0013 0,0014 0,0015 0,0016 0,0017 0,0018 1 6 11 16 21 26 31 36 41 €/km 0 0,01 0,02 0,03 0,04 0,05 0,06 0.03 0.07 0.11 0.16 0.2 0.24 0.28 0.32 0.37 0.41
ratio AADT trucks and AADT pass. cars
mc i
CATRIN - Deliverable D 1 – January 2008 14
The majority of available econometric research (Sedlacek et al. 2002, Schreyer et al. 2002, Haraldsson 2006a, Haraldsson 2007, Bak et al. 2006) suggests a decreasing marginal cost curve (figure 1). Only an Austrian study (Sedlacek et al. 2002) and a German study (Link 2006, which is the only study based on a full system of translog model and factor input equations) found an increasing marginal cost curve. Both studies refer to renewals (the Austrian study analyses the sum of maintenance and renewals). However, it remains open for further reserach whether the differences in the shape of MC curves are caused by different types of road measures or by different methodological approaches.
It appears that due to multicollinearity problems econometric models have so far failed to estimate marginal costs for different types of vehicles. Most studies (Sedlacek et al. 2002, Schreyer et al. 2002, Haraldsson 2006a, Bak et al. 2006) use vkm of total traffic as explanatory variable, Haraldsson 2006 and 2007 estimates a model with the AADT of trucks and passenger cars, and Link 2006 uses truck-vkm. This implies that marginal cost estimates are rather “average” MC estimates. For the purpose of infrastructure charging these average MC estimates need further to be differentiated by using allocation factors from engineering knowledge or from expert opinion.
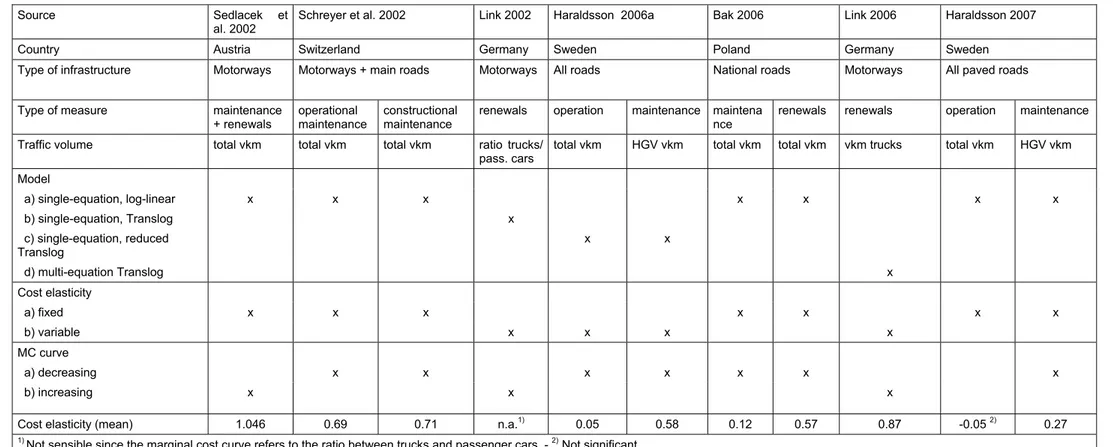
Table 1: Comparison of econometric cost function studies for road infrastructure
Source Sedlacek et
al. 2002
Schreyer et al. 2002 Link 2002 Haraldsson 2006a Bak 2006 Link 2006 Haraldsson 2007
Country Austria Switzerland Germany Sweden Poland Germany Sweden
Type of infrastructure Motorways Motorways + main roads Motorways All roads National roads Motorways All paved roads
Type of measure maintenance
+ renewals
operational maintenance
constructional maintenance
renewals operation maintenance maintena
nce
renewals renewals operation maintenance
Traffic volume total vkm total vkm total vkm ratio trucks/
pass. cars total vkm HGV vkm total vkm total vkm vkm trucks total vkm HGV vkm
Model a) single-equation, log-linear x x x x x x x b) single-equation, Translog x c) single-equation, reduced Translog x x d) multi-equation Translog x Cost elasticity a) fixed x x x x x x x b) variable x x x x MC curve a) decreasing x x x x x x x b) increasing x x x
Cost elasticity (mean) 1.046 0.69 0.71 n.a.1) 0.05 0.58 0.12 0.57 0.87 -0.05 2) 0.27
1) Not sensible since the marginal cost curve refers to the ratio between trucks and passenger cars. - 2) Not significant.
2.1.2 Duration approaches
Amongst the duration approaches the best known and most widely used instrument for allocating road wear costs to different vehicles is probably the fourth power rule. It is based on the AASH(T)O-tests that were conducted in USA in the 1950/60es (see Highway Research Board 1961). According to this rule road wear, and consequently the corresponding marginal cost, is proportional to the number of vehicle equivalence factors (standard axles). An axle with load A thus causes a damage/cost corresponding to (A/B)4 times the damage/cost caused by axle load B.
However, this rule is subject to some questions. First, it is not obvious that the power should be 4 in every case, even though it might be the best choice in general. The power varies with the type of distress that is in focus. Furthermore, the power can be expected to vary with road quality, road design3, climate and several other facts (Hjort 2007). Second, the static axle load is not sufficient to explain road wear which is also influenced by dynamic axle loading. When the vehicle is moving, unevenness of the road will cause the vehicle to move up and down. “The magnitude of this dynamic variation depends on the vertical dynamics of the vehicle, including such factors as the mass and stiffness distribution of the vehicle structure, payload mass distribution, suspension and tyres, and on the road surface’s longitudinal profile and the speed of the vehicle.” (Hjort 2007, p.7) The magnitude of dynamic loads is mostly expressed as the Dynamic Load Coefficient (DLC). This measure essentially expresses load variation around the static load, and considers also new technical developments at vehicles such as road-friendly suspensions. The magnitude of this coefficient is 5-10 percent for well damped suspensions and 20-40 percent for less road friendly suspensions. Apart from this, the different ways to place axles in relation to each other might have an important role. It is for instance not proper to treat the distress caused by a tandem or triple axle as simply the sum of the distress from two different axles, since the distance between the axles is an important factor (Hjort 2007, pp. 7-84).
3 One point of criticism stated regarding the design of the AASH(T)O tests was that roads were
over-dimensioned.
4 For a more detailed discussion on the impacts of axle configurations and road-friendly suspensions see also
CATRIN - Deliverable D 1 – January 2008 18
The opportunities to conduct large-scale experiments such as the AASH(T)O road test are rather limited.5 Therefore, Newbery 1988 has developed an analytical approach which is known as the so-called fundamental theorem and which can be considered as a first formulation of the duration approach. The basic assumption of the duration approach is that the length of an interval between two renewal measures depends on the aggregate of traffic that has used a certain section. The major output from Newbery 1988, the so-called fundamental theorem, states that under certain assumptions – no damaging effect of weather, equal age distribution of the roads, constant traffic flows – and for a condition-responsive maintenance strategy6, the marginal cost of pavement resurfacing is exactly equal to the average resurfacing cost and the road damage externality7 is zero, e.g. the cost elasticity MC/AC equals 1. In contrast to Newbery 1988 who applies assumptions and engineering experience on the design life of a road, Small and Winston 1988 as well as Small et al. 1989 use the cross-sectional measurements of road condition from the original AASHTO test data. They re-estimate the life-time of roads as the time-span between necessary resurfacings of road pavement in dependence of road thickness, traffic load and aging (weathering effect). Their main results are that the lifetime of roads is shorter than the AASHTO-based design life, and that the relation between pavement life and axle-load follows rather a third-power law than the original fourth-power law. Ozbay et al. 2001 use traffic data and information on time intervals between resurfacing dates and the year of analysis for individual OD pairs of the Northern New Jersey highway network to estimate marginal resurfacing costs. They base their estimates on traffic data measured as vehicles per day instead of axle-load data.
Three recent Swedish studies apply a more refined approach (table 2). In these studies the MC is computed as a function of a deterioration elasticity 8 and the average cost. Lindberg 2002 takes into account that the number of standard axles which a road can accommodate after all is a function of the actual, not the predicted traffic volume. Adding or subtracting vehicles to
5 Newbery 1988 estimates that a replication of the AASHTO road test would cost over $300 million at 1980
prices. Note, however, that modern technical equipment has meanwhile been available which enables to assess the validity of the fourth power rule. Another workpackage of CATRIN explores the possible framework of this type of analysis.
6 A condition-responsive maintenance strategy means that the road authority decides to resurface any particular
road when it reaches a predetermined trigger value of roughness.
7 When a vehicle damages the road surface and increases its roughness, it thereby increases the vehicle operating
cost of subsequent vehicles. This cost imposed on subsequent vehicles represents a road damage externality (see Newbery 1988).
8 The deterioration elasticity is a measure of the responsiveness in pavement lifetime to a change in average
the original prediction will therefore affect the timing of a reinvestment and there is, consequently, a marginal cost associated with variations in traffic volume. While Lindberg 2002 assumes that the road is renewed as soon as a pre-defined terminal value is reached, Haraldsson 2006b bases the estimation on the observed intervals between two renewals. In contrast to Lindberg 2002 which uses standard axles as explanatory variable, Haraldsson 2006b includes the AADT of HGV and passenger cars, e.g. two traffic variables into the model. Furthermore, Haraldsson 2006b allows for random elements in the lifetime function by using a Weibull distribution. As long as the lifetime function is deterministic, the age distribution of roads is uniform. This implies, as is shown by Lindberg 2002, that the marginal cost is computed as the deterioration elasticity times the average cost. Assuming a Weibull distribution however implies that this should be adjusted by a factor relating from the age distribution of roads. In Haraldsson 2007 this factor is estimated to be 0.83 indicating that the assumption of Weibull distributed lifetimes leads to lower MC than would have been the case if a deterministic lifetime function had been assumed.
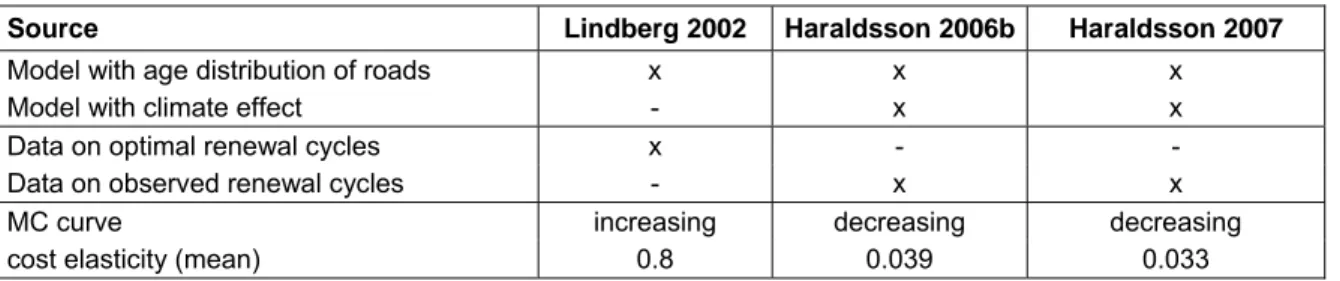
Table 2: Characteristics and results of the duration approach studies
Source Lindberg 2002 Haraldsson 2006b Haraldsson 2007
Model with age distribution of roads x x x
Model with climate effect - x x
Data on optimal renewal cycles x - -
Data on observed renewal cycles - x x
MC curve increasing decreasing decreasing
cost elasticity (mean) 0.8 0.039 0.033
The studies presented in table 2 are first empirical analyses of this type of methodology. Differences between studies relate to the shape of the cost curve and the value of the deterioration elasticity, pointing out the need to conduct further analyses of this type, ideally with improved databases. Interestingly, the recent studies from 2006 and 2007 do not only yield a different shape of the marginal cost curve (decreasing) but differ also considerably from Lindberg 2002 with respect to the mean cost elasticity (0.8 in Lindberg 20029, 0.039 and 0.33 in Haraldsson 2006b and 2007 respectively). The deterioration elasticity in Haraldsson 2006b and 2007 is very low. A probable explanation for that is failure to control for different
9 A mean cost elasticity of 0.8 for renewals seems to be supported both by econometric and by fully allocated
cost studies. For MC studies see: Link 2006 (0.87), Bak et al. 2006 (0.57), Scheyer et al. 2002 (cost elasticity for constructional maintenance which comes close to renewal work: 0.71), Sedlacek et al. 2002 (1.046). For FAC studies: The Danish study assumes that between 50% and 70% of reconstruction costs vary with traffic volume, the Australian allocation study suggests that 45% of road rehabilitation costs are weight-dependent. The UK allocation study even assumes that 100% of reconstruction and resurfacing costs are weight-dependent.
CATRIN - Deliverable D 1 – January 2008 20
pavement quality (thickness) in the empirical analysis. High traffic roads generally have a thicker pavement than low traffic roads. If this fact is not taken into account, it might seem like traffic only has a small impact on pavement lifetime.
Due to the type of data needed to apply the duration approach, most engineering-based studies provide marginal cost estimates per ESAL-km10 and reflect the damaging behaviour of different weight classes better than the currently available econometric studies. For pricing policy the results of this type of studies need to be aggregated into weight classes of vehicles, in contrast to the econometric studies discussed in section 2.1.1 where the estimates need to be further disaggregated.
2.2 Fully allocated cost studies (FAC studies)
Although not appropriate for efficient infrastructure charging, fully allocated cost studies are worthwhile to be analysed for the purpose of CATRIN for several reasons. First, some of these studies categorise total costs into fixed and variable elements, and the latter category is of interest for estimating marginal costs (see Link et al. 2007). Second, the available fully allocated cost studies use a variety of allocation methods to apportion different cost elements to different vehicle categories. A thorough analysis of these methods and a comparison of the allocation factors used to allocate variable costs can support the necessary disaggregation of the available “average” existing MC estimates11.
FAC studies aim to achieve recovery of total costs. The most common approach used in these studies is a top-down procedure where total costs are split up into different categories which are allocated to vehicle types by using different allocation factors. A second, not so widespread approach is to use game theory for allocating joint costs to vehicle types or user groups (club approach), mostly combined with a top-down allocation procedure for those cost elements which are considered as attributable costs. A third category are incremental cost and avoidable cost studies which attempt to identify the additional costs (incremental cost approach) or the avoidable costs (avoidable cost approach) which occur when adding
10 Exceptions are Haraldsson 2006b and 2007 where MC figures for two types of vehicles are provided.
11 However, not all of the fully allocated cost studies explicitly distinguish between fixed and variable cost
elements. There are several studies which use different categorisation approaches and apply allocation factors to apportion these categories to vehicle types. Naturally, the methods and factors used in such studies are more difficult to evaluate under the aspect whether they can be used to disaggregate “average” marginal costs.
(subtracting) a group of users or a class of vehicles. These approaches can be interpreted as a discrete approaching of marginal costs, even though these studies aim at full cost recovery.
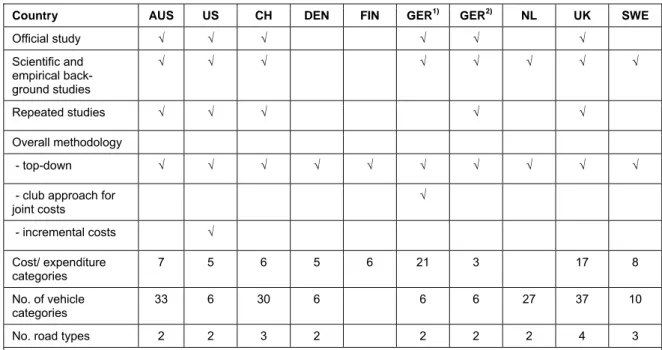
Table 3: Characteristics of road cost allocation studies
Country AUS US CH DEN FIN GER1) GER2) NL UK SWE
Official study √ √ √ √ √ √ Scientific and empirical back-ground studies √ √ √ √ √ √ √ √ Repeated studies √ √ √ √ √ Overall methodology - top-down √ √ √ √ √ √ √ √ √ √
- club approach for joint costs √ - incremental costs √ Cost/ expenditure categories 7 5 6 5 6 21 3 17 8 No. of vehicle categories 33 6 30 6 6 6 27 37 10
No. road types 2 2 3 2 2 2 2 4 3
1) Study conducted on behalf of the transport ministry to estimate the level of the German HGV charge. – 2) Studies conducted on agreed methodology as official studies of the transport ministry until 1991.
Sources: Denmark: COWI 1994. Finland: LT Consultants. Germany: DIW 2000, Rommerskirchen et al 2002. Sweden: Hansson 1996. Netherlands: DHV/Tebodin 1992, Vermeulen et al. 2004. Australia: National Transport Commission 2005. UK: DETR 1997, NERA 2000. Switzerland: BFS 2003.
The review of FAC studies covers 9 countries (see table 3 for a summary of their main characteristics). In five countries (Australia, Germany, Switzerland, the UK and the US) these studies have an official character, e.g. form the basic document in the area of track cost allocation of the government. These official studies are conducted in a specified frequency, for example annually in Switzerland and the UK, or are repeated exercises, though not with a predefined frequency (Germany, the US and Australia), and there are frequent background studies aimed at improving the methodology and/ore the database used. The majority of studies analysed here are typical top-down studies. Exceptions are the FHA study in the United States which follows an incremental cost approach for the cost category construction of new bridges (apart from applying a top-down approach for other cost elements), and the German Maut study (Rommerskirchen et al. 2002) which uses a club approach for the allocation of joint costs.
The approaches to split up total costs into different sub-categories vary considerably between the available studies. Criteria used to categories costs are
CATRIN - Deliverable D 1 – January 2008 22 - the type of road work (operating costs, maintenance costs, reconstruction and renewal
costs, new investments),
- the time horizon of measures (capitalised costs versus non-capitalised running costs, fixed
versus variable costs), and
- the type of assets (for example maintenance expenditures split up into those for pavement,
for bridges etc.).
Often, more than one of these criteria is used (see table 4) and the number of sub-categories varies between the studies (see table 3: 3 categories in the German studies until 1991, 17 categories in the UK, 21 categories in the German Maut study). Another observation is that the number of vehicle categories used for the allocation procedure shows a great variance, ranging from 6 categories (usually passenger cars, light goods vehicles, Buses, and a few categories of HGV such as rigids with/without trailer, artics) up to 27 (NL), 30 (Switzerland), 33 (Australia) and 37 (UK) vehicle types.
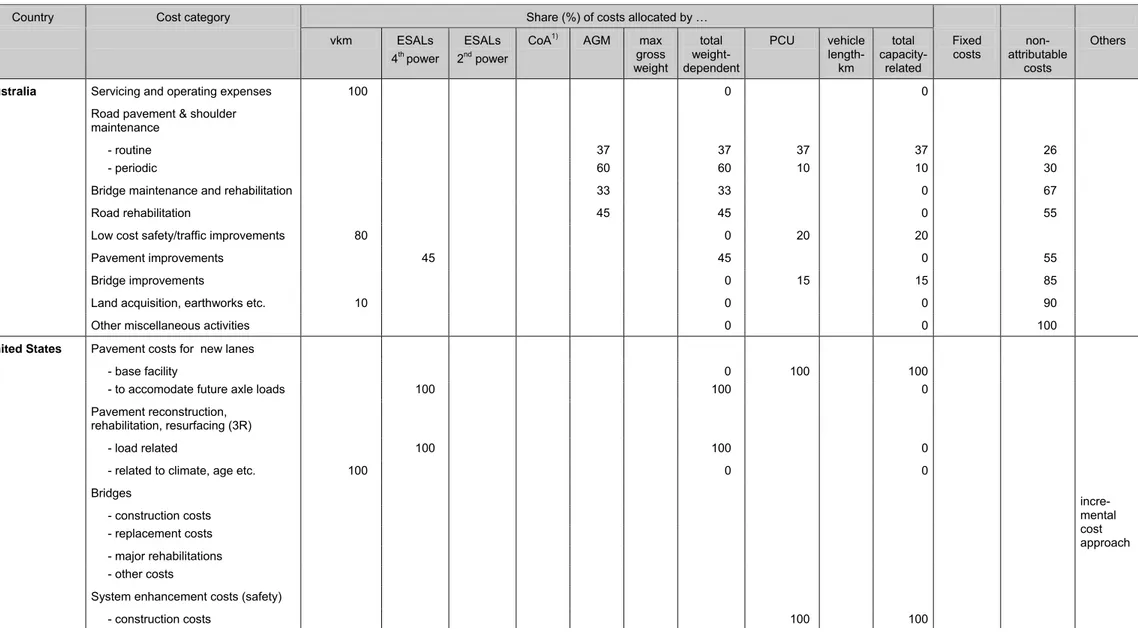
Table 4: Allocation procedures in fully allocated road cost studies
Country Cost category Share (%) of costs allocated by …
vkm ESALs
4th power
ESALs 2nd power
CoA1) AGM max
gross weight total weight-dependent PCU vehicle length-km total capacity-related Fixed costs non-attributable costs Others
Australia Servicing and operating expenses 100 0 0
Road pavement & shoulder maintenance
- routine 37 37 37 37 26
- periodic 60 60 10 10 30
Bridge maintenance and rehabilitation 33 33 0 67
Road rehabilitation 45 45 0 55
Low cost safety/traffic improvements 80 0 20 20
Pavement improvements 45 45 0 55
Bridge improvements 0 15 15 85
Land acquisition, earthworks etc. 10 0 0 90
Other miscellaneous activities 0 0 100
United States Pavement costs for new lanes
- base facility 0 100 100
- to accomodate future axle loads 100 100 0
Pavement reconstruction,
rehabilitation, resurfacing (3R)
- load related 100 100 0
- related to climate, age etc. 100 0 0
Bridges - construction costs - replacement costs - major rehabilitations incre-mental cost approach - other costs
System enhancement costs (safety)
CATRIN - Deliverable D 1 – January 2008 24
Country Cost category Share (%) of costs allocated by …
CoA1)
vkm ESALs ESALs AGM max total PCU vehicle total Fixed non- Others
4th power 2nd power gross
weight weight-dependent length-km capacity-related costs attributable costs - other costs 100
Other attributable costs2) 100 0 0
Switzerland Operating costs I (administration,
signalling, traffic management) 100 0 0
Operating costs II (operational
maintenance) 100 0 0
Capacity costs (costs with no relation to road use, fixed costs)
0 100 100
Weight-dependent costs I (45% of constructional maintenance costs caused by HGV)
100 100 0
Weight-dependent costs II (investment costs caused by HGV)
100 100 0
Interests on annual surplus/deficit 0 0
Denmark3) Investment 45 (80) 0 15 (5) 15 (5)
Reconstruction 25 (10) 45 (40) 45 (40) 0 30(50)
Winter maintenance 30 (30) 0 20 (20) 20 (20) 50 (50)
Other maintenance 20 (20) 0 10 (10) 10 (10) 70 (70)
Administration 30 (20) 0 0 70 (80)
Finland Winter maintenance 5 0 0 95
Maintenance of paved roads 50 25 25 0 25
Maintenance of light-paved roads 25 50 50 0 25
Maintenance of gravel roads 25 35 35 0 40
Traffic guidance & information 30 0 0 70
Landscaping and sanitation 0 0 100
Bridges 25 25 25 0 50
Ferries 20 5 5 0 75
Germany5) capacity costs 0 100 100
Country Cost category Share (%) of costs allocated by … CoA1)
vkm ESALs ESALs AGM max total PCU vehicle total Fixed non- Others
4th power 2nd power gross
weight weight-dependent length-km capacity-related costs attributable costs pavement maintenance 100 100 0 pavement renewals 100 100 0
Germany 6) Land costs 0 100 100
tracking/drainage 0 100 100
base layer – new construction 73*) 0 27 27
base layer – maintenance 100 100 0
Binding layers – new construction 100*) 0 0
Binding layers – maintenance 100 100 0
overlays – new construction 0 100 100
overlays – maintenance 100 100 0
tunnels – new construction 45+55) 0 50 50
tunnels – maintenance 80 + 205) 0 0
bridges 155) 0 85 85
equipment 33 0 67 67
nodes, branches – new construction 15+206)+155) 0 50 50
nodes, branches – maintenance 15+105) 35 35 40 40
other engineering work 33 0 67 67
administration, police 30 0 70 70
operational maintenance 35+155) 0 50 50
Netherlands Construction costs – fixed part (89%) 0 0
Motorways and provincial roads 0 307), 708) 307), 708)
Municipal roads 0 1007) 1007)
Construction costs – variable part
(11%) 100 100 0
Maintenance costs – fixed part (70%) 0
Motorways and provincial roads 0 307), 708) 307), 708)
CATRIN - Deliverable D 1 – January 2008 26
Country Cost category Share (%) of costs allocated by …
CoA1)
vkm ESALs ESALs AGM max total PCU vehicle total Fixed non- Others
4th power 2nd power gross
weight weight-dependent length-km capacity-related costs attributable costs Maintenance costs – variable part
(30%) 98 2 100
Costs of land use 0 0
Motorways and provincial roads 0 307), 708) 307), 708)
Municipal roads 0 1007) 1007)
Operation costs 100 0 0
United Kingdom Capital expenditure 15 15 85 85
Maintenance expenditures 0 0
Long life pavements 100 100 0
Resurfacing 100 100 0
Overlay 100 100 0
Surface dressing 20 80 80 0
Patching and minor repairs 80 20 100 0
Drainage 100 0 0
Bridges and remedial earthwork 100 100 0
Grass and hedge cutting 100 0 0
Sweeping and cleaning 50 0 0 509)
Traffic signs and pedestrian
crossings 100 0 0
Road marking 10 90 90 0
Footways, cycle tracks and kerbs 50 50 0 509)
Fences and barriers 33 67 67 0
Winter maintenance & miscellaneous 100 0 0
Street lighting 50 0 0 509)
Police and traffic warden 100 0 0
Sweden Investments – federal roads 21 21 79 79
Country Cost category Share (%) of costs allocated by …
vkm ESALs
4th power
ESALs 2nd power
CoA1) AGM max
gross weight total weight-dependent PCU vehicle length-km total capacity-related Fixed
costs attributable non-costs
Others
investments – private roads 8 8 92 92
Increase in bearing capacity 100 100 0
Maintenance/operation federal roads: 0
Winter road maintenance 5 0 0 95
Paving maintenance 75 0 0 25
Bridges 20 0 0 80
Ferries & bridge operation 5 0 0 95
Gravel road maintenance 35 0 0 65
Driving supervision, etc. 0 0 100
Traffic security 10 0 0 90 Improvement measures 25 0 0 75 maintenance/operation municipal roads: 0 paving maintenance 40 0 0 60 winter maintenance 5 0 0 95 bridges 20 0 0 80 other 0 0 100
maintenance/operation private roads 6 0 0 94
Coefficient agressivite: This coefficient is calculated for each vehicle type based on the empty weight, the average load and a weigh-in-motion factor. 2) Grading, drainage, pavement width,
ridesharing programs and facilities, weigh stations. – 3) Figures for motorways and trunk roads. Figures for principal and communal roads are given in brackets. - 4) % of vehicle category in total
costs used to allocated this cost category. – 5) Studies conducted on agreed methodology as official studies of the transport ministry until 1991. 6) Study conducted on behalf of the transport
ministry to estimate the level of the German HGV charge. – 7) PCUs at 60 km/h. – 8) PCUs at 100 km/h. – 9) Only allocated to HGV>=12t max GVW.- 10) only allocated to passenger cars &
others. – 11) Allocated to pedestrians, except motorways.
Sources: Denmark: COWI 1994. Finland: LT Consultants. Germany: DIW 2000, Rommerskirchen et al 2002. Sweden: Hansson 1996. Netherlands: DHV/Tebodin 1992, Vermeulen et al. 2004. Australia: National Transport Commission 2005. UK: DETR 1997, NERA 2000. Switzerland: BFS 2003.
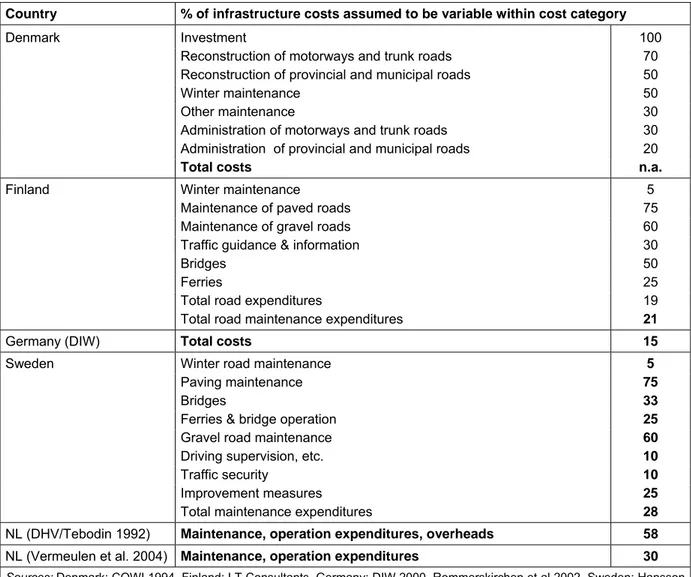
2.2.1 Indications on cost variability and weight-dependent costs
As mentioned before, an important information from FAC studies is the share of variable costs and weight-dependent costs. Table 5 and table 6 show figures from those studies which explicitly distinguish between fixed and variable elements of infrastructure cost (Denmark, Finland, Germany, Sweden, Netherlands) and from those which identify the share of weight-dependent costs respectively (Australia, the UK, Switzerland). This second group of studies is of particular interest for allocating costs to different weight classes of vehicles. Apart from this, they also provide some indication on cost variability because we can consider the share of costs allocated by weight dependent factors as a lower bound of cost variability.
Table 5: Indications on variable infrastructure costs in road cost accounting studies
Country % of infrastructure costs assumed to be variable within cost category
Denmark Investment 100
Reconstruction of motorways and trunk roads 70
Reconstruction of provincial and municipal roads 50
Winter maintenance 50
Other maintenance 30
Administration of motorways and trunk roads 30
Administration of provincial and municipal roads 20
Total costs n.a.
Finland Winter maintenance 5
Maintenance of paved roads 75
Maintenance of gravel roads 60
Traffic guidance & information 30
Bridges 50
Ferries 25
Total road expenditures 19
Total road maintenance expenditures 21
Germany (DIW) Total costs 15
Sweden Winter road maintenance 5
Paving maintenance 75
Bridges 33
Ferries & bridge operation 25
Gravel road maintenance 60
Driving supervision, etc. 10
Traffic security 10
Improvement measures 25
Total maintenance expenditures 28
NL (DHV/Tebodin 1992) Maintenance, operation expenditures, overheads 58
NL (Vermeulen et al. 2004) Maintenance, operation expenditures 30
Sources: Denmark: COWI 1994. Finland: LT Consultants. Germany: DIW 2000, Rommerskirchen et al 2002. Sweden: Hansson 1996. Netherlands: DHV/Tebodin 1992, Vermeulen et al. 2004.
Naturally, different definitions of maintenance, rehabilitation and reconstruction, different classification criteria for cost components (type of road work, time horizon, purpose of expenditures) and a varying degree of differentiating these categories further hamper a
CATRIN - Deliverable D 1 – January 2008 30
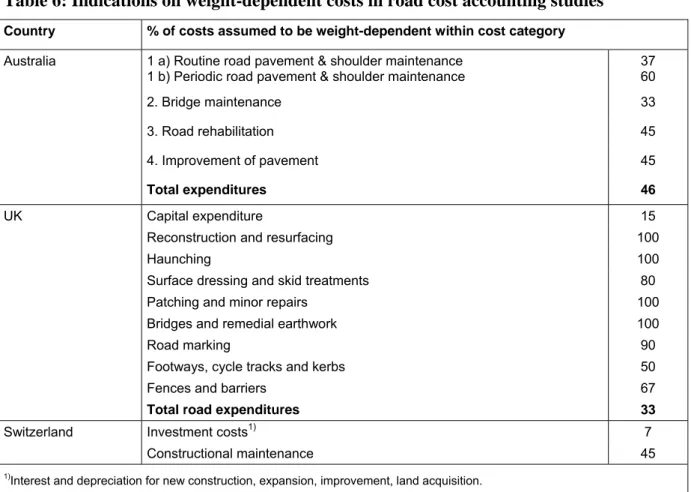
comparison and generalisation of the figures shown in table 5 and table 6. Nevertheless, it can be concluded that between 21% and 30% of infrastructure costs are variable12. Weight-dependent costs make up between 33% and 46%13.
Table 6: Indications on weight-dependent costs in road cost accounting studies
Country % of costs assumed to be weight-dependent within cost category
Australia 1 a) Routine road pavement & shoulder maintenance 1 b) Periodic road pavement & shoulder maintenance
37 60 2. Bridge maintenance 33 3. Road rehabilitation 45 4. Improvement of pavement 45 Total expenditures 46 UK Capital expenditure 15
Reconstruction and resurfacing 100
Haunching 100
Surface dressing and skid treatments 80
Patching and minor repairs 100
Bridges and remedial earthwork 100
Road marking 90
Footways, cycle tracks and kerbs 50
Fences and barriers 67
Total road expenditures 33
Switzerland Investment costs1) 7
Constructional maintenance 45
1)Interest and depreciation for new construction, expansion, improvement, land acquisition.
Sources: Australia: National Transport Commission 2005. UK: DETR 1997, NERA 2000. Switzerland: BFS 2003.
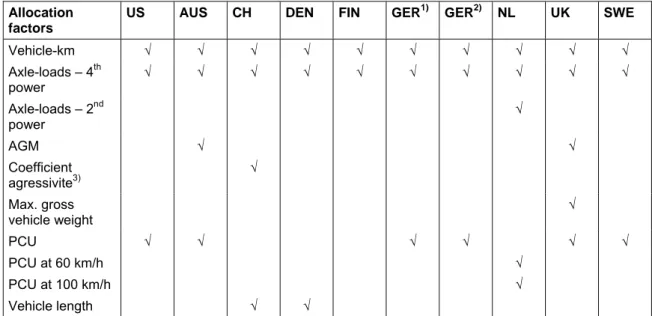
2.2.2 Allocation procedures and allocation factors used
Table 7 shows the variety of allocation factors applied in the studies reviewed. Three different groups of factors are used:
- First, vkm which distribute costs proportionally to the use of roads by each vehicle type.
They are mostly used for those cost components which are considered to vary with road use, but for which differences in cost causation (damages) between vehicle types are not apparent. Examples are service and operation expenditures, costs of traffic management schemes, police, road lighting, traffic signs etc. but also parts of winter maintenance and
12 Outliers seem to be an earlier Dutch study which derived a share of 58%, and an earlier German study which,
climate related pavement costs (see table 4). In some studies vkm are also used to allocated fixed costs.
- Second, weight dependent factors such as axle-load km, mostly applied according to the
AASH(T)O road test figures as fourth-power rule, in some studies also as second power rule for some cost categories, and other weight-related measures such as maximum and average gross vehicle weight. Cost categories which are considered to be weight dependent are (parts of) pavement maintenance & reconstruction, bridge maintenance & reconstruction and, in some studies, those parts of the construction costs for bridges and pavements which occur to accommodate higher axle-loads (Vermeulen et al. 2000).
- Third, capacity related allocation factors such as PCUs (again in various forms, see for
example in Vermeulen et al. 2000) and equivalence factors related to the length of vehicles. Capacity related factors (PCUs) are usually applied to distribute fixed costs, the costs of earthwork and drainage and land costs, and - in some studies - to allocate the costs of base facilities. They are also applied to allocate different proportions of maintenance and reconstruction costs.
Table 7: Allocation factors used in fully allocated road cost studies
Allocation factors
US AUS CH DEN FIN GER1) GER2) NL UK SWE
Vehicle-km √ √ √ √ √ √ √ √ √ √ Axle-loads – 4th power √ √ √ √ √ √ √ √ √ √ Axle-loads – 2nd power √ AGM √ √ Coefficient agressivite3) √ Max. gross vehicle weight √ PCU √ √ √ √ √ √ PCU at 60 km/h √ PCU at 100 km/h √ Vehicle length √ √
1) Study conducted on behalf of the transport ministry to estimate the level of the German HGV charge. – 2) Studies conducted on agreed methodology as official studies of the transport ministry until 1991. 3) This coefficient is calculated for each vehicle type based on the empty weight, the average load and a weigh-in-motion factor.
Sources: Denmark: COWI 1994. Finland: LT Consultants. Germany: DIW 2000, Rommerskirchen et al 2002. Sweden: Hansson 1996. Netherlands: DHV/Tebodin 1992, Vermeulen et al. 2004. Australia: National Transport Commission 2005. UK: DETR 1997, NERA 2000. Switzerland: BFS 2003.
13
Note, that these shares strongly depend on the type of road (see the variance of the UK figures from 26% up to 42%). Furthermore, the Australian figure relates to maintenance expenditures only, e.g. would be lower if total
CATRIN - Deliverable D 1 – January 2008 32
In the following we will discuss the two most important allocation factors, the AASH(T)O factors and the PCUs, in more detail. The application of the AASH(T)O factors to allocate weight-dependent costs is straightforward. The factor is obtained by summing up the fourth power of the ratio between effective axle load and the 10t standard axle load for each axle of a given vehicle. Despite of this clear calculation rule there exist country-specific differences in the factor values. These differences arise from the different disaggregation of mileage data by vehicle weight classes and the measurements of vehicle loadings as well as from the distribution of total weight to the axles. Furthermore, the fact that axle configurations such as tandem or triple axles cause higher road damages than single axles is reflected in national allocation practices in different ways. For example, the German Maut study (Rommerskirchen et al. 2002) assumes for tandem and triple axles other standard weights (18.35t and 24t respectively) than for single axles. The Swiss and the Dutch allocation procedures consider axle configurations while the UK procedure treats each axle as a single axle.
As mentioned above, the AASH(T)O road test factors have been subject of controversial discussions since their appearance, and simulation exercises and other engineering research has deemed to verify or revise the figures. This is reflected in some countries’ cost allocation practice by applying other powers than the fourth power. One example is the Dutch study (Vermeulen et al. 2004) where for a part of maintenance costs the second power instead of the fourth power is applied. Another example is Switzerland which for a long time has used the 2.5th power (BFS 1985). In BFS 2003 a revision of the Swiss road cost allocation was suggested based on a background study of the University of Lausanne (LAVOC 2000) which analysed the feasibility of applying the former axle-load factors. With this revision, the weight-dependent part of constructive maintenance is allocated by using a so-called Coefficient agressivite (CoA, instead of the former exponential axle-load factors) which is calculated for each vehicle type based on the empty weight, the average load and a weigh-in-motion factor. The weight-dependent investment costs are distributed by a revised proportional axle-load factor.
In contrast to the AASH(T)O factors, PCU figures vary between countries not only to different disaggregations of vehicle mileage data in transport statistics but also due to differences in the underlying concepts. It appears that for the PCU figures, a category which originates from road engineering disciplines such as traffic and road capacity planning, any commonly agreed and applied method does not exist. Depending on the underlying concept,
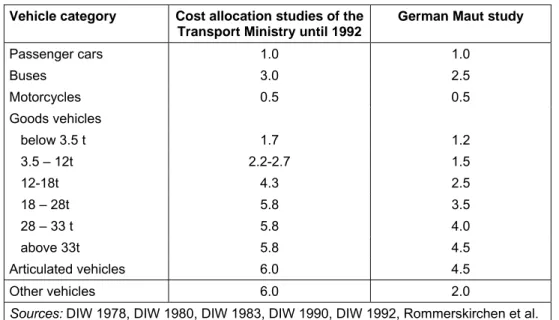
PCUs are based on average speed, traffic density, average distance between vehicles within the traffic flow, safety distances and delays. The impact of heavier vehicles on taffic flow is considered by vehicle characteristics such as length and the ratio between weight and engine power on the one hand, and the existence and length of gradients, the share of trucks in the traffic flow, the number of lanes and traffic density on the other hand (see Al-Kaisy et al. 2002, Rodriguez and Benekohal 2004). For example, the PCU figures used in the German cost allocation studies until 1992 (table 8) were based on the assumption that differences in road occupancy between vehicle types are solely caused by different speeds and not by space or length requirements. The PCU factors were derived in the late 60es within studies on the different speeds of vehicle classes at gradient sections. The German Maut study (Rommerskirchen et al. 2002) has revised these figures and obtained lower values for heavier vehicles. Their figures appear to follow the concept of dynamic space requirements of different vehicle types as suggested in Switzerland, however, there seems to be no underlying study and/or a comprehensive empirical database.
Table 8: PCU figures used in Germany
Vehicle category Cost allocation studies of the
Transport Ministry until 1992
German Maut study
Passenger cars 1.0 1.0 Buses 3.0 2.5 Motorcycles 0.5 0.5 Goods vehicles below 3.5 t 1.7 1.2 3.5 – 12t 2.2-2.7 1.5 12-18t 4.3 2.5 18 – 28t 5.8 3.5 28 – 33 t 5.8 4.0 above 33t 5.8 4.5 Articulated vehicles 6.0 4.5 Other vehicles 6.0 2.0
Sources: DIW 1978, DIW 1980, DIW 1983, DIW 1990, DIW 1992, Rommerskirchen et al.
2002.
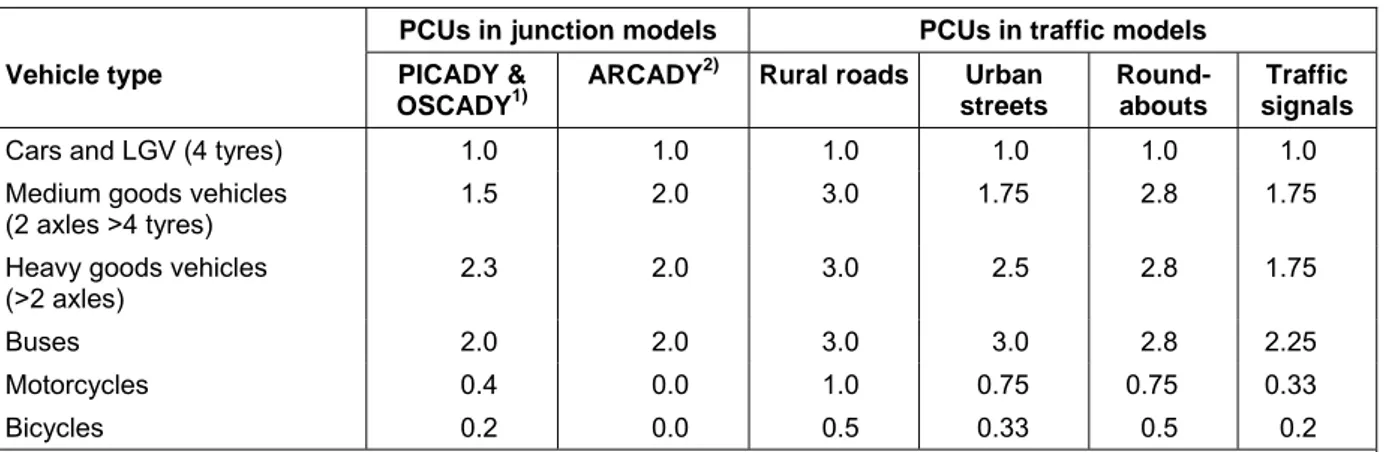
In the UK, PCU figures were derived with two modelling approaches:
- Junction modelling (3 types: give-way junctions, traffic signals, roundabouts) where the
impact of various vehicle types on the saturation flows of different junction types is assessed (table 9).
CATRIN - Deliverable D 1 – January 2008 34 - Transportation modelling where PCUs are used to add up vehicle matrices of different
vehicle types to estimate their combined impact on speeds and journey times14 (see table 9, last 4 columns).
NERA 2000 suggests to explore an alternative, more sophisticated approach to determine and use PCU values in road cost allocation. This approach would use speed-flow curves to estimate the impact of traffic level and traffic composition on speeds whereby it is assumed that the presence of heavy goods vehicles affects the maximum road capacity of rural and suburban roads only. The approach implies that the effects of HGVs are only significant at or around the flow conditions in which queuing is expected to occur.
Table 9: PCU figures used in different junction models and in traffic models in the UK
PCUs in junction models PCUs in traffic models
Vehicle type PICADY &
OSCADY1)
ARCADY2) Rural roads Urban
streets
Round-abouts
Traffic signals
Cars and LGV (4 tyres) 1.0 1.0 1.0 1.0 1.0 1.0
Medium goods vehicles (2 axles >4 tyres)
1.5 2.0 3.0 1.75 2.8 1.75
Heavy goods vehicles (>2 axles)
2.3 2.0 3.0 2.5 2.8 1.75
Buses 2.0 2.0 3.0 3.0 2.8 2.25
Motorcycles 0.4 0.0 1.0 0.75 0.75 0.33
Bicycles 0.2 0.0 0.5 0.33 0.5 0.2
1) PICADY: model for give-way junctions, OSCADY: model for junctions with traffic signals. 2) ACADY: model for
roundabouts.
Sources: For the junction models TRL, for the PCU figures in traffic models: Research on Road Traffic, table 6.1, chapter 6, HMSO 1965.
In a Danish cost allocation study (COWI 1994) applies space-dependent PCU figures whereby lorries have a factor of 2, buses a factor of 3 and articulated vehicles a factor of 4. In the Netherlands, two types of speed dependent PCU values are used for cost allocation. 30% of fixed maintenance costs as well as construction and land use costs for highways, motorways and provincial roads are allocated by PCU figures which consider a safety distance of 30 km between vehicles which is required at an overall speed of 60 km per hour. 70% of variable maintenance costs are distributed by PCU values which are based on a safety distance of 50 m required at 100 km per hour15 (see Vermeulen et al. 2004).
14 This, however, implies the availability of PCU figures from other sources.
15 For municipal roads 100% of these cost categories are allocated by PCU figures which consider a speed of 60
Table 10: PCU figures used in the Dutch allocation method
Vehicle type PCU at 60 km/h PCU at 100 km/h
Passenger car 1 1
Delivery van 1 1
Bus 1.2 1.1
Solo truck 1.2 1.1
Truck with trailer 1.4 1.2
Source: Vermeulen et al. 2004.
The available PCU figures for Sweden stem from older sources and it is not clear whether they are solely based on speed or also on space or length requirements. Table 11 gives PCU figures taken from a work on road capacity at the end of the 50es, and those adopted by the Swedish Commission for Vehicle Taxation in 1965. Hansson 1996, which includes apart from a marginal cost estimation also a fully allocated cost study seems to use the UK PCU figures.
Table 11: PCU figures used in Sweden
Vehicle type Nordquist 1958 Commission on Vehicle Taxation 1965 Passenger cars 1 1
Light goods vehicles (below 3t) 1 1
Bus 2.5 *)
Goods vehicles above 3t
3-12t 2.5 2.0 above 12t 3.0 Vehicle combinations 3.5 Trailers below 3t 0.5 3t-12t 1 above 12t 2.0
*) Buses are included in the respective weight classes of trucks and trailers.
Sources: Nordqvist 1958, Swedish Commission on Vehicle Taxation.
2.3 Open issues arising from the review of studies
Research on estimating the marginal costs of operating, maintaining and renewing roads has made remarkable progress in understanding marginal costs in different modes over the recent years. The body of available studies allows to draw conclusions on the degree of cost variability for cost categories such as renewals, maintenance and operation (see Link et al. 2007). Furthermore, at the current frontier of research cost elasticity figures can be used for pricing policies. Here the studies provide evidence that the mean value of the cost elasticity is
CATRIN - Deliverable D 1 – January 2008 36
generally below 1, whereby the values increase with the time horizon of the road measure (operation, maintenance, renewal).
Outstanding issues to be solved relate to three subjects. First, MC studies need to be further developed in order to provide marginal cost estimates per vehicle types and weight classes. Currently, results are either too aggregated (econometric studies) or too disaggregated (engineering-based approach). Second, more evidence on the shape of the MC curve (decreasing versus increasing) is needed. Apart from this, there is no sufficient evidence to draw general conclusions on MC estimates for different types of roads. Third, a further important issue relates to the allocation factors used in FAC studies such as the AASH(T)TO factors and PCU values. Given the widespread use of the AASH(T)O factors it were desirable to generate new empirical evidence on the validity of the 4th power rule and the impact which the development of vehicles and road designs might have. Similarly, more evidence on the PCU figures is important since the allocation of fixed costs remains a problem for pricing policy, for example in the discussion of HGV charge calculations by member states.