RESPONSE TO A SOCIAL DILEMMA – AN ANALYSIS OF THE CHOICE
BETWEEN AN ECONOMIC AND AN ENVIRONMENTAL OPTIMUM IN A
POLICY MAKING CONTEXT
Lena Nerhagen, Roger Pyddoke and Johanna Jussila Hammes
VTICTS Working Paper 2014:8
Abstract
Many countries have begun to require benefit-cost analysis as a way of informing key regulatory decisions. However, its actual use seem to be limited, especially in the area of environmental, health, and safety regulation. Reasons for this seem to be lack of knowledge and experience among decision makers and that established quality objectives prevent the use of this type of analysis and deliberation.
We present the results from an experiment designed to investigate choice behavior in a public sector context. Students with different academic majors were asked to act as decision makers. There were two choice situations: one in a municipality deciding on an action plan and one in a government agency having to propose a national limit value. In both settings, the outcome that would pass a benefit-cost test would not achieve a natural state of the environment, hence a social dilemma choice situation.
We find that a majority of the respondents prefer outcomes that can be considered
environmental “optimum” but that there is a difference depending on academic major. The choice context also influences the response behavior and so does the information about an international standard. The latter increases the likelihood to accept alternatives that imply higher costs.
Keywords: benefit-cost analysis, policy making, environmental quality objectives,
discrete-choice analysis, willingness-to-pay
Centre for Transport Studies SE-100 44 Stockholm
Sweden
1 RESPONSE TO A SOCIAL DILEMMA – AN ANALYSIS OF THE CHOICE BETWEEN AN ECONOMIC AND AN ENVIRONMENTAL OPTIMUM IN A POLICY MAKING CONTEXT 1
by
Lena Nerhagen, Roger Pyddoke and Johanna Jussila Hammes VTI, Swedish National Road and Transport Research Institute2
5 April 2014
Abstract
Many countries have begun to require benefit-cost analysis as a way of informing key regulatory decisions. However, its actual use seem to be limited, especially in the area of environmental, health, and safety regulation. Reasons for this seem to be lack of knowledge and experience among decision makers and that established quality objectives prevent the use of this type of analysis and deliberation.
We present the results from an experiment designed to investigate choice behavior in a public sector context. Students with different academic majors were asked to act as decision makers. There were two choice situations: one in a municipality deciding on an action plan and one in a government agency having to propose a national limit value. In both settings, the outcome that would pass a benefit-cost test would not achieve a natural state of the environment, hence a social dilemma choice situation.
We find that a majority of the respondents prefer outcomes that can be considered environmental “optimum” but that there is a difference depending on academic major. The choice context also influences the response behavior and so does the information about an international standard. The latter increases the likelihood to accept
alternatives that imply higher costs.
Key words: benefit-cost analysis, policy making, environmental quality objectives, discrete-choice analysis,
willingness-to-pay
1 This research was funded by VINNOVA. Helpful comments on the paper and the design of the experiment from Gunnar Isacsson, Henrik Andersson, Lisa Hansson, Maria Vredin Johansson, and Jan-Erik Svärdh are gratefully acknowledged.
2
Introduction
The performance and management of organizations, including bureaucracies, is an active field of research where principal-agent theory is an oft-used approach (Aghion and Tirole, 1997; Miller and Whitford, 2007). Case study-based approaches have been used to investigate the driving forces behind the behavior and the outcome of different types of management or governance systems (Zhan, Lo and Tang, 2013; Loyens and Maesschalck, 2010; May and Winter, 2009). In this research, one question raised is how politicians can control the outcome of decision making in bureaucracies (Shapiro and Guston, 2007; Lipsky, 1980; Hupe and Hill, 2007; Miller and Whitford, 2007). Economists argue that benefit-cost analysis provides important information to guide and evaluate policy making (Sunstein, 2000). In the US, benefit-cost analysis is mandated by the government in conjunction with many federal regulations. Impact assessment, where benefit-cost analysis is a component, is also part of the “Better Regulation Action Plan” adopted by the European Commission (COM(2002) 278 final),3 and member states have been encouraged to adopt benefit-cost analyses in their own regulatory decision making processes.4 Still, its actual use seems to be limited, especially in the area of environmental, health, and safety regulation, (Hahn, 2000; Radaelli, 2005; Hahn and Dudley, 2007; Farrow and Shapiro, 2009).
Few studies have explored the reasons for the reluctance to apply benefit-cost analysis in policy making, or how this type of information, in relation to other types of information such as
environmental objectives, may influence the decisions made. This paper provides some insights into this issue. We present results from an experiment were we explore decision making in a policy making context. We study how individual decision makers behave when facing a situation where the outcome that is economically efficient does not result in a state of the environment that is considered to be natural and/or achieves established goals, hence a social dilemma. The design of the experiment is inspired by the findings of Tenbrunsel et al. (2000) and Ordóñes et al. (2009). They show that
environmental standards5 or narrow goals may lead to the neglect of further dimensions, aspects that a benefit-cost assessment is expected to provide information about. We believe that this is a question of high relevance for environmental policy since, for example, the EU’s framework directives for water and air are based on environmental quality objectives to guide decision making while the EU at the
3 See http://ec.europa.eu/governance/impact/background/background_en.htm
4Part of the strategy was a project undertaken by the European Commission together with OECD which involved 15 member countries. Individual reviews of the capacities for effective regulatory management were done for each country. The report for Sweden was published by the OECD in 2010 (see
http://www.oecd.org/gov/regulatory-policy/betterregulationineuropesweden.htm). The basis for this work is the
OECD’s Regulatory Reform Programme, which started in 1997. OECD regularly reviews countries’ work with regulatory reform in general and for specific areas such as environmental policy. Examples for Sweden are OECD (2004) and OECD (2007) and a new review of environmental policy in Sweden is underway, see http://www.regeringen.se/sb/d/17039.
3 same time encourages the use of impact assessment including benefit-cost analysis (De Francesco, Radaelli and Troeger, 2011).
The design of the experiment is also influenced by the research on non-market valuation using stated choice experiments (Carson and Hanemann, 2005; Siikamäki and Layton, 2007; Marley and Pihlens, 2012; Vossler et al., 2012; Lancsar et al., 2013; Andersen et al, 2013). Our design is similar to a payment card format in the contingent valuation literature. However, in addition to information about different bids, we provide the respondents with information about environmental aspects related to each bid and ask them to choose the preferred alternative. We also describe the uncertainties relating to environmental quality and to the economic benefits of each alternative. Since other studies have highlighted the influence of academic background on the assessment of economic information (Hahn, 2000; Hedelin and Lindh, 2008), we chose to study how students with different academic backgrounds behave. Since it can be expected that newly graduated individuals could bring in new knowledge to agencies and administrations, it is of interest to study how they use different types of information when making the kind of decisions they may encounter in their professional life.
The context we use in the experiment is whether or not to restore lakes to their “natural state,” a topical political issue in Sweden because of the implementation of EU’s Water Framework Directive (WFD). The overall objective of the directive is to achieve a good status of all waters. This is to be achieved by a combined approach using emission limits and quality standards.6 Sweden, however, is a country with almost 100,000 lakes and 22,000 so-called water bodies of which about 10% are being monitored. The quality is influenced by both the natural environment and the activities that in many places have taken place for over 1,000 years. It is therefore difficult to make credible assessments of current status and to define a natural state (Futter et al., 2011; Lindegarth et al., 2013). According to a recent assessment, nearly half of the waters in Sweden will not reach “good status” before 2015.7 Hence, monitoring and achieving a natural state in all Swedish lakes is likely to impose large costs on society.
To our knowledge, this is the first study to explore how individuals behave as policy makers in a situation where they receive both environmental and benefit-cost information.8 The results of the experiment support the main hypothesis of environmental quality driving the results, but we also find that students in economics are somewhat less likely to accept environmental improvements that imply high costs. Moreover, we find that the context influences the decision making. Marginal abatement
6 http://ec.europa.eu/environment/water/water-framework/info/intro_en.htm
7 (http://www.cirkulation.com/2013/02/sverige-klarar-inte-vattendirektivet/
8 There are other examples of studies that use discrete choice experiments to study decision making in similar contexts: Mirelman et al. (2012), who study policymakers’ decision making criteria in health, and Pouta et al. (2002), who use a WTP experiment to study how the planning context regarding a nature conservation program – the European Union’s Natura 2000 Network - influences people’s decision making processes.
4 cost and an environmental improvement do not have the same impact on the response behavior in the two questions. Information about an internationally recommended environmental standard also seems to influence the choices made.
The outline of the paper is as follows. The next section gives a brief overview of the literature on control and management of governance systems and what is said about the role of benefit-cost analysis. Based on this, we present our expectations about how different kinds of information will influence the respondents’ choice behavior in the experiment. We then describe the experiment design in greater detail and how it was influenced by theory and context. This is followed by a presentation of the details of the sample and how the experiment was effectuated. In the second to last section, we analyze the data and present our results. The paper ends with a discussion and conclusions.
Environmental governance, management by objectives, and benefit-cost analysis
According to the OECD, decentralization has been a noticeable trend in public administrations worldwide over the past two decades (Mazur, 2011). One reason for this is the work undertaken on regulatory reform by OECD and the influence of New Public Management (NPM) (Christensen and Lagreid, 2007). NMP is characterized by disaggregation, competition, and incentivization (de Vries, 2010). Another characteristic of NPM is management by objectives.9 One reason for this could be the need to influence the behavior of individuals’ decision making in the public sector (Hupe and Hill, 2007; Miller and Whitford, 2007). Management by objectives is the kind of system that underlies the EU policy in the areas of air and water pollution10 as well as the Swedish environmental policy. One benefit of decentralizing environmental policy is the possibility for tailored and flexible
responses, which in turn can increase the possibility for public involvement, as discussed by Ostrom (2010). A possible problem, however, is that sub-national governments are likely to differ in their monitoring and enforcement of national policies, leading to differential treatments of businesses and individuals in different parts of a country or region (Mazur, 2011). To prevent such outcomes, national governments may use management by objectives where goal-setting is a crucial element (Edvardsson and Hansson, 2005). This, however, may lead to inefficiencies if the goals are not adapted to the
9 Using management by objectives in a political context is associated both with advantages and disadvantages. On the pro side are the following: Focusing on a smaller selection of objectives makes them more accessible, i.e., easier for individuals to account for. In the political sphere, objectives can be formulated in a vague fashion, making it easier to reach political compromises. In political negotiations, tailoring vague but ambitious-sounding objectives may appear as a low-cost alternative to attract voters. However, the same factors that make the design of new objectives attractive to politicians may also produce cons. The attractiveness of political objectives may lead to a plethora of goals that in practice will dilute the focus produced by a smaller set of goals. Vagueness at the political level may produce difficulties in implementing the goals as precise and efficient regulations at an administrative level. Ambitious goals at the political level inevitably lead to high costs or a loss of credibility for the political system if politicians back out.
10 While the EU provides the overall goals and framework in the directives, the tasks of implementation and adaptation are left to the national governments and agencies.
5 differing circumstances in the country According to Ordóñes et al. (2009), Edvardsson and Hansson (2005), and Hansson et al. (2013), the issue of how to set goals has received little attention. Recently, Proost and Van Dender (2012) concluded that there have been several cases where governments have put forward ambitious goals that were later relaxed. They also discuss the problem of air pollution in cities and argue that, given the varying local conditions that influence air pollution levels within the EU, there is a need for diversified and customized policy approaches instead of a reliance on uniform policies such as standards.
For economists, benefit-cost analysis is known as an analytical tool that can be used to evaluate the efficiency and welfare impacts of different policies (Sunstein, 2000; Hahn and Dudley, 2007; Hahn, 2010; Loomis, 2011; Robinson and Hammitt, 2011). However, in many countries and/or contexts, this tool is seldom used (Radaelli, 2005; Sunstein, 2005). Sweden provides an interesting case to study given its system of environmental quality objectives11 and since several studies have found that there is a lack of both ex ante and ex post impact assessment in the area of environmental policy and planning (Swedish EPA, 2004; Samakovlis and Vredin Johansson, 2005; Radaelli, 2005; Samakovlis and Vredin Johansson, 2007; Forslund et al., 2010; Pyddoke and Nerhagen; 2010; County
Administrative Board of Dalarna, 2011 and 2012; Lindberg and Nerhagen, 2013, Nerhagen and Hultkrantz, 2013). Recently, greater attention has been given to benefit-cost analysis in the environmental objectives system (Gov. Bill, 2009/10:155; SFS 2010:1111). The only policy areas where benefit-cost analysis is regularly used is in the planning process regarding transport investments (Nilsson et al., 2009) and in determining the price and subsidies for medicines (Hultkrantz, 2009). Our main hypothesis is that economic information will not determine the final alternative that the majority of the respondents choose in the experiment. The reason is that we expect that the influence from the current environmental policy is strong, making “preserving the environment” the social norm.12 The system with environmental objectives has been described as “Sweden’s largest
cooperative project” and formal education is used to equip the citizens “with knowledge and will to work for sustainable development and for the achievement of the environmental quality objectives” (Ministry of the Environment, 2013). We therefore expect the respondents to be socialized into taking
11 Sixteen environmental quality objectives lay the foundation for Swedish environmental policy (Gov. Bill 2000/01:130; Gov. Bill, 2004/05:150; Gov. Bill, 2009/10:155). In 1999, the Parliament adopted a number of environmental quality objectives to give clear structure to environmental action. This has led to what we now call the environmental objectives system. The specifications associated with the environmental quality objectives are intended to serve as criteria in assessing whether the objectives are being achieved and provide guidance for environmental efforts by all actors – government agencies, county administrative boards, municipalities, and others. For a brief description of the system, see http://www.regeringen.se/content/1/c6/20/84/91/0b7011e2.pdf 12 How the behavior of others and social norms influence the choice individuals make has been explored in various ways in the literature. Nyborg and Rege (2003) study the formation of social norms and create a model of how society contributes to the creation of social norms. Kocher, Martinsson, and Visser (2012) investigate how norm enforcement may depend on cultural differences.
6 the environmental objectives, and the state of the environment, into account in decision making. The Swedish EPA has a key role in this work and they influence both research and the formal academic education. Since it has been found that the Swedish EPA pursues ambitious policies and has a high willingness to pay (WTP) for environmental improvement (Pyddoke and Nerhagen, 2010; Vredin Johansson et al., 2011; Carlson et al., 2011), we expect that this also spills over to students, especially those obtaining an academic major in environmental sciences. Sweden also has EU framework directives for air and water implemented through laws. Hence the environmental limit values are legally binding, which is also likely to influence the decisions made.
Hahn (2000) suggests that formal education in economics is needed in order to increase the use of economic ideas on how to analyze and provide solutions to environmental problems. Thus, it could be expected that economics students will reveal a different kind of behavior than non-economists. In the Swedish context, however, several factors may work against this. First, there is the social norm as discussed above. Second, the Swedish economics curricula often do not cover environmental economic aspects such as knowledge about how to perform benefit-cost analysis. Finally, even in practice, this type of evaluation is seldom used. This in turn can be expected to reduce the information students receive about this type of analysis.
Creating a realistic social dilemma – theory and experimental design
We study how future civil servants take account of economic information in environmental decision making. The choice process is designed so that there is a conflict between economic efficiency and environmental objectives. Since some of our respondents were specialists in their field, and credibility is a prerequisite for trustworthy answers (Vossler et al., 2013), we created a scenario resembling one that civil servants are likely to encounter when implementing the EU Water Framework Directive.13 We created two policy contexts where the respondent had to decide whether or not to reduce the nutrient level in water bodies (see Appendix 1). In question one, the policy context was a decision to be made at the level of a municipality concerning a lake. In question two, the context was a national environmental agency, where the respondent was asked to determine the national nutrient limit applicable to at least 20,000 lakes. The basic information on environmental quality was that the current nutrient level of an average lake in Sweden is 16 nutrient units. In order to describe the environmental problem, we gave information about the relationship between two fish species, perch
13 Information on environmental quality and critical aspects in relation to water quality was obtained from the County Administrative Board in Dalarna. This agency has produced several reports on the problems related to the implementation of the WFD because of varying geographical and meteorological conditions; see e.g., Haglund et al. (2010) and Melin, Edman and Danielsson (2012).
7 and carp, which can be used to assess the water quality in a lake. 14 The relationship is an indicator for improvements of water quality in a lake because an increase in the amount of European perch relative to the other species improves both the fish catch and visibility in the water, which, in turn, is beneficial for bathing and other recreational values. A quota close to 0.5 implies a nutrient concentration close to what is considered a “natural state”. We also gave the information that nutrient concentrations in the interval from 5 to 10 are to be considered a “natural state.” Figure 1, which was shown to the respondents, depicts the relationship between nutrient level and quota.
Figure 1 The relationship between nutrition level and the quota between two fish species
In this type of decision there are different ways of reaching a lower nutrient level, and the lower the level the higher the cost of reaching it. Thus, in both questions we gave the respondents different reduction alternatives to choose from, with higher reductions implying higher marginal and total costs15. Furthermore, we provided information on the expected benefit in monetary terms. The benefit is composed of two parts: the value related to increased catch of fish, i.e., 80,000 SEK per unit reduction in nutrient concentration, and the recreational and biodiversity value. The latter is estimated to be between 40,000 and 80,000 SEK per unit reduction in nutrient concentration. Finally, a
subsample received information about an internationally recommended nutrient level (standard) equal to 8.
14 The quota becomes zero when the nutrient level reaches 20 since it is expected that the ecosystem will collapse.
15 This is true in all cases but one. In the municipality question we gave the respondents an “outlier” as illustrated in Figure 2. This is a possible outcome since reductions in the nutrition level can be achieved by reducing two different pollutants. Different technologies are used depending on which pollutant that is targeted and the technologies have different costs. We kept the outlier as an alternative in this more stylized example since we wanted to test if respondents gave notice to MAC alone or also to total cost.
0 0,1 0,2 0,3 0,4 0,5 0,6 5 6 7 8 9 10 11 12 13 14 15 16 17 18 19 20 Quota perch/carp
Nutrient level concentration
8 Each respondent answered two questions.16 Figure 2 illustrates the information provided to the
respondents in the question where they were asked to act as an environmental supervisor in a
municipality. The respondent was given the possibility to choose one of five alternative actions plans that would reduce the nutrient level in one lake. A sixth possible alternative is the current status, which implies a marginal abatement cost (MAC) equal to zero.17
In the graph, the MAC curve describes the marginal abatement cost presented to the respondents.18 MBF is the marginal benefit from increased catch of fish. The benefits both from fish catch and from recreation and biodiversity are given by MBFRL for the low estimate and by MBFRH for the high estimate. As shown in the graph, reducing the nutrient level to 12 or 11 are the alternatives that pass a benefit-cost test. The other three alternatives are within the range of what is considered to be a natural state but for them MAC is higher than the estimated benefit. The internationally recommended standard is in the mid-range of the nutrient levels that are considered to be a natural state.
Figure 2 Illustration of information provided in question about municipality
Figure 3 illustrates the information provided to the respondents for the question where they were asked to act in the role of a civil servant at a government agency. MAC in Figure 3 differs from that in
16 There were two versions of the questionnaire, where the questions were presented in different orders. 17 The basis for this curve is that there are different abatement measures that can be used and combined to clean up a lake, each with different costs and impacts, in the literature on climate change known as McKinsey cost curve. A certain choice of technology will imply a certain reduction. The respondent could choose from the alternatives NL=12, NL=11, NL=10, NL=8, and NL=6. The information on MAC was the average value for a move from a higher NL level to the next lower as described in the diagram.
0 50 100 150 200 250 300 16 15 14 13 12 11 10 9 8 7 6 5 M B F a nd M AC Nutritient level MAC MBF MBFRL MBFRH Natural state Standard
9 Figure 2, while MBF, MBRFL and MBFRH are the same. As can be seen, reducing the nutrient level from 16 to a range between 15 and 12 are the alternatives that would pass a benefit-cost test, given the information provided. A national nutrient limit of 11 or less leads to a MAC higher than the estimated benefit.
Figure 3 Illustration of information provided in question about government agency
As described above, half of the sample received information in the introduction to the question about an internationally recommended standard of 8 nutrient units. Moreover, half of the sample received questions in a different order so that we could test for the possible influence of ordering effects. The hypotheses to be tested and the expectations are:
a) Whether the natural state alternatives are preferred to those that pass the benefit-cost test. If this is the case, then the respondents WTP for environmental improvement will be higher than the information about the maximum benefit for society stated in the question.
b) Whether the different contexts in the two questions influence the response behavior. The expectation is that there will be a difference, but it is unclear in what direction. One reasonable hypothesis is that respondents will have a higher WTP than MAC for the improvement of one lake but will choose a limit value where MBF=MAC. The latter choice would imply that the national level leaves room for the decision makers at the municipality level to decide what condition to strive for on a case to case basis based on local conditions.
c) Whether the response behavior differs between students with different educational backgrounds. The expectation is that students in economics will be more responsive to economic information, hence have a lower WTP than the other student groups.
0 50 100 150 200 250 300 16 15 14 13 12 11 10 9 8 7 6 5 M B F a nd M AC Nutritient level MAC MBF MBFRL MBFRH Naturalstate Standard
10 d) Whether the information about a standard influences the response behavior. The expectation is that information about a standard will increase the WTP compared with the group that did not receive this information.
Description of the experiment and the sample
The survey was administered to students recruited at a lecture, who were given a leaflet with a short description of the purpose of the study and login details to a web page. To give the students an incentive to participate, they were told that they would receive a movie ticket after answering the questionnaire. When answering the questionnaire, they were asked to consider their answers carefully, since they would not be able to go back to a previous page to revise a response. We did not want the respondents to have the possibility to go back and change the chosen alternative in the choice question.
The questionnaire consisted of five different parts. First the respondents were asked general questions about their work experience and their experience of decision making in organizations. The second set of questions asked what the respondent considered to be important to take into consideration in societal decision making. We asked 21 questions in order to reveal individual differences in attitudes and perceptions regarding aspects to consider in policy making. In the third section, the respondents were given background information for the choice questions. This was followed by the choice questions and a follow-up question. The questionnaire ended with questions about personal characteristics and, finally, questions about the respondent’s education.
Of 395 contacted students in Stockholm and Gothenburg, 126 completed the questionnaire. The students were recruited from nine different academic programs that we, in the analyses, categorize as environmental (56 students), economics (37 students) and political science (34 students).19 Table 1 presents some descriptive statistics of the respondents.
11
Table 1 Descriptive statistics of the sample and the data used in the estimation
Variable Obs Mean (Proportion
Std. Dev Min Max Explanation
City 126 0.21 1 = Stockholm; 0 = Gothenburg
Env 126 0.44 1 if subject = environmental science
Econ 126 0.29 1 if subject = economics
Pol 126 0.27 1 if subject = political science
Age 126 27.03 4.34 21 44 Age of respondent
Decision 126 3.32 1 4 1 and 2 if taking part in decision making E decision 37 3.27 2 4 Decision making for students in economic Work exp. 126 2.67 1 5 3 if worked 3 – 5 years
E work exp. 37 2.43 1 4 Work experience for students in economics
Standard 126 0.48 1 = information about EU standard, 0 = no information NLchosen1 126 8.62 1.84 6 12 Nutrient level of preferred alternative in question 1 NLchosen2 126 9.64 2.23 5 16 Nutrient level of preferred alternative in question 2 Alternative 1512 3.5 1 6 Number of alternatives in question 1 and 2
Accept 1512 0.71 Share of accepted alternatives in the two questions, 1=accept
Already from this table it appears that we have the answer to our first hypothesis since the mean values of the preferred alternatives in the two questions (NLchosen) are 8.64 and 9.63, which is below the nutrient levels that are economically efficient in the two questions.20 Another observation is that the standard deviation for the chosen alternative in question 2 is larger (NLchosen2).
It can also be seen, since the number of observations for the variable Alternative are 1512, that we have analyzed the data as a panel i.e., we assume that in each choice question the respondents have evaluated and decided to accept or reject all five alternatives in addition to the status quo. In order to do this we have had to assume that a respondent, besides the chosen alternative, also would accept all alternatives that have a total cost that is lower than the chosen one. We had to make this assumption since we did not ask them explicitly to evaluate and state whether each alternative was accepted or rejected. The variable Accept reveals that the acceptance rate is high; in total 71% of the alternatives presented to the respondents in the two questions were accepted.21
20 A t-test of equal means confirms that the chosen nutrient level for both questions is lower than the economically efficient ones.
21 Cameron and Quiggin (1994) among others have explored the statistical properties of this kind of data where one question is followed by another. Performing this type of estimation requires that the correlation between the
12
Data analysis and results
This study is designed as a WTP experiment where the respondents are asked to evaluate different options and then accept or reject them, hence a discrete choice format.22 Discrete choice experiments share the same theoretical basis, the random utility theory (McFadden, 1973; Hanemann, 1984; Carson and Hanemann, 2005). Each individual is assumed to choose the alternative that maximizes utility. Utility is treated as a random variable in the empirical estimation. With referendum data, there are only two alternatives in the choice set. Therefore, a binary model can be used in the estimation. With this modeling approach, it is possible to analyze the influence of both the characteristics of the alternatives and of the respondent. It is also possible to recover the parameters of the valuation function (Cameron and James, 1987a; 1987b; Nerhagen, 2001).
In order to analyze the data, we first illustrate the response behavior graphically to get visual information regarding hypotheses (a)-(c). We then estimate a random effects probit regression for binary outcomes using STATA to make a deeper investigation into the determinants of the response behavior and the answers to the hypotheses. Using a random effects probit regression we handled the problem of serial correlation, which results from respondents having evaluated several alternatives in a row.
Figure 4 presents the response distribution for the two questions. The curves show the number of respondents who accepted the MAC needed to reach a certain nutrient level. While a majority of the respondents accept the payment needed to reach a limit value of 12, the acceptance rate then declines and very few accept the cost of the lowest possible nutrition level. Hence the response behavior is in accordance with the requirements for this kind of estimation, i.e., the graph is non-increasing (Carson and Hanemann, 2005). When answering the question on choice of limit value (government context), the respondents could choose any value from 5 to 20. Therefore, in order to make the responses to the two questions similar in the estimation, we assumed that all respondents had chosen one of the stated alternatives for the limit values (the alternative above the stated one). For example, a person stating a limit value of 5 was assumed to have chosen the alternative with the limit value 6. In the diagram this is the response distribution named Government estimation, which differs slightly from the actual response distribution.
response and the questions answered by the same respondent is accounted for. We do this by using a random effects probit regression.
22 Numerous articles have been written on how to estimate non-market values using willingness to pay (WTP) and the reliability of such estimates (Brown et al., 2008; Spash et al., 2009; Vossler et al., 2012; Lancsar et al., 2013).
13
Figure 4 Number of respondents accepting the bid (=MAC) for a certain nutrition level
The graph shows that there is a difference in response behavior between the two questions. Most noticeable is the large share of respondents in the government context not accepting bids higher than 10 compared with in the municipality context.
Figure 5 and 6 present the empirical survival curves for the different student groups and the two questions. We present the share of respondents (vertical axis) who in the estimation were assumed to accept the stated MAC and corresponding total cost (horizontal axis) to achieve a certain nutrient level. The curves are similar but the respondents who are students in economics appear to have a somewhat lower acceptance rate. This implies that they have a lower willingness to pay than the other student groups. However, in all groups, a majority of respondents accept alternatives that are above those that are considered economically efficient, and hence it appears that achieving a natural state influences the response behavior for the three student groups in both questions.
Figure 5 Empirical survival curves for the municipality question with the total cost on the horizontal axis
0,00 0,20 0,40 0,60 0,80 1,00 1,20 16 15 14 13 12 11 10 9 8 7 6 5 Sh ar e of r esp on den ts ac ce ptin g "b id " Nutrition level
Municipality Government Government estimation
0,00 0,20 0,40 0,60 0,80 1,00 1,20 0 500000 1000000 1500000 2000000 2500000 Sh are o f re spo nd ent acc ept ing "bi d" Env Econ Pol
14
Figure 6 Empirical survival curves for the government question with the total cost on the horizontal axis
In the estimation, we let the valuation of a reduction in the nutrient level of decision maker i be denoted yi and assume that the valuations across decision makers are normally distributed. We also
suppose that the unobserved valuation can be expressed as a linear function of the explanatory variables, i.e., yi = xi´ + i, where is a vector of parameters, xi is a vector of explanatory variables,
and i is the random term that includes all unmeasured determinants of the value of the nutrient level
reduction to this decision maker. In the hypothetical question the decision maker is asked to consider a bid, ti, in our setting the stated marginal abatement cost (MAC). The decision maker will answer yes to
the stated bid if his valuation is greater to or equal to the bid, yi > ti or equivalently i > ti - yi, and no
otherwise (yi < ti). Under the assumption that is normally distributed with N (0,2), the probabilities
can be written as Prob (yes) = 1- ( t - x´) and Prob (no) = ( t - x´), where is the standard normal cumulative distribution function and = -1/ and = /. The inclusion of the bid t enables the identification of the scale parameter = -1/. Using these relationships, the valuation function parameters may be derived by = = -/ (see Li, 1996, for further details).
We first test a model that only includes the attributes of the alternatives in the two questions, i.e., marginal abatement cost (MAC) and change in nutrient level (DNL). We estimate the two questions separately and jointly. The results are presented in Table 2. As expected, we find that both variables have a negative sign, meaning that as the cost and improvement of the lake increase, the probability of choosing yet another alternative decreases. However, there are differences in the coefficients for the different variables between the two questions.
Using a likelihood ratio test, we can reject the null hypothesis of equal parameters for the two questions.23 From this we conclude that the preliminary finding, that the response pattern for the two questions differs, is confirmed. Hence, there is support for our second hypothesis (alternative b). In addition to the difference in parameters, the results show that the variable MAC is insignificant in the
23 The χ2 value is 108.82 for the LR test, which is above the 95% critical value at 3 df.
0,00 0,20 0,40 0,60 0,80 1,00 1,20 0 500000 1000000 1500000 2000000 2500000 Sh are o f re spo nd ent s acc ept ing "bi d" Env Econ Pol
15 question with a government context. Hence, this variable does not seem to have influenced the choices made regarding a national limit.
Table 2 Estimation results for the basic model including MAC and delta NL as explanatory variables
Variable Municipality Parameters t-value Government Parameters t-value Both questions Parameters t-value
Constant 34.98 3.67 9.45 3.20 5.88 15.11 MAC -0.000054 -2.88 -0.000006 -0.84 -0.000008 - 5.41 DNL -2.88 -4.10 -1.08 -3.54 - 0.52 -13.97 rho 0.98 0.84 0.45 LogL -182.70 -183.26 -420.37 N 756 756 1512 Groups 126 126 126 Obs/group 6 6 12
Based on this basic model, we separately for the two questions explored which other variables could explain whether or not an alternative was chosen. We tested different specifications, e.g., including total cost instead of MAC as well as socio-economic characteristics such as age and sex, but none of them improved the fit of the model. We also tested for ordering effects by estimating the basic model for the two questions separately for the two sub-groups. We did not find that the parameter estimates differed and hence we conclude that the order in which the two questions were presented did not influence the response behavior (see Appendix 3 for the results). The influence of individual attitudes on the choice behavior is explored in another paper by the authors.
The final model to explain the choice behavior is presented in Table 3. In what follows, we focus on the choice in a municipality context since we could not find statistically significant additional variables for the government context and since the coefficient for MAC was insignificant. Table 3 presents the estimates for the parameters in the binary random effects probit model where accepting or rejecting the bid is the dependent variable. We also present the estimates for the implicit valuation model that are computed from the basic model according to the theoretical model presented above. In addition to the variables in the basic model, the following were included:
- Standard, which takes the value 1 if the respondent had received information about an internationally recommended standard of 8 nutrient units.
- CE, which takes the value 1 for the alternatives that pass the benefit-cost test, 0 otherwise. - Econ, which takes the value 1 if the academic major of the respondent is economics, 0
16 - DNLEcon, which is the alternative’s change in nutrient level for respondents in economics. The first four variables modify the constant, which is the likelihood of accepting a bid. The final variable (DNLEcon) allows for differences in the parameter estimate for the students in economics compared to the other two groups for the influence of the variable DNL. All values are statistically significant and have the expected signs.
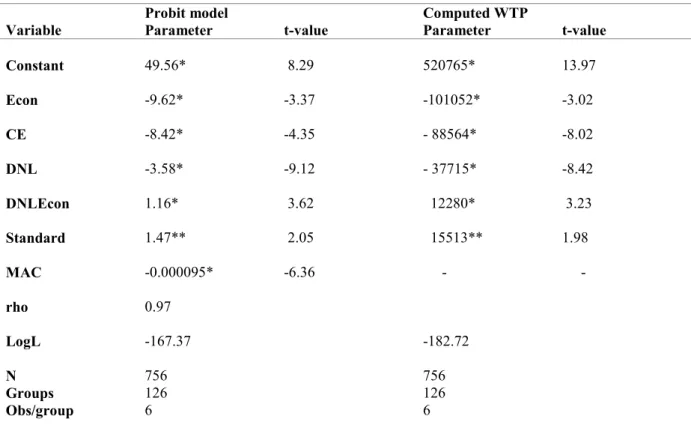
Table 3 Estimation results for the probit model and computed WTP estimates for the municipality question
Variable Probit model Parameter t-value Computed WTP Parameter t-value
Constant 49.56* 8.29 520765* 13.97 Econ -9.62* -3.37 -101052* -3.02 CE -8.42* -4.35 - 88564* -8.02 DNL -3.58* -9.12 - 37715* -8.42 DNLEcon 1.16* 3.62 12280* 3.23 Standard 1.47** 2.05 15513** 1.98 MAC -0.000095* -6.36 - - rho 0.97 LogL -167.37 -182.72 N 756 756 Groups 126 126 Obs/group 6 6
* and ** indicate a coefficient statistically different from zero at the 5% and 10% level, respectively.
Based on the results in Table 3, we can conclude the following regarding the questions we wanted to analyze:
a) Are the natural state alternatives preferred to those that pass the benefit-cost test? Yes, the parameter estimate for the dummy variable CE is negative. b) Does the response behavior differ for students with different academic majors?
Yes, the parameter for Econ is negative and significant
c) Does information about an international standard influence the response behavior? Yes, the parameter for the dummy variable Standard is positive and significant.
Regarding the first hypothesis (a), concerning how information on natural state versus alternatives that pass a benefit-cost test influences response behavior, we can conclude that environmental quality (natural state) was a major primer in this experiment. We find from the descriptive statistics that the mean preferred nutrient level for the whole sample was 9, which is below the alternatives that passed the benefit-cost test in the two questions. We can also see in Figure 2 that a large share of the
17 respondents, even among the students in economics, chose alternatives with nutrient levels that are within the natural state.
That the majority of respondents chose alternatives that do not pass the benefit-cost test is, as expected, confirmed by the valuation model. Estimating the model for the means of the explanatory variables (see Table 4), we obtain a mean WTP for abatement of 282,014 SEK for the full sample, which is above the 160,000 SEK that was the upper limit of the benefit of preserving the lake. If everyone behaved as an economist, the WTP would be 258,132 SEK. For non-economists, the WTP is 291,424 SEK.24
Table 4 Mean of variables used in the estimation for the full sample, economists, and non-economists.
Variable Full sample Economists Non-economists
DNL 5.5 5.5 5.5
DNLecon 1.615 5.5 0
Standard 0.476 0.486 0.472
CE 0.33 0.33 0.33
Econ 0.29 1 0
Another interesting finding from this experiment is the difference in response behavior between the two questions with different contexts. From a policy perspective, we consider it disturbing that there is such a spread in the answers to the question about a national limit value. This type of government decision is supposed to influence activities at different levers across multiple actors. The variation in responses suggest that there are no basic principles, for example the comparison between benefits and costs, for determining such a regulation. Possible reasons for our findings could be that the question about stating a limit value concerned a more abstract context since it cannot be known beforehand what the impact of a standard will be. Another possible explanation is the design of the two
experiments where the alternatives were fixed in the municipality questions, while all nutrient levels could be chosen in the government questions.
Yet another reason for the difference in response behavior could be the “cue” that we introduced in the municipality question where the alternative with NL=10 in question 1 had a higher MAC than the alternative with NL=8 in the same question. In question 2, the MAC for limit value 10 was as high as in question 1, but for limit value 8 it was higher. Respondents who paid attention to the MAC may therefore have made a different choice in question 2 than in question 1. We are unable to explore these differences further given the available data, but we do recommend that this be done in future research.
18
Discussion and conclusions
In this paper we have presented the results from an experiment where students were asked to act as policy makers making decisions about environmental improvements in a social dilemma situation. The dilemma was that alternatives that implied bringing a lake back to a natural state did not pass a
benefit-cost test. The main reason for our interest in this question is that the EU and the Swedish government and the parliament want to introduce benefit-cost analysis as an analytical tool while at the same time using management by objectives in environmental policy. Since it is established in the literature that there is a resistance against the use of this type of analysis in policy making (Sunstein, 2000; Radaelli, 2005), we wanted to explore how individual decision makers respond to this kind of information. In particular, we wanted to explore the possible influence of education on the decisions made. There are several possible reasons for the observed resistance, such as lack of routines, difficulty providing the necessary data, presence of other overriding goals, and non-economists’ lack of understanding of the information that a benefit-cost analysis can provide. While the first two reasons can be attended to in a governance system and in an organization, the last two are related to how individuals behave as decision makers.
In the experiment, we focused on creating a realistic choice scenario. Since questions have been raised regarding the implementation of the Water Framework Directive, we decided to use it as a case study.25 The respondents were asked to choose alternatives in two different contexts, one as a decision maker in a municipality and one as a decision maker in a governmental agency. In the former context, information was given about the cost of achieving improvements in one particular lake in a
municipality. In the latter, the same kind of information was provided but this time for a representative lake in the country.
While the responses to the two questions differ somewhat, they both support the conclusion that reaching an environmental situation that is considered a natural state of a lake is more important for the respondents than choosing measures that pass a benefit-cost test. There is however a difference in response behavior between the two questions, where the responses to the question about stating a limit value were more varied. This is an interesting finding for future research since those decisions can have an important influence on the practical implementation of a policy nationwide. Further analysis regarding the question of preserving one lake revealed that there is a difference in response behavior between students with a major in economics and those studying environmental or political science. Students in economics on average have a lower WTP for improving the lake. An international standard
25 The same type of social dilemma situation can be created regarding the Air Quality Framework Directive, which is the main focus in the research project of which this study is a part. However, we chose water quality since we expect that when placing respondents in a scenario where they could prevent premature human deaths, the answers should be more influenced by personal attitudes and values.
19 has a significant influence on the choice, with the coefficient for this dummy variable being positive, implying a higher WTP for students receiving information about an international standard.
The provision of information about an internationally recommended standard to a sub-group of respondents was inspired by the research of Tenbrunsel et al. (2000) and Ordóñes et al. (2009). Their results indicate that a standard or a goal makes respondents less likely to consider other aspects that are of relevance in a choice situation regarding environmental improvements. Our conclusion is that our results support the findings of Tenbrunsel et al. (2000) and Ordóñes et al. (2009), although in our case information about both a natural state and a standard influenced the decision making.
Our results raise at least two questions regarding policy making. First, given that there is an increasing demand for the use of benefit-cost analysis in the regulatory process in the EU and its member states, clearer guidelines may be needed on how civil servants should assess the results in cases where there is a conflict between economic efficiency and other goals. Secondly, since environmental objectives and standards appear to have a strong influence on decision making, there is a need to discuss how member states should implement the EU directives, given that environmental conditions differ greatly within the EU. In order to achieve cost-efficient solutions, customization and differentiation may be needed. This has been discussed by Proost and Van Dender (2012). We therefore believe there is a need for further research on goal setting along the lines of the research presented in Edvardsson and Hansson (2005).
So far, the use of environmental objectives in the environmental legislation within the EU and in the Swedish environmental objective system has not had the expected results (Swedish EPA, 2012). This points to a need for further research into the functioning of the “management by objectives” system in environmental policy making. More research should look into the actual implementation in systems with decentralized decision making, how individual preferences influence the work within agencies and administrations, the conflict between the ambitions of politicians and a practical reality with resource constraints, and the role politicians play in creating these conflicts. Vredin Johansson et al. (2011) for example conclude that the environmental quality objective A non-toxic environment is far too visionary and of little practical relevance since there appears to be other barriers to remediation than the type and amount of funding.
Finally, regarding the estimation, the design we have used in this experiment implied that we had to make some assumptions on the choice behavior in order to analyze the data. Thus, we had to assume that a respondent would also accept all alternatives with a lower total cost and a smaller improvement in the nutrient level than the chosen one. We do not believe that this is a strong assumption that has influenced the outcome of the analysis. Due to the design, we have not been able to explore the exact implication of the size of the attributes, nor of the context. We do however believe that these are
20 aspects that will influence the outcome in a real choice situation and hence future research should also focus on how to create realistic choice situations that allow for a deeper understanding of how
different aspects influence the behavior in this type of decision context. Most studies discuss these issues in relation to how individuals make choices and whether it is appropriate to use individuals’ willingness to pay in decisions on public spending (Sunstein, 2005). Yet we believe that more studies are needed on how individuals working in different agencies and administrations behave in response to these types of choice situations. Also, further exploration into the influence of standards or other types of information on what is considered to be a good environmental status would be interesting.
Bibliography
Aghion P. & Tirole J. (1997) Formal and Real Authority in Organizations. The Journal of Political
Economy, Vol. 105, No. 1, pp. 1-29
Andersen S., Harrison G.W., Igel Lau M. & Rutström E.E. (2013) Dual criteria decisions. Journal of
Economic Psychology, http://dx.doi.org/10.1016/j.joep.2013.02.006
Brown T.C., Kingsley D., Peterson G.L., Flores N.E., Clarke A. & Birjulin A. (2008) Reliability of individual valuations of public and private goods: Choice consistency, response time, and preference refinement. Journal of Public Economics 92, pp. 1595-1606
Cameron, T.A. & James M.D. (1987a), Estimating Willingness to Pay from Survey Data: An Alternative Pre-Test-Market Evaluation Procedure. Journal of Marketing Research 24, 389-395.
Cameron, T.A. & James M.D. (1987b), Efficient Estimation Methods for “Closed-Ended” Contingent Valuation Surveys. The Review of Economic Statistics 69 (2), 269-276.
Cameron, T.A. & Quiggin J. (1994) Estimation Using Contingent Valuation Data from a
“Dichotomous Choice with Follow-Up” Questionnaire. Journal of Environmental Economics
and Management 27, pp. 218-234
Carlsson, F., Kataria, M., & Lampi, E. (2011). Do EPA administrators recommend environmental policies that citizens want? Land Economics, 87, 60-74.
Carson R.T. & Hanemann W.M (2005) Contingent Valuation. In Mäler K-G and Vicent J.R (eds)
Handbook of Environmental Economics, Volume 2. Elsevier B.V.
Christensen T. & Laegreid P. (2007) Regulatory Agencies – The Challenges of Balancing Agency Autonomy and Political Control. Governence, 20(3). Pp. 499-520
County Administrative Board of Dalarna (2011) Är miljömålsåtgärder effektiva? En utvärdering i fyra
21 County Administrative Board of Dalarna (2012) Hur går miljöarbetet regional och lokalt – delprojekt
i fördjupad utvärdering av Sveriges miljömål 2012. Rapport 2012-06. RUS Länsstyrelsen i
Dalarnas Län (In Swedish)
De Francesco F., Radaelli C.M & Troeger V.E. (2011) Implementing regulatory innovations in Europe: the case of impact assessment. Journal of Public
Policy.DOI:10.1080/13501763.2011.607342
De Vries J. (2010) Is New Public Management Really Dead? OECD Journal on Budgeting. Volume 2010/1. http://www.oecd.org/gov/budgeting/48168865.pdf
Edvardsson K. & Hansson S.O. (2005) When is a goal rational? Social Choice and Welfare 24. Pp. 343-361
European Commission (2002) Action plan “Simplifying and improving the regulatory environment”. COM (2002) 278 final.
http://eur-lex.europa.eu/LexUriServ/LexUriServ.do?uri=CELEX:52002DC0278:EN:NOT
Forslund J., Samakovlis E., Vredin Johansson M. & Barregard L. (2010) Does remediation save lives? – On the cost of cleaning up arsenic-contaminated sites in Sweden. Science of the Total
Environment. 408, pp. 3085-3091
Farrow S. & Shapiro S. (2009) The Benefit-Cost Analysis of Security Focused Regulations. Journal of
Homeland Security and Emergency Management Vol. 6, Iss. 1, Article 25
Futter M.N., Keskitalo E.C.H., Ellison D., Pettersson M., Strom A., Andersson E., Nordin J., Löfgren S., Bishop K. & Laudon H. (2011) Forests, Forestry and the Water Framework Directive in Sweden: A Trans-Disciplinary Commentary. Forests no 2, pp 261-282.
http://www.mdpi.com/1999-4907/2/1/261
Gov. Bill, 2009/10:155; Swedens’s Environmental Objectives – For More Effective Environmental Action
Haglund A-L., Carlsson T., Larson D., Lundvall D. and Olofsson H. (2010) Uvärdering av biologiska
bedömningsgrunder för sjöar. Rapport 2010:16. Miljöenheten. County Administrative Board
of Dalarna (In Swedish)
Hahn R.W (2000) The Impact of Economics on Environmental Policy. Journal of Environmental
Economics and Management 39, pp. 375-399
Hahn R. (2010) Designing Smarter Regulation with Improved Benefit-Cost Analysis. Journal of
Benefit-Cost Analysis: Vol, 1. Iss. 1, Article 5
Hahn R.W. & Dudley P.M. (2007) How Well Does the U.S. Government Do Benefit-Cost Analysis?
Review of Environmental Economics and Policy, Vol. 1, No. 2, pp. 192-211.
Hanemann, W. M. (1984) Discrete/Continuous Models of Consumer Demand. Econometrica Vol. 52 No. 3, 541-561.
22 Hansson S-O., Edvardsson Björnberg K & Vredin Johansson M. (20xx) Making climate policy
efficient: implementing a model for environmental policy efficiency. Forthcoming in
International Journal of Sustainable Society.
Hedelin B. & Lindh M. (2008) Implementing the EU water framework directive – Prospects for Sustainable Water Planning in Sweden. European Environment 18. pp. 327-344
Hultkrantz, L. (2009). Ett styvbarn. Ekonomisk debatt, 37(7), 3-5.
Hupe P. & Hill M. (2007) Street-level Bureaucracy and Public Accountability. Public Administration, Volume 85, No. 2, pp. 279-299
Jussila Hammes J., Pyddoke R. and Nerhagen L. (2013) The impact of education on environmental
policy decision-making. CTS working paper 2013:9
http://swopec.hhs.se/ctswps/abs/ctswps2013_009.htm
Kocher M., Martinsson P. & Visser M. (2012) Social background, cooperative behavior and norm enforcement. Journal of Economic Behavior and Organization 81, pp. 341-354
Lancsar E., Louviere J., Donaldson C., Currie G. & Burgess L. (2013) Best worst discrete choice experiments in health: Methods and an application. Social Science and Medicine 76. pp. 74-82 Li, C-Z. (1996), Semiparametric estimation of the binary choice model for contingent valuation. Land
Economics 72. pp. 462-473
Lindberg G. & Nerhagen L. (2013) Methodology for quantified impact assessment for the Swedish
Transport Agency. VTI rapport 783. Swedish National Road and Transport Research Institute,
VTI. (In Swedish)
Lindegarth M., Carstensen J. & Johnson R.K. (2013) Uncertainty of biological indicators for the WFD
in Swedish water bodies: current procedures and proposed framework for the future. Waters
report no. 2013:1, Delvierable 2.2-1. Havsmiljöinsitutet, Sweden.
Lipsky M. (1980) Street-level bureaucrats: The dilemmas of the individual in public services. New York, NY: Russel Sage Foundation
Loomis J.B. (2011) Incorporating Distributional Issues into Benefit Cost Analysis: Why, How and Two Empirical Examples Using Non-market Valuation. Journal of Benefit-Cost Analysis. Vol. 2, Iss. 1. Article 5
Loyens K. & Maesschalck J. (2010) Toward a Theoretical Framework for Ethical Decision Making of Street-Level Bureaucracy: Existing Models Reconsidered. Administration & Society, Volume 42, Issue 1, pp. 66-100
Marley A.A.J. & Pihlens D. (2012) Models of best-worst choice and ranking among multiattribute options (profiles) Journal of Mathematical Psychology 56, ppl 24-34
McFadden, D. (1973), Conditional Logit Analysis of Qualitative Choice Behavior. In P. Zaremmbka
23 May P.J. & Winter S.C. (2009) Politicians, Managers, and Street-Level Bureaucrats: Influences on
Policy Implementation. Journal of Public Administration Research and Theory. Volume 19, Issue, 3, pp. 453-476
Mazur E. (2011) Environmental enforcement in decentralized governance systems: Toward a
Nationwide Level Playing Field. OECD Environment working papers No. 34. OECD
Publishing.
Melin M., Edman J. & Danielsson H. (2012) Åtgärdsplan för flottledsrensade vattendrag i Dalarnas
Län. Rapport 2012:12. Miljöenheten. County Administrative Board of Dalarna (In Swedish)
Miller G.J. & Whitford A.B. (2007) The Principal’s Moral Hazard: Constraints on the Use of
Incentives in Hierarchy. Journal of Public Administration and Research Theory. Volume 17, Issue 2, pp. 213-233
Ministry of environment (2013) The Swedish environmental objective system. Article no. M2013.01 Mirelman A., Mentzakis E., Kinter E., Paolucci F., Fordham R., Ozawa S., Ferraz M., Baltussen R. &
Niessen L.W. (2012) Decision-making criteria among National Policymakers in Five Countries: A discrete choice experiment eliciting relative preferences for equity and efficiency. Value in health 15, pp. 534-539
Nerhagen L. (2001) Travel demand and value of time – towards an understanding of individuals
choice behavior. Thesis. Economic studies 104. Department of Economics. University of
Gothenburg
Nerhagen L. & Hultkrantz L. (2013) Economic analysis of policy measures in disaster risk
management – theory, methodology and an example. VTI rapport 789. Swedish National Road
and Transport Research Institute, VTI. (In Swedish)
Nilsson, J-E., Pyddoke R., Andersson M., Hansen F., Isacsson G., Lindberg G. & Nerhagen L. (2009)
Infrastructure policy on an economic basis. VTI rapport 654. Swedish National Road and
Transport Research Institute, VTI. Report to a government committee, see Appendix 2 in SOU 2009:31. (In Swedish).
Nyborg K. & Rege M. (2003) On social norms: the evolution of considerate smoking behavior.
Journal of Economic Behavior and Organization. Vol 52, pp. 323-340
OECD (2004) Environmental Performance Reviews: Sweden
http://www.oecdbookshop.org/oecd/display.asp?lang=EN&sf1=identifiers&st1=972004091e1
OECD (2007) OECD Reviews of Regulatory Reform. Sweden. Achieving results for sustained growth.
Paris. OECD publishing
OECD. (2008). Regulatory reform and the environment. OECD reviews of regulatory reform.
Regulatory reform in Sweden. Paris: OECD
OECD (2010) Better regulation in Europe – Sweden.
24 Ordóñes, L. D., Schweitzer, M. E., Galinsky, A. D., & Bazerman, M. H. (2009). Goals gone wild: The
systematic side effects of over-prescribing goal setting. Academy of Management
Perspectives, 23(3), 82-87.
Ostrom E. (2009) A Polycentric Approach for Coping with Climate Change. Policy Research Working Paper 5095. The World Bank. Background paper to the 2010 World Development Report. Pouta E., Rekola M., Kuuluvainen J. Li C-Z. & Tahvonen O. (2002) Willingness to pay in different
policy-planning methods: insights into respondents’ decision-making processes. Ecological
economics 40, pp. 295-311
Proost S. & Van Dender K. (2012) Energy and environment challenges in the transport sector.
Economics of Transportation 1, pp. 77-78
Radaelli C.M. (2005) Diffusion without convergence: how political context shapes the adoption of regulatory impact assessment. Journal of European Public Policy 12:5, pp. 924-943
Pyddoke, R., & Nerhagen, L. (2010). Environmental policy based on economic efficiency. The case of
policy instrument choice for air quality standards for nitrogen dioxide and particles. VTI
rapport 690. Swedish National Road and Transport Research Institute, VTI. (In Swedish) Robinson L.A. & Hammitt J.K. (2011) Behavioral Economics and the Conduct of Benefit-Cost
analysis: Towards Principles and Standards. Journal of Benefit-Cost Analysis Vol. 2. Iss. 2, Article 5.
Samakovlis E. & Vredin Johansson M. (2005) Samhällsekonomiskt underlag i miljöpolitiken: brister och förbättringar. Ekonomisk debatt no 7, pp 30-39
Samakovlis E. & Vredin Johansson M. (2007) En soppa med Klimp? Utvärdering av
kostnadseffektiviteten i klimatinvesteringsprogrammen. Ekonomisk debatt no 7, pp 31-43 SFS 2010:1111 Förordning om ändring i förordning (2009:1476) med instruktion för Naturvårdsverket Shapiro S. & Guston D. (2007) Procedural Control of the Bureaucracy, Peer Review and Epistemic
Drift. Journal of Public Administration Research and Theory. Volume 17, Issue 4, pp. 535-551
Siikamäki J. & Layton D.F. (2007) Discrete choice survey experiments: A comparison using flexible methods. Journal of Environmental Economics and Management 53, pp. 122-139
Spash C.l., Urama K., Burton R., Kenyon W., Shannon P. & Hill G. (2009) Motives behind willingness to pay for improving biodiversity in water ecosystems: Economics, ethics and social psychology. Ecological Economics 68, pp.955-964
Sunstein C.R. (2000) Cognition and Cost-Benefit analysis. The Journal of Legal Studies, Vol. 29, pp. 1059-1103
Sunstein C.R. (2005) Cost-Benefit Analysis and the Environment. Ethics 115, pp. 351-385 Swedish EPA (2004) Ekonomiska konsekvensanalyser i myndigheternas miljöarbete – förslag till
25 Swedish EPA (2012) Steg på vägen. Fördjupad utvärdering av miljömålen 2012. Rapport 6500.
Stockholm. Naturvårdsverket (In Swedish)
Tenbrunsel A.E., Wade-Benzoni K.A., Messick D.M. & Bazerman M.H. (2000) Understanding the influence of environmental standards on judgements and choice. Academy of Management
Journal. Vol. 43, No. 5, pp. 854-866
Vossler C.A., Doyon M. & Rondeau D. (2012) Truth in Consequentiality: Theory and Field Evidence on Discrete Choice Experiments. American Economic Journal: Microeconomics Vol. 4, Issue 4
Vredin Johansson M., Forslund J., Johansson P. & Samakovlis E. (2011) Can we buy time? Evaluation of the Swedish government’s grant to remediation of contaminated sites. Journal of
Environmental management. 92, pp. 1303-1313
Zhan X., Lo C.W & Tang S-Y. (2013) Contextual Changes and Environmental Policy
Implementation: A Longitudinal Study of Street-Level Bureaucrats in Ghuangzhou, China.
Journal of Public Administration Research and Theory. Doi:10.1093/jopart/mut004
Zweifel U-L. (2011) Waters: Ett 5-årigt forskningsprogram om de ekologiska bedömningsgrunderna
för vattenkvalite. Presentation at the conference Vattendagarna 2011, see
26
Appendix 1
In this appendix we translate from Swedish both the background information given to the respondents prior to the two environmental policy making questions in the questionnaire and the actual questions. The underlined sentence about an internationally-agreed threshold was included in about half of the surveys.
Environmental policy making
EU’s goal and your job
EU legislationstipulates that allmembercountriesshouldimplement measures toprotect water
quality, with the goal of maintaining or restoring good ecological status. Agood ecological statusis to
be understood asa lake having conditions close tothose in an unaffectedforest lake.As a basis for
efforts to restorewater quality,asurvey and analysis ofwater containing information abouthuman
impactson water qualityandan economic analysisof water use should be carried out.
You will soon get to answer two questions and one follow-up question, where we want you to try to put yourself in the role of a civil servant. But first you will get some information describing the environmental problem and the measures that can be implemented to improve the environment. Read the text carefully. You cannot return to it once you have left the page with background information. Background information about water and environmental effects in Sweden
In Sweden, there are almost 100,000 lakes and streams. Many of these are affected by pollution although measures have been implemented to reduce the impact. One problem is eutrophication, i.e., the concentration of nutrients is too high. In this study, we assume that about 20,000 lakes have concentrations much above the value that can be considered a natural state. Measures that can be implemented to reduce impacts include: improving municipal wastewater treatment plants and reducing emissions from agriculture. The internationally-agreed threshold indicating a desirable nutrition level is 8 nutrient units/liter.
Research has shown that the nutrient content is an important factor affecting fish stocks and the rest of the ecosystem of a lake. An unaffected forest lake has a total content of 5-10 nutrition units/liter; the ecosystem may collapse at a level of 20 nutrient units/liter.
One way to measure the impact of increased nutrient content is to measure the ratio of perch to carp. An unaffected lake has a ratio of 0.5. If the nutrient content increases, the ratio falls (see figure). The amount of perch decreases relative to carp, which has a negative impact on the ecosystem of a lake. When the number of perch decreases, the amount of zooplankton that eat phytoplankton also falls, making the lake turbid with poor visibility. It also reduces the biodiversity of the lake and makes it less attractive for, for example, swimming.
Economic background
A survey has been carried out showing how concentrations in a lake with an average level of pollution located in an agricultural area near an urban area can be reduced by various measures. In the following questions, you will receive information about the costs of implementing the various measures that can reduce the levels.