Master
's thesis • 30 credits
Agricultural Economics and Management - Master's Programme
The impact of rural electrification and
institutional quality on agricultural output
-
a case of Sub-Saharan Africa
Swedish University of Agricultural Sciences
The Impact of Electrification on Agricultural Output -case
of Sub-Saharan Africa
Salome Amuakwa-Mensah
Supervisor: Yves Surry, Swedish University of Agricultural Sciences,
Department of Economics
Examiner: Jens Rommel, Swedish University of Agricultural Sciences,
Department of Economics Credits: Level: Course title: Course code: Programme/Education: Responsible dep.: Faculty: Place of publication: Year of publication: Name of Series: Part number: ISSN Online publication: Keywords: 30 hec A2E
Master thesis in Economics EX0907
Agricultural Economics and Management - Master's Programme 120,0 hec
Department of Economics
Faculty of Natural Resources and Agricultural Sciences
Uppsala 2019
Degree project/SLU, Department of Economics 1232
1401-4084
http://stud.epsilon.slu.se
agricultural output, electrification, institutional quality, output per labour, output per land, Sub-Saharan Africa
Dedication
Abstract
Agriculture is the means of livelihood for most rural communities in Sub-Saharan Africa. In order for small-scale farmers to meet the basic needs of their families and semi-large-scale farming for trading purposes, rural farmers seek to expand their output. To this end, the kind of input employed in the crop production process is very important. In terms of labour, most rural farmers employ their children or other family members and or members of the community where they use traditional farming tools. The use of energy and for that matter, electricity is very little. What happens when rural farmers have access to electricity? What happens if their homes and farms had a constant supply of electricity? Would the farmers spend more time on the farm knowing that they could increase their output and finish household tasks later in the evening when it gets dark because they have access to electricity? The purpose of this thesis is to test the impact of rural electrification on agricultural output. More precisely, I focus on rural household access to electricity on a macro level. I also try to draw a link between a country’s institutional quality and the impact of electrification. I make use of data drawn from the Food and Agriculture Organization of the United Nations, World Bank Development Indicators Aklin, S. P., & Urpelainen (2018) and the World Bank Climate Change Knowledge Portal, using date from 1990 to 2016. To do this, I employ a simple Cobb-Douglas production function approach where agricultural output is a function of labour, capital, electrification and other inputs such as rainfall, temperature and land. I later introduce a variable which measures the quality of institution for a country. The study concludes that rural electrification does have a positive effect on agricultural output; the interaction between electrification and institutions has a significant positive effect on agricultural output; and the efficiencies of labour and land also have a positive effect on agricultural output. For this reason, I suggest that governments and policymakers should focus on providing electricity to their rural communities to increase yield in agriculture.
Table of Contents
1 INTRODUCTION ... 1
1.1 Problem background and statement ... 1
1.2 Aim and delimitations ... 3
1.3 Structure of the report ... 4
2 LITERATURE REVIEW ... 5
2.1 How to measure agricultural output/productivity. ... 5
2.2 Infrastructure... 6
2.2.1 Energy infrastructure and agricultural output ... 6
2.2.2 Institutional Infrastructure and agricultural output... 10
2.3 Literature gaps and contribution to literature. ...12
3 METHODOLOGY ...14
3.1 Theoretical framework and Empirical model ...14
3.2 Data and data sources ...17
3.2.1 Relationship between dependant variables and rural electrification ... 20
4 RESULTS ...24
4.1 Electrification and agricultural output ...25
4.2 Interaction effect ...30
5 ANALYSIS AND DISCUSSION ...35
5.1 Comparing results with other studies ...35
6 CONCLUSIONS AND POLICY RECOMMENDATIONS ...37
REFERENCES ...39
List of figures
Figure 1. Electricity and Rural Development Nexus. ... 8
Figure 2: Relationship between rural electrification and gross agricultural output. ...21
Figure 3: Relationship between rural electrification and output per labour ...22
Figure 4: Relationship between rural electrification and output per land ...23
Figure 5: Total Effect of electrification on output by country ...32
Figure 6: Total effect of electrification on output per labour by country ...33
Figure 7: Total effect of electrification on output per land by country ...34
Figure 8: Percentage of rural electrification in Sub-Saharan Africa. ...45
Figure 9: Trend of output and electrification from 1990-2016 ...46
Figure 10: Trend of electrification and output per land from 1990-2016 ...46
Figure 11: Trend of electrification and output per land from 1990-2016 ...47
Figure 12: Box plots for the various variables ...47
List of tables
Table 1: Summary of literature review. ...12Table 2: Definition of main variables and their data sources ...18
Table 3: Unit root test ...24
Table 4: Electrification on agricultural output-Fixed Effect Model...26
Table 5: Effect of electrification on labour and land efficiency-Fixed Effect Model ...27
Table 6: Electrification on output and input efficiencies-Fully Modified OLS ...29
Table 7: FMOLS model for electrification and institution interaction ...31
Table 8: Correlation Matrix ...50
Table 9: FMOLS efficiency without L and N in main model ...50
Table 10: Fixed Effect model for electrification and institution interaction ...51
Abbreviations
FAO-UN: Food and Agricultural Organization of the United Nations GDP: Gross Domestic Product
SSA: Sub-Saharan Africa
1 Introduction
1.1 Problem background and statement
Without any form of energy, nothing can be achieved. From the strength of man to the power of a machine, energy is highly needed to complete daily tasks. In the branch of agriculture, several economies seek to increase their output with the use of energy. While there are millions who starve in the region, Sub-Saharan African countries export crops to Western countries. These Western countries including Japan in most cases provide support to their farmers who produce more to cater for their countries’demand for food. Unlike the Western agricultural sector, the nature of agricultural production in Sub-Saharan Africa is rather labour-intensive and least mechanised. This stresses the need for the use of energy to curtail the issue of food insecurity and alleviate hunger. By this, some of the key components of the Sustainable Development Goals will be achieved. Galanopoulos et al. (2011) state that, the issue of productivity growth has drawn considerable attention over the last few decades, as it is considered to be the main source of development for the agricultural sector that is responsible at a rate able to meet the demands for food and raw materials arising out of steady population growth. They also quote Hayami and Ruttan (1970) and J. Coelli and Rao (2003) that “a country that falls short of achieving agricultural productivity growth may suffer deterioration of either its foreign exchange balance or of its internal terms of trade against the industry, thereby inhering industrial production”.
With the growing demand for energy, life is getting easier. Over the years, man has shifted from the use of ancient methods to more modern methods of living. For instance, the medium of transport has moved from the use of horses and camels to the use of automobiles which uses different forms of energy. Access to energy has boosted innovation over the years. This stems from the fact that firms seek to increase output or productivity. In the same vein, the agricultural sector of several economies seeks to increase their output by the use of energy. It is popular knowledge that demographic transition and the rise of new cities have put pressure on local demand for food in Africa. However, agricultural production has not grown at the same level to match the higher demand. Consequently, demand for imported agricultural products has increased and this has put pressure on local currency, balance of payment etc. With the projected growth in population and rate of urbanization (which is making productive lands for
agriculture very scarce), the problem is likely to be severe in the future in Africa with serious implications on food security, hunger and malnutrition. This calls for the need to change the current production method from labour-intensive to mechanised production type. In this regard, the role of energy stands out as very significant. Is it possible to increase or expand agricultural output by having access to electricity? What has the institutional quality of a country got to do with the impact of electrification on agricultural output?
Several authors couldn’t agree more the need for agricultural output expansion. In Sub-Sahara Africa (SSA), access to electrification has been an issue. Even in the urban areas that are presumed to be more advanced face this issue. Rural areas where the majority of farming activities take place and the livelihoods of many depend on agriculture are lagging behind in having access to electricity in their communities. The percentage of rural electrification in SSA is less than 50% (see Figure 8 in appendix). In most developing countries, agriculture employs a large proportion of labour and in some cases contributes a higher share to the country’s Gross Domestic Product (GDP). According to Namara et al., (2010), there are about 1 billion people who live on less than $1 a day and 850 million rural poor are primarily engaged in agriculture. This implies that an increase in agricultural output is likely to create employment, increase wages and increase the country’s GDP at large.
The institutional quality of a country determines to a large extent the well-being of the country. Can the low agricultural output be attributed to the low institutional quality in Sub-Saharan Africa? In their paper, Fulginiti et al. (2004) address the institutions and socio-political factors that may have affected agricultural productivity performance in SSA. Also, their study concludes that the relationship between growth in productivity and institutional factors strongly affects GDP growth rates. Adom et al. (2018) indicate that good political institution matters. In their paper, Nkurunziza and Bates (2004) measured the impact of political variables in terms of stability, regime type and violence, on economic growth in Africa. The issue of a country’s institutional quality is of great concern to many. To some extent, it determines how some resources are allocated within a country. How does it reflect in agricultural output? Does the effect of electrification on agricultural output depend on the quality of institutions? While there are several categories and measures of institutional quality, I use Polity2 measures as democracy index between -10 and 10. This is in line with the “selection of authority” category by Lio & Liu (2008) who test the hypothesis that better governance fosters agricultural productivity. They show that better governance indirectly improves agricultural productivity.
The quality of a country’s institution determines how electricity among other necessary resources are allocated across the country especially when it promotes development.
1.2 Aim and delimitations
This thesis seeks to connect the dependence of agricultural output on rural electrification and how the interaction between a country’s institutional quality and electrification may affect agricultural output. This study will however not focus on using institutional quality as an instrumental variable which affects output through electrification. The emphasis of this thesis is on Sub-Saharan Africa where access to electricity is a problem. Hence the purpose of this study is to estimate the impact of electrification on agricultural output. I go ahead to estimate the effect of the interaction between electrification and institutions on agricultural output. On these grounds, the main hypothesis that captures the relationship described is defined as follows:
H1: Access to electricity does cause an increase in agricultural output. I consider a sub-hypothesis:
H1a: Conditional on quality institutions, access to electricity does cause an increase in agricultural output.
I test these hypotheses by using a fixed effect linear regression model and Fully Modified Ordinary Least Squares (FMOLS) to correct potential autocorrelation as a result of the long time period. This is applied to panel data for 45 Sub-Saharan African countries to test the effect of access of electrification and the interaction between electrification and institutional quality on agricultural output.
The benefits of agricultural output increase to individuals and the nation with the use of electricity are undeniable especially when related to the Sustainable Development Goals. Since agriculture employs an average of 54% of the working population in Africa1, agricultural output expansion will lead to higher employment levels. As the level of employment increases, this will, in turn, reduce the poverty levels in Africa since people will earn income. Given the current employment rate of the sector, a boost in the sector will imply that these employed are able to
1
either buy directly from the farm or with their income buy from the market to provide for their families. To a large extent, we gradually reach the end of the hunger road. This gives birth to industries that process these outputs and also bring about innovation. This will snowball into economic growth for these countries and provide decent work for the people. Countries will partner with other countries to agree on good terms of trade that work for both parties.
This study will thence contribute to the existing pool of knowledge policymakers need and will use when deciding on policies concerning agriculture and electricity in terms of resource allocation. It will also aim at promoting agricultural activities not only in rural areas but in urban areas as well. The results of this study will also show how a bumper agricultural output will help realize the Sustainable Development Goals.
1.3 Structure of the report
For the remaining sections of this thesis, the structure is as follows. In the next section, I review some existing literature and theoretical perspective on the topic. Section 3 explains the methodological approach and describes the data. Section 4 looks at the results and in section 5 I discuss the results. Finally, I conclude in Section 6.
2 Literature review
This section is concerned with how electrification and institutional quality have impacted agriculture over the years. I begin by exploring the different ways by which agricultural output is measured. I review some literature on the subject matter and identify gaps in the literature. Finally, I briefly discuss how this thesis will contribute to the existing literature.
2.1 How to measure agricultural output/productivity.
Agriculture is the cornerstone of the economy of many developing countries and most of these countries seek to increase their agricultural productivity by the use of infrastructure and energy. There is a vast difference between the way each country decides to realize this aim. This may be attributed to their governance style and or political priorities. To boost output in agriculture, countries tend to improve those factors that positively affect agriculture. Such factors include infrastructure, energy and governance style.
In developed countries like the U.S, Canada, and Western Europe, the use of land is optimized and have highly developed infrastructural setup. In the same vein, their irrigational system is extensive. This is however not the same in Africa and South Asia. Infrastructure in these areas is less extensive and farmers rely on weather changes. The focus of government in these less developed countries is directed towards the construction of roads and to improve access to potable water2.
Researchers and policy analysts over the years have been concerned with the measurement of agricultural output. Some of the studies done are concerned with the measurements of specific agricultural produce such as wheat, maize, rice and soybean. A report published by OECD-FAO, (2018) shows that agricultural crop output is measured by the types of crops. The report also measures output based on the availability of arable land.
Other studies use indicators to measure output. Khandker & Koolwal (2010) measure agricultural output in Bangladesh using agricultural indicators such as prices, wages, transport cost and labour employed and a measure for output in Bangladesh. Chen & Ding (2007) in their
study, used the total factor productivity for rice, wheat, beans, and maize as indicators to measure output. These indicators have been used to measure the effect of infrastructure on agricultural output.
2.2 Infrastructure
Infrastructure in agriculture has been the concern of many researchers. According to Patel (2010), the importance of agricultural infrastructure includes its role to encompass economic development of a country and not just development in agriculture.
Numerous components of infrastructure have been acknowledged by researchers. Among these, Patel (2010) groups them in four broad categories.
• Input-based infrastructure: seed, fertilizer, farm equipment and machinery etc • Resource-based infrastructure: Water/irrigation, Farm power/energy
• Physical infrastructure: road connectivity, transport, storage, processing, preservation etc
• Institutional infrastructure: agricultural research, extension and education technology, information and communication services, financial services, marketing etc.
These infrastructural services are of major importance in simulating agricultural investment and growth but they remain limited in most rural communities (FAO, 1996; Knox, Daccache, & Hess, 2013). A good infrastructure in place promotes development. In agriculture, to boost output, countries put in place the best form of infrastructure needed to achieve their aim. My thesis focuses on two main categories of infrastructure. The first is energy infrastructure, where I narrow down to electrification. I then include the significance of institutional infrastructure in agriculture. The following subsections review the literature on the impact of energy and institutional infrastructure on agricultural output.
2.2.1 Energy infrastructure and agricultural output
In most developing countries, agricultural activities take place in rural areas. These rural areas are the least developed places. In the quest to developing such countries, energy is used to yield productive results. Even in developed countries, they engage in productive uses of energy to sustain their development. The Global Environment Facility (GEF) and the UN Food and
Agricultural Organization define productive uses of energy in the context of providing modern energy services in rural areas, as “one that involves the application of energy derived mainly from renewable resources to create goods and/services either directly or indirectly for the production of income or value”. The traditional definition is focused on the direct use of energy to increase Gross Domestic Product (GDP) (Cabraal, Barnes, & Agarwal, 2005).
For various reasons, there are campaigns to promote energy use in rural areas mainly because its expected impact results in the realization of some of the Sustainable Development Goals (SDG). It is expected that the productive use of energy results in increased rural productivity, higher economic growth, increase in rural employment which will rise incomes and also reduce the migration of the rural poor to urban areas (Cabraal et al., 2005). Since agriculture is the major occupation in most developing and rural communities, productively using energy in rural agriculture will have some developmental effects.
In recent times, there have been a lot of studies conducted to capture the effect of energy on agricultural output. Bhatia (1985) explains the trends in energy use in agriculture in developing countries at the global, national and farm levels. His study focuses on agriculture as a consumer and producer of different forms of energy. Developing countries such as Nepal, India and Bangladesh increase their use of energy in agriculture. These countries increased their use of energy on their farms. He concludes that if additional output is to be obtained from the given land resources which are fixed, then the commercial energy intensity of agricultural production in developing countries must increase significantly.
Electricity as a form of energy is of great importance in rural development. It is considered the
activities (Das, 2008). He further shows a linkage between electricity and rural development.
Source: (Das, 2008)
Figure 1. Electricity and Rural Development Nexus.
Figure 1 shows the relationship between the single-most vital economic infrastructure, electricity and the various sectors of rural areas, namely, agriculture, enterprises, households and the community. This is a detailed picture of contemporary linkages between electricity and the rural economy of India. The diagram may not be exhaustive but could be extended to relate to other developing countries. The figure further shows which components of these sectors could be affected by electricity. In agriculture, Das (2008) identified irrigation, storage and processing as the components that use electricity to function. In addition, access to electrification at home can provide farm households sufficient time to work on their farms as household chores and tasks can be shifted to the evening.
As already indicated, studies on the effect of electrification on agricultural productivity in developing countries focus on several indicators of agricultural productivity and outputs. Some indicators considered include output prices, input prices, agricultural outputs, total factor productivity and share of agriculture in gross domestic product. Khandker & Koolwal, (2010) studied the effect of electricity infrastructure on the agricultural sector in Bangladesh. Agricultural indicators they considered are agricultural output, prices, wage, transport cost and
Electricity Agriculture Irrigation Storage Proceccing Enterprises Machinery Processing Heating Households Lighting/Fan TV/Music Computer Community Street lighting Schools/Hospitals Drinking water Business
labour employed in the agricultural sector. They find that electricity increases agricultural output, wages as well as the other indicators considered in their study.
Knox et al. (2013) did a systematic review of literature that principally focuses on rural electrification and its impact on agricultural productivity among others. The sample they targeted were the agricultural and rural communities including farming at the field, district and national level in developing countries. One of the interventions the various literature covered was infrastructural development which includes rural electricity supply. The outcomes of the studies covered areas on poverty reduction, agricultural wage, agricultural and rural GDP, agricultural productivity energy and agricultural input consumption among others. The method they used was a systematic review protocol they drafted3.
Their review included a study done in Bangladesh by Khandker & Koolwal (2010). Their results show that electrification led to a reduction in agricultural transportation and increased agricultural output prices. They also find that with greater electrification, it is possible to raise agricultural productivity which in turn improves output even though the effect was a weak one. With the combination of other investment in fixed capital, the effect of electrification on productivity in agriculture is sure to increase. Binswanger et al. (1993) studied the impact of electrification on investment in fixed capital (pumps) in India. They concluded that the effect was significant and it contributed to an increase in investment levels by 28%.
Interestingly, the effect of electrification on agricultural output and/productivity can vary across commodities and crops. The system of farming determines the electricity requirement of the farm. Another important factor to be considered is the geographical location of the crop. If the dominant farm is located in an area where there is access to electrification, the output will be inevitably small. Again, if the farm uses a modern intensive system of factory farming, it requires investments in machinery. The lack of reliable access to electricity will adversely affect productivity. On the other hand, a reliable supply of electricity can significantly reduce the cost of production and export (Chen & Ding, 2007; Limi & Smith, 2007).
In other studies in China, electricity investment produced lower returns in GDP in both agricultural and non-agricultural sectors (Fan, Zhang, & Zhang, 2002, 2004). Results from
Thailand showed that investment in electricity yields higher returns in agricultural productivity. The impacts of electricity, roads and education come from growth in agricultural employment productivity rather than increasing agricultural productivity. The expenditure of the Thai government on rural electricity has the greatest impacts on poverty reduction (Fan et al., 2004; Knox et al., 2013).
Electrification has been proven to be inevitable. It adds up to the criteria and standard a country needs to meet to be considered developed. Developing countries strive to sustain a stable supply of electricity. Assunção et al. (2017) tend to examine the “impressive growth” of electrification on technology use, change in production structure and yields in the rural sector in Brazil. They show that agricultural productivity in areas that faced low precipitation is able to increase because electricity gives way to investments in irrigation. This also results in farm expansion.
2.2.2 Institutional Infrastructure and agricultural output
The allocation of resources in an economy to a large extent depends on the ideology and preference of the government. Governance can be regarded as the traditions and institutions by which authority in a country is exercised (Kaufmann et al. 2005; Lio & Liu, 2008). Following Kaufmann et al. (2005) and Méon & Weill (2005), governance can be divided into three categories. The first category is referred to as the “respect for the institutional framework”. This has to do with the respect that citizens and the state have for the institutions that govern economic and social interactions among them. The second category is known as “the quality of government action”. It is the capacity of the government to effectively formulate and implement sound policies. The final category “selection of the authority” which is concerned with the process by which governments are selected, monitored and replaced (Lio & Liu, 2008).
Some of the challenges that surround rural electrification include inadequate policies, weak institutional frameworks and limited financing (Haanyika, 2006). According to Haanyika (2006), in order to overcome this challenge, marked-based reforms in the power sector have been introduced in the last decade and this has affected the institutional and financing arrangement for rural electrification. By this, Haanyika (2006) draws linkages between rural electrification and institutions. The author finds that the reforms have affected the rate and affordability of electricity. The evidence that a good governing body as the most essential tool of an economy is very clear.
Supportive policies and institutional infrastructure have brought forth more than double agricultural productivity since the 1960s in many regions of the world (Namara et al., 2010). Lio & Liu (2008) test the hypothesis that better governance fosters agricultural productivity. Their study examines a cross-national analysis of governance and agricultural productivity. They indicate that by driving agricultural capital accumulation, better governance can indirectly improve agricultural productivity. The government of a country is seen as the decision-making body for the country internally and internationally. A weak institutional figure stands the chance of being intimidated by the international community and hence the former may not be in the position to make firm choices for the country. This is normally the case of developing countries. Focus should be placed on improving the governance style of such countries. Some literature has argued that governance is a basic factor that explains the poor economic performances of various developing countries.
With the current spike in world population especially in developing countries, the demand for food is rising as a result. If more emphasis is placed on improving the institutional infrastructure of these countries, there is no doubt that agricultural performance will take a positive turn (Hayami & Ruttan, 1970; Lio & Liu, 2008). Deducing from Lio & Liu (2008), one of the two methods they employed in their research, was an aggregate production function estimated using panel data of 127 countries for the years 1998, 2000 and 2002. The empirical results they arrived at showed that given the same agricultural inputs, the same level of education, and the same climate condition, a country with better governance can generate more agricultural outputs. The outcome of the second method they used, a structural equation model, revealed that better governance brings about higher agricultural labour productivity. Other outcomes of their study support the claim that governance is a basic factor that explains the poor economic performance of many developing countries (Hazell & Herdt, 1987; Lio & Liu, 2008). Their findings also confirm the different levels of the economic success of a country is determined by institutions and government policies (Hall & Jones, 1997; Lio & Liu, 2008).
2.3 Literature gaps and contribution to literature.
Table 1 shows a summary of the result of related studies. Access to electricity did not have a significant effect on agricultural output in Bangladesh but it significantly decreased total factor productivity of beans in China (Chen & Ding, 2007; Khandker & Koolwal, 2010). Overall, electricity and institutions have had a positive significant impact on agricultural output and the productivity indicators considered in the literature.
Table 1: Summary of literature review.
Author Country Agric output/productivity indicator Infrastructure indicator Effect (Assunção et
al., 2017) Brazil Agric Productivity Electricity 0.107***
(Khandker &
Koolwal, 2010) Bangladesh Agric output
% of household with
electricity 0.151
Agric price % of household with electricity
0.057***
Agric transport costs % of household with electricity
0.43***
(Chen & Ding,
2007) China
Total Factor productivity of beans
Electricity consumption
per capita -0.132** (Fan & Zhang,
2004) China Agric output
Electricity per
machinery 0.115** (Binswanger et
al., 1993) India Crop price (International) Electricity 0.028* Crop price (Domestic) Electricity 0.031* (Mundlak, 2002) Thailand Agric GDP Electricity 0.045* (Lio & Liu, 2008) Agric Productivity Institutions 0.383***
*** p<0.01, ** p<0.05, * p<0.1
Although most previous studies are looking at the impact of electrification and institutions on agricultural output, very little has been on Sub-Saharan Africa (SSA). While there is a large literature estimating the effects of electrification in agriculture, credible estimates of the impact of electrification on agricultural output are sparse. Taking the different climate; temperature and rainfall, into account, the results of the studies done in other non-African developing countries cannot be extended in the Sub-Saharan context. Climate goes a long way to determine
the kind of output farms produce. It also determines the amount of agricultural output. This thesis takes into account how the climate differences across SSA affect agricultural output.
In relation to my second hypothesis, no study has been done so far to capture the effect of the interaction between electrification and institutional quality on agricultural output in SSA. There is a unanimous agreement that electrification does have an impact on agriculture. Electrification also plays a pivotal role in the development of a nation. However, if the institutional quality of the country is rather poor, they cannot realize their aim of high agricultural output and hence national development will not be sustained. For this reason, this thesis examines the effect of the interaction between electrification and institutional quality on agricultural output.
The amount of agricultural output across countries is not comparable in terms of the size of the countries, the size of arable land and the population employed in agriculture. To this reason, the general results of the effect on agricultural outcome cannot be used in explaining the cross-country differences in outcomes. For example, the outcome in Rwanda may not be comparable to the outcome in Nigeria. Rwanda is a relatively small country and size of arable land cannot be compared to that of Nigeria. The population employed in agriculture will be lesser than in Nigeria. To this end, this thesis also takes into account the impact of electrification on agricultural output per land and agricultural output per labour.
The aim is to add to the pool of already existing literature to aid in future research and assist in policy-making decisions.
3 Methodology
This section describes the theoretical model I adopt in this thesis, covers the conceptual model, the empirical model and describes the variables used in the model.
3.1 Theoretical framework and Empirical model
Using the production function approach, I draw the link between agricultural output and electrification. Following Adom et al., (2018), Barrios, Ouattara, & Strobl, (2008) and Kahsay & Hansen, (2016), I adapt the Cobb-Douglas production function where agricultural output is a function of labour, capital, land, electrification and other variables such as rainfall and temperature The equation is shown below:
𝑌 = 𝐴𝐿𝛼1𝐾𝛼2𝑁𝛼3𝐸𝛼4𝑇𝛼5𝑅𝛼6𝑒𝑥𝑝𝜃𝑡𝑖𝑚𝑒 (1)
Where (Y) is the agricultural sector output, (A) is a measure of knowledge accumulation, (L) denotes labour, (K) is the capital invested, (E) is the electrification rate, (N) land and (T) temperature (R) rainfall. Time trend to account for the natural increasing trend in output To estimate Equation (1), I linearize it by taking the natural log of the equation to get Equation (2). The new equation becomes the baseline production function that is shown below.
𝑙𝑛𝑌 = 𝛼0+ 𝛼1𝑙𝑛𝐿 + 𝛼2𝑙𝑛𝐾 + 𝛼3𝑙𝑛𝑁 + 𝛼4𝑙𝑛𝐸 + 𝛼5𝑙𝑛𝑇 + 𝛼6𝑙𝑛𝑅 + 𝜃𝑇𝑖𝑚𝑒 (2)
The coefficients of the log-transformed variables are elasticities. In addition to these variables, I include a variable which measures the quality of political institutions (INS). According to Lio & Liu (2008), political institution fosters agricultural productivity. Following Adom et al., (2018), Barrios et al., (2008) and Kahsay & Hansen, (2016), equation (2) is transformed into a baseline panel fixed effect model that will be estimated. Thus, I include a variable that captures country-specific time-invariant effects (𝜇𝑖) and time trend as a proxy to take into account the impact of technological change and a natural increasing trend in output (𝜃𝑇𝑖𝑚𝑒). Finally, an error term (𝜀𝑖𝑡) is introduced, which accounts for other unobserved variables which might explain the variable of interest. This resolves into a new econometric model as Equation (3):
𝑙𝑛𝑌𝑖𝑡 = 𝛼0+ 𝛼1𝑙𝑛𝐿𝑖𝑡+ 𝛼2𝑙𝑛𝐾𝑖𝑡+ 𝛼3𝑙𝑛𝑁𝑖𝑡+ 𝛼4𝑙𝑛𝐸𝑖𝑡−1+ 𝛼5𝑙𝑛𝑇𝑖𝑡 + 𝛼6𝑙𝑛𝑅𝑖𝑡+
In Equation (3), electrification and institution are included as lagged variables. The idea here is that access to electrification in the current period will have an impact on the next periods’ agricultural output. In the same vein, access to electrification in the previous period reveals its impact in the current period. The institutional quality of an economy determines how they allocate resources like electrification across the country. A stable country is expected to see a boost in their productivity in the next period. Such a country allocates resources (e.g. electrification) in one period and the results are experienced in the next. To this end, the model is estimated using the institutional quality as a lagged variable. Whiles the effect of electrification on agricultural sector output is inevitable, to some extent the effect of electrification is dependent on the quality of an institution of a country (Haanyika, 2006). As a result, I introduce an interactive term between electricity and institutional quality in Equation (4):
𝑙𝑛𝑌𝑖𝑡 = 𝛼0+ 𝛼1𝑙𝑛𝐿𝑖𝑡+ 𝛼2𝑙𝑛𝐾𝑖𝑡+ 𝛼3𝑙𝑛𝑁𝑖𝑡+ 𝛼4𝑙𝑛𝐸𝑖𝑡−1+ 𝛼5𝑙𝑛𝑇𝑖𝑡+ 𝛼6𝑙𝑛𝑅𝑖𝑡+
𝛼7𝑙𝑛𝑁𝑖𝑡−1 + 𝛼8𝐼𝑁𝑆𝑖𝑡−1∗ 𝑙𝑛𝐸𝑖𝑡−1+ 𝜇𝑖 + 𝜑𝑡+ 𝜀𝑖𝑡 (4)
Where 𝜇𝑖 is the variable that captures country-specific time-invariant effects and 𝜑𝑡 is the
time-varying effect common to all countries which capture factors such as technological progress From equation (4), the marginal effect of electrification on agricultural output is derived as;
𝜕 𝑙𝑛𝑌𝑖𝑡
𝜕𝑙𝑛𝐸𝑖𝑡−1 = 𝛼4+ 𝛼8𝐼𝑁𝑆𝑖𝑡−1 (5)
The quality of institutions reinforces the effect of electrification on agricultural output if 𝛼8 is positive. However, in the case where 𝛼8 is negative, it reduces the positive impact of electrification on agricultural output. The total effect of electrification on agricultural output will be the coefficient of the electrification (𝛼4) (when significant) if the interaction between electrification and institutional quality is not significant. However, when both electrification and its interactions with institutions are significant, the total effect of electrification on agricultural output is evaluated at the mean of institutional quality.
It is expected that land, labour, capital, electrification and institutional quality would increase agricultural output. On the other hand, the impact of the climate variables is not certain.
To estimate Equations (3) and (4) model, I make use of a Fixed Effects Panel estimator. However, fixed effect models may not be an appropriate estimation technique because of country-specific heterogeneities, the presence of serial correlation (due to long time period), and potential endogeneity problem associated with electrification. As a result, I also employ Fully Modified Ordinary Least Squares (FMOLS) model developed by Phillips & Hansen, (1990) to account for the potential serial correlation associated with the long time period and endogeneity. FMOLS is a semi-parametric model that is robust to endogeneity and serial correlation problems. Also, it provides consistent and efficient estimates even in the absence of cointegration relation (see Phillips, 1995). Although FMOLS addresses endogeneity, it difficult to tell which endogenous variable it addresses (for example, electrification). For this reason, using an ad-hoc Instrumental Variable technique within a panel setting is ideal. Hydro-potential can be used as an instrument for electrification. For a variable to be a valid instrument, it should be relevant and exclusive. In most SSA countries, electrification is hydro-based. As such an increase in hydro potential is likely to bring an increase in electrification and this satisfies the relevance assumption. Countries tap electricity from a hydro source, they use this medium to reach the maximum agricultural output. This satisfies the relevance assumption. Also, to satisfy the exclusion assumption, the effect of electrification on agricultural output should be as a result of the country’s hydro potential. It should be noted that there are two main factors that affect hydro potential; rainfall and the topography of the country. A country’s topography may be levelled such that their hydro potential is high but they may face long drought seasons, e.g., Botswana. Although this seems right theoretically, my estimations prove otherwise. Hydro potent did not satisfy the relevance assumption. In this thesis, I do not apply this instrumental variable approach. I will re-visit this approach in the future for future studies.
One other potential problem is the issue of outliers. The box plot figures under Figure 12 in the appendix show that the variables have outliers and as such using the log-transformed variables in the empirical model addresses the issue by normalising the variables.
3.2 Data and data sources
This thesis uses unbalanced panel data for 45 Sub-Saharan African countries for the period 1990-20164. São Tomé and Principe and Seychelles eventually drop out of the estimation because they have no data on institutions for the period of study.
Table 2 gives a description, sources and the expected signs of the variables used in this thesis. The outcome variable of interest is agricultural output measured as the gross agricultural output sourced from the World Bank Development Indicators (WDI). I measure output by the size of agricultural land. Due to the differences in the size of the various countries, the land allocated to agriculture also differ. For this reason, output in a small country (e.g. Togo) cannot be compared with the output in a large country like Nigeria. Output per land takes into account the agricultural output for specific countries. Likewise, output per labour is the output which is dependent on the number of people employed in rural agriculture. Just as the size of each country differs, the population also differs. It is expected that the population employed in agriculture is not even across countries. Hence, I measure output per labour.
In this production function approach, I consider the three traditional factors of production, land, capital and labour. Labour is the total number of people employed in the agricultural sector. This is the agricultural labour in the rural areas and it is sourced from the World Bank Development Indicators. It is anticipated that if there are more people employed by agriculture, output will increase. On the other hand, if the workload is divided among relatively fewer people, it will take a long time to achieve higher output. Adom et al. (2018) in their paper concluded that labour has a positive significant effect on agricultural production in Africa.
4 The countries include Angola, Benin, Botswana, Burkina Faso, Burundi, Cameroon, Cape
Verde, Central African Republic, Chad, Comoros Island, Republic of Congo, Côte d'Ivoire, Equatorial Guinea, Eritrea, Ethiopia, Gabon, The Gambia, Ghana, Guinea, Guinea-Bissau, Kenya, Lesotho, Liberia, Madagascar, Malawi, Mali, Mauritania, Mauritius, Mozambique, Namibia, Niger, Nigeria, Rwanda, São Tomé and Principe, Senegal, Seychelles, Sierra Leone, Somalia, South Africa, Sudan, Tanzania, Togo, Uganda, Zambia and Zimbabwe. The panel is unbalanced because observations are missing for some countries over some years.
Table 2: Definition of main variables and their data sources
(1) (2) (3) (4) (5)
VARIABLES Description Source Expected
sign
N Mean SD Min Max
Dependent variables
Agricultural output (Y)
Gross agricultural output WDI 1,027 3.87e+09 1.05e+10 1.68e+07 1.10e+11
Output per labour (Y/L)
Total agricultural output of a country given the number of those employed in rural agriculture
WDI 985 385.6 382.23 68.40 3,370
Output per land (Y/N)
Total agricultural output of a country given the size of their arable land in rural communities
WDI 1,006 62,095.74 167,598.7 716.5 1,827,939
Explanatory variables
Labour (L) The total rural population employed in agriculture WDI + 1,182 9.682e+06 1.525e+07 35,519 9.515e+07 Capital (K) Net capital stock in agriculture, forestry and fishery FAOSTAT + 946 3,237 7,087 6.060 64,172 Land (N) Total agricultural land measured in sq. km WDI + 1,210 193,538 219,121 15 981,250
Electrification (E)
Proportion of rural households that have access to grid electricity in the country
(Aklin, S. P., & Urpelainen,
2018)
+ 1,071 16.34 21.37 0.01 100
Polity2 (INS) Institutions measured as Democracy index between -10 and 10 Polity IV Project5 +/- 1,133 0.884 5.591 -10 10 Climate variables Temperature (T)
Mean annual temperature for each country in 0C WBCCKP6 +/- 1,231 24.74 3.169 12.63 29.54
Rainfall (R) Total annual rainfall for each country in 0C WBCCKP +/- 1,231 1,067 625.2 66.03 3,282
Source: Own computation and compilation
5 http://www.systemicpeace.org/polity/polity4.htm.
Capital is measured as the net capital stock in agriculture forestry and fishery by the physical
investment in the sector. I retrieve this variable from FAOSTAT. The amount and quality of capital invested in agriculture also determine how large or small the output will be. Good capital investment will facilitate agricultural output. The third variable, total agricultural land is measured in square kilometres and sourced from World Bank Development Indicators. As one of the factors of production, the size of land is expected to have a significant effect on output as it a primary necessity in agriculture. The bigger the size of the land, the more the agricultural output. However, land litigations in many parts of the continent may give rise to scarcity of land in the future and hence affecting the productivity and output in the agricultural sector (Adom et al., 2018).
I also control for institutional quality (Polity2) measured as a democracy index between -10 and 10 where -10 indicates the worst institutional quality and 10 is the best. In my estimations, I rescaled this index between 0 and 1 for ease of interpretation. Institutional quality involves is dependent on the style of governance. Good institutional quality implies a stable economy since the basic needs of the people are attended to. The mean value of the original institutional quality index as presented in Table 1 is 0.884 is rather an indication of the poor institutions in the region. Although there a few countries with relatively good institutions, the greater number of poor institutional quality-based countries overshadow the former and gives the impression that SSA countries have a pretty bad institutional quality. Recently, countries like Botswana, Ghana, Cabo Verde, Comoros and Mauritius are between 8 and 10, indicating relatively good institutions. However, countries such as Eritrea, Eswatini are -7 and -9 respectively.
The climate variables I control for are temperature and rainfall sourced from the World Bank Climate Change Knowledge Portal (WBCCKP). Climate is an important factor in agricultural productivity. There are some crops that only thrive or grow in certain regions because of the temperature and amount of rainfall. It should be noted that the different regions of SSA have different climates and hence the amount of rainfall and temperature varies across countries. Temperature is calculated as the annual mean in 0C for each country. It is calculated as an average because of its variations throughout the year. According to WBCCKP, the maximum
temperature for the region is 29.54 0C. Most SSA countries have warmer temperatures most of
the year. Rainfall is measured as the total amount of rain annually for each country. Too much rain causes flooding, in the same vein, high temperature causes drought and results in little or no agricultural output. Bad weather conditions cause agricultural output to decline but a good
combination of temperature and rainfall in their right proportions is a tool for agricultural output increase. Climate is, however, a natural occurrence and every country have its unique climate. This implies that agricultural productivity is also dependant on a country’s climate which also differs across the region. Rainfall and changes in temperature are not under the control of the farmers, they are risk variables.
The variable of interest in this thesis is electrification and its impact on agricultural output/productivity. Electrification is measured as the percentage of rural households with access to grid electricity as measured and indicated by Aklin, S. P., & Urpelainen, (2018). From the data, access to grid electricity is between 0.01 and 100 and on average, 16.34 rural households have access to electricity. Here again, since only a few rural communities (e.g. Mauritius and Cabo Verde) have between 60 and 99.7 access to electrification on average, the other countries lacking in rural electrification overshadow the former.
3.2.1 Relationship between dependent variables and rural electrification
Figures 2, 3 and 4 show the relationship between the means of the various dependent variables and the mean of rural electrification for SSA between 1990 and 2016 using the log transformed
values. These relationships are shown by a scatter plot, fitted linear lines and the LOWESS7
curve. From Figure 2, most of the countries have the lowest electrification; clustered between 0 and 20 per cent and their mean gross agricultural output is below 10,000 million8. Nigeria has the highest mean gross agricultural production but does not have a high mean percentage of rural household electrification. Mauritius has the highest mean of the rural household electrification percentage followed by Seychelles but their agricultural output is rather low. The fitted linear line in figure 2 shows a negative correlation between the natural log of gross agricultural output and the natural log of rural electrification, this is not the case for the LOWESS curve. The econometric results will throw more light on this relationship. Over the years, rural electrification and gross agricultural output have drastically increased in the whole of SSA. Figure 9 in the appendix gives an overview of the relationship between electrification, institutional quality and agricultural output. Panel A shows this effect over the period of study
7LOWESS (Locally Weighted Scatterplot Smoothing) generates a smooth line through a scatter plot to show the
relationship between variables and foresee trends.
whiles Panels B, C and D show the effect within a 10-year period. Within the first 10 years, agricultural output and institutional quality increased initially but however faced a drastic fall (Panel B). Panel C shows the trend from 2001 to 2010. During this period, agricultural output is steadily increasing whereas the institutional quality faced some shortcomings but also improved overall. Panel D shows the trend from 2011 to 2016 where both agricultural output and institutional quality are increasing.
Figure 2: Relationship between rural electrification and gross agricultural output.
Figure 3 shows the relationship between output per labour and electrification for each country. The average of the mean of output per labour is 313.23. Gabon has the largest mean at 2362.8
and Lesotho records the country with the lowest mean of the output per labour at 85.859. The
fitted line and the Lowess curve show a positive relationship though implying that electrification increases the efficiency of output per land. Figure 10 in the appendix shows that output per labour has been increasing over the years. Panel A shows this effect over the period of study whiles Panels B, C and D show the effect within a 10-year period. This is similar to Figure 9.
9 These figures are in anti-log.
LBR BFA CAFBDI TCD RWASLE NER MOZ GNB ETH GIN MWI TZA MRT LSO UGA MLI ZMB BEN KEN MDGSENZWE AGO NAMTGO BWA COG CPV GMB CMR SDN GHA CIV NGA COM GAB GNQ STP ZAF SYC MUS 16 18 20 22 24 ln (G ro s s a g ri c u lt u ra l o tp u t) (m e a n ) -2 0 2 4 6
ln(% of rural electrification) (mean)
(mean) lnY lowess lnY lnE Fitted values
Figure 3: Relationship between rural electrification and output per labour
Figure 4 also shows the relationship between output per land and rural electrification. Due to the differences in the sizes of the countries, their agricultural land is also not the same. Output per land is not comparable among countries due to the differences in land sizes. The LOWESS curve and the fitted line show that the relationship and the trend between the proportion of rural households with electrification and the mean output per land are increasing and there is a positive correlation and this implies that electrification increases the efficiency of output per land. Mauritius and Seychelles have the highest agricultural output recorded for the period of study. Figure 11 in the appendix, output per land has been increasing over the years. Panel A shows this effect over the period of study whiles Panels B, C and D show the effect within a 10-year period. This is similar to Figures 9 and 10. The econometric results give a clearer and more substantial conclusion.
LBR BFA CAF BDI TCD RWA SLE NER MOZ GNB
ETHGINMWI TZA MRT LSO UGA MLIZMB BEN KEN MDG SEN ZWE AGO NAM TGOBWA COG CPV GMB CMR SDN GHA CIV NGA COM GAB GNQ STP ZAF SYC MUS 4 5 6 7 8 ln (O u tp u t p e r la b o u r) (m e a n ) -2 0 2 4 6
ln(% rural electrification) (mean)
(mean) lnY_L lowess lnY_L lnE Fitted values
Figure 4: Relationship between rural electrification and output per land LBR BFA CAF BDI TCD RWA SLE NER MOZ GNBETH GIN MWI TZA MRT LSO UGA MLI ZMB BEN KEN MDG SEN ZWE AGO NAM TGO BWA COG CPV GMBCMR SDN GHA CIV NGA COM GAB GNQ STP ZAF SYC MUS 6 8 10 12 14 ln (O u tp u t p e r la n d ) (m e a n ) -2 0 2 4 6
ln(% rurl electrification) (mean)
(mean) lnY_N lowess lnY_N lnE Fitted values
4 Results
This section presents the econometric results using fixed effects and Fully Modified OLS (FMOLS). Section 4.1 shows the impact of electrification on agricultural output, output efficiency of labour and land. Section 4.2 shows the impact of the interaction between electrification and institutions on agricultural output. All the models are estimated by alternating the inclusion of capital in the final estimation because not all SSA countries have data on capital and hence the number of observations drops when capital is included in the model. In addition, the models are estimated with and without time trend. A pairwise correlation test among the independent variables is carried out to decide on which of them can be included in the model to avert the problem of multicollinearity. The correlation matrix in table 8 (see appendix) shows a weak correlation among the independent variables of interest, i.e. electrification and institution with other variables, hence multicollinearity is not an issue in the econometrics model. However, there is a strong correlation among the traditional factors of production; labour, capital and land. Given the long time period of the panel data used in this thesis, a panel unit root test is carried in Table 3 based on panel Augmented dickey fuller (ADF) and Phillip-Perron (PP) tests. Using both tests as a decision criterion, output, output per labour, output per land and capital are not stationary at level. As such, I used FMOLS in order to address the potential serial correlation.
Table 3: Unit root test
ADF Phillips-Perron
Inverse logit
Modified inv.
chi-squared Inverse logit
Modified inv. chi-squared LnY -5.709*** 6.463*** 4.583 -2.599 ΔLnY -43.31*** 71.84*** -55.40*** 93.79*** lnY_N -5.050*** 5.538*** 5.222 -2.834 ΔlnY_N -42.97*** 71.28*** -55.36*** 93.79*** lnY_L -8.986*** 11.575*** 0.4999 1.668 ΔlnY_L -41.68*** 68.895*** -52.95*** 89.38*** lnL -24.94*** 51.73*** -37.69*** 62.86*** lnN -9.86*** 12.98*** 0.024 2.300** lnK -5.218*** 5.898*** 4.735 -2.084 ΔlnK -29.50*** 46.90*** -28.737*** 45.583*** lnT -11.57*** 15.19*** -11.569*** 15.193*** lnR -39.42*** 64.64*** -39.418*** 64.641*** lnE_1 -32.85*** 54.24*** -32.847*** 54.242*** Ins_1 -16.63*** 27.33*** -16.627*** 27.331*** Elec_Ins -14.65*** 25.65*** -14.649*** 25.648***
*** p<0.01, ** p<0.05, * p<0.1
4.1 Electrification and agricultural output
The impact of electrification is estimated using the fixed effect models and the results are presented in Tables 4 and 5. The variables lnE_1 and lns_1 are the one lagged period of the log of electrification and one lagged period of institution respectively. The other explanatory variables expressed in logarithms imply that their coefficients are elasticities.
In Table 4, columns 1 and 2 present the effect of electrification and institutions on agricultural output. The difference between panel one and 2 is that I include a time trend in column 2 which proves significant. In both columns, the coefficients of the electrification variable are significant. The coefficient of the institutional variable is however not significant when I control for time trend in column 2. In columns 3 and 4 I include land, labour, temperature and rainfall as controls, with time trend in column 4. The coefficients of electrification are significant at 5 per cent in this case. We can say that a 10 per cent increase in access to rural electrification is bound to increase electrification by 6 per cent, according to column 3. The impact of institutions shown here is not significant in the complete models where I control for all the variables. This implies that the type of institutional quality does not affect output in agriculture. The availability of agricultural land is not significant as well. However, the availability of labour increases agricultural output. If the rural population increases by 10 per cent, agricultural output will increase by 7.8 per cent at a 5 per cent significant level. In column 4, it is the opposite but it is not significant from a statistical point of view. The availability of land is rather significant on agricultural output and the rural population has no significance on agricultural output. It is seen that climate significantly affects output positively. Given the type of weather in SSA, most of the crops thrive in warm weathers and raining seasons. A 10 per cent increase in temperature and rainfall will amount to 21.6 and a 1.4 per cent increase in agricultural output respectively. Climate is not significant when time trend is controlled for. Columns 5 and 6 controls for all the variables considered in the model including capital. Electrification, labour, land, temperature and capital significantly increase agricultural output. When the time trend is controlled for, only land is significant for growth in agricultural output. Over a long period, only the availability of land is important to increase output in agriculture.
Table 4:Electrification on agricultural output-Fixed Effect Model
(1) (2) (3) (4) (5) (6)
VARIABLES lnY lnY lnY lnY lnY lnY
lnE_1 0.141*** 0.053** 0.060** 0.044** 0.052** 0.036 (0.018) (0.021) (0.026) (0.021) (0.023) (0.022) Ins_1 0.304* 0.020 0.049 -0.008 -0.074 -0.083 (0.174) (0.118) (0.129) (0.109) (0.134) (0.138) lnL 0.784** 0.014 0.518* 0.087 (0.294) (0.345) (0.300) (0.355) lnN 0.679 0.702* 0.676* 0.679* (0.414) (0.381) (0.371) (0.372) lnT 2.163*** 0.317 1.733** 0.587 (0.784) (0.649) (0.720) (0.803) lnR 0.142** 0.065 0.076 0.058 (0.053) (0.054) (0.055) (0.059) lnK 0.161** 0.079 (0.063) (0.065) Timetrend 0.024*** 0.021*** 0.017** (0.004) (0.006) (0.007) Constant 20.655*** 20.595*** -6.595 11.072*** -1.702 8.985** (0.097) (0.088) (4.096) (3.772) (2.682) (3.994) Observations 869 869 849 849 692 692 R-squared 0.366 0.574 0.528 0.589 0.514 0.539 Number of countries 41 41 41 41 37 37
Country FE YES YES YES YES YES YES
Trend NO YES NO YES NO YES
Adjusted R-squared 0.365 0.573 0.525 0.586 0.509 0.533
Fstat_p 8.97e-10 6.43e-11 0 0 0 0
Robust standard errors in parentheses *** p<0.01, ** p<0.05, * p<0.
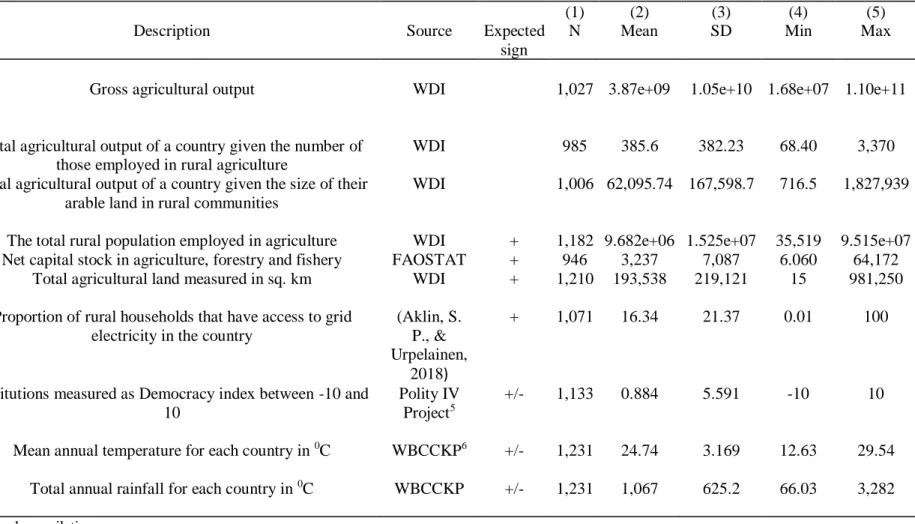
The effect of electrification and institutions on the efficiency of labour and land are presented in Table 5. Columns 1 to 6 show the impact on output per labour (lnY_L) and columns 7 to 12 show the impact on output per land (lnY_N). Just as in Table 4, the model is expanded to include more covariates. Columns 6 and 12 record the complete models for the two additional dependent variables. Electrification significantly increases agricultural output in all the scenarios except in the complete models (columns 6 and 12). Institutional quality does not have any significant impact on output. An increase in labour significantly decreases its efficiency of output. Land and capital however significantly increase labour efficiency of output. Land has no significant effect on its efficiency to output but it significantly increases the efficiency of labour. The availability of land affects labour efficiency significantly.
Table 5:Effect of electrification on labour and land efficiency-Fixed Effect Model
Output per labour Output per land
(1) (2) (3) (4) (5) (6) (7) (8) (9) (10) (11) (12)
VARIABLES lnY_L lnY_L lnY_L lnY_L lnY_L lnY_L lnY_N lnY_N lnY_N lnY_N lnY_N lnY_N
lnE_1 0.073*** 0.041* 0.060** 0.044** 0.052** 0.036 0.116*** 0.041** 0.060** 0.044** 0.052** 0.036 (0.021) (0.024) (0.026) (0.021) (0.023) (0.022) (0.016) (0.020) (0.026) (0.021) (0.023) (0.022) Ins_1 0.070 -0.034 0.049 -0.008 -0.074 -0.083 0.218 -0.022 0.049 -0.008 -0.074 -0.083 (0.154) (0.125) (0.129) (0.109) (0.134) (0.138) (0.151) (0.104) (0.129) (0.109) (0.134) (0.138) lnL -0.216 -0.986*** -0.482 -0.913** 0.784** 0.014 0.518* 0.087 (0.294) (0.345) (0.300) (0.355) (0.294) (0.345) (0.300) (0.355) lnN 0.679 0.702* 0.676* 0.679* -0.321 -0.298 -0.324 -0.321 (0.414) (0.381) (0.371) (0.372) (0.414) (0.381) (0.371) (0.372) lnT 2.163*** 0.317 1.733** 0.587 2.163*** 0.317 1.733** 0.587 (0.784) (0.649) (0.720) (0.803) (0.784) (0.649) (0.720) (0.803) lnR 0.142** 0.065 0.076 0.058 0.142** 0.065 0.076 0.058 (0.053) (0.054) (0.055) (0.059) (0.053) (0.054) (0.055) (0.059) lnK 0.161** 0.079 0.161** 0.079 (0.063) (0.065) (0.063) (0.065) Timetrend 0.009** 0.021*** 0.017** 0.021*** 0.021*** 0.017** (0.004) (0.006) (0.007) (0.004) (0.006) (0.007) Constant 5.563*** 5.541*** -6.595 11.072*** -1.702 8.985** 9.465*** 9.409*** -6.595 11.072*** -1.702 8.985** (0.090) (0.094) (4.096) (3.772) (2.682) (3.994) (0.087) (0.083) (4.096) (3.772) (2.682) (3.994) Observations 869 869 849 849 692 692 849 849 849 849 692 692 R-squared 0.147 0.196 0.190 0.294 0.210 0.250 0.300 0.489 0.420 0.495 0.416 0.445 No. countries 41 41 41 41 37 37 41 41 41 41 37 37
Country FE YES YES YES YES YES YES YES YES YES YES YES YES
Trend NO YES NO YES NO YES NO YES NO YES NO YES
Adj.R-squared 0.145 0.193 0.184 0.289 0.202 0.241 0.298 0.487 0.416 0.490 0.410 0.439
Fstat_p 0.00350 0.00391 0.000789 4.11e-05 0.000150 0.000141 1.61e-08 3.90e-09 1.04e-08 5.84e-11 1.60e-08 2.07e-08
When I control for time trend, the coefficient of labour is negative and significant in columns 4 and 6. This implies that, over time, the impact of labour on its productivity will reduce significantly. This negative effect which may not be surprising is basically due to the functional form used (Cobb-Douglas function) and it is explained by the diminishing marginal returns. In columns 9 and 11, labour seems to increase the productivity of land when time trend is not controlled for. When I control for time, labour has no significant effect on the efficiency of land. Over time, the rural population will divert from agriculture to other sectors thereby having no effect on land efficiency and reducing the efficiency of labour in agricultural output. Capital is rather significant in both efficiency cases when time trend is not controlled for. Climate is seen to be a significant factor in agricultural input efficiency with no time trends. When capital is controlled for, rainfall is not significant. This can be explained by the fact that irrigational systems (both traditional and modern) are also considered as capital in agriculture and hence water needed to increase agricultural output is already included capital and it is significant. It is interesting to note that comparing columns 3,4,5 and 6, to 9,10,11 and 12, the coefficients are the same with the exception of land and labour. These coefficients are also the same as the output models in Table 4. The reason for this is the inclusion of the respective input in their efficiency model within a Cobb-Douglas framework. Thus, the coefficient of labour and land in their efficiency model takes on a negative value to adjust the model within a Cobb-Douglas framework.
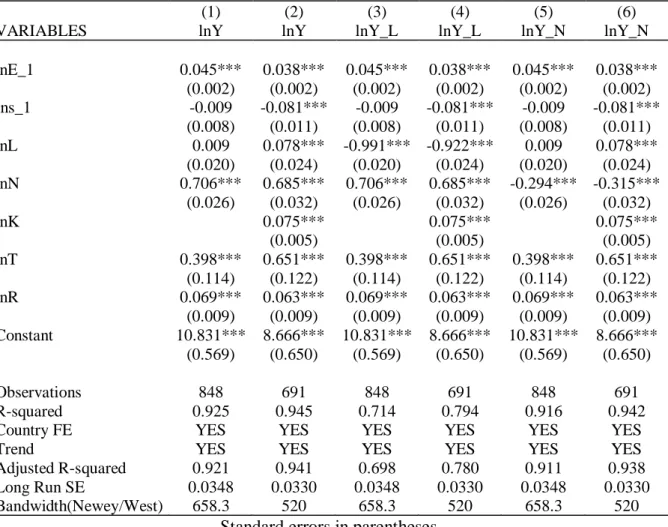
As a result of the long time period between 1990 and 2016, I use the Fully Modified OLS (FMOLS) to account for the potential serial correlation and endogeneity that may arise. The results of the FMOLS estimations are presented in Table 6. I only take into account the complete model with time trends and fixed effects. Since the models are estimated in logarithm, the results are expressed as elasticities. For each of the three models, i.e. output model, land and labour efficiency models, I provide two estimations, one with capital and the other without capital. In all the models, electrification coefficients are significant. Just as in the fixed effects models in Tables in 4 and 5, the coefficients of institutions are negative. It is only in the complete models, i.e. columns 2,4 and 6 that institutional quality adversely affects agricultural output negatively. If institutional quality improves, it will affect the other sectors of the country positively. Hence the focus will not only be on the agricultural sector. Labour reduces its productivity significantly, however, it increases output and land efficiency of output at a 10 per cent significance level. Land also significantly reduces its productivity but increases output and
productivity of labour. In this FMOLS model, capital causes a significant increase of 7 per cent in agricultural output when it is increased by 10 per cent.
The impact of climate is significantly positive. Apart from the coefficients of land and labour at their respective efficiency outputs, the other coefficients and their standard errors in the models with and without capital are the same. The long-run standard errors are relatively small in this model. It can be concluded that FMOLS minimizes the long run errors. The model also has a very good fit.
Table 6: Electrification on output and input efficiencies-Fully Modified OLS
(1) (2) (3) (4) (5) (6)
VARIABLES lnY lnY lnY_L lnY_L lnY_N lnY_N
lnE_1 0.045*** 0.038*** 0.045*** 0.038*** 0.045*** 0.038*** (0.002) (0.002) (0.002) (0.002) (0.002) (0.002) Ins_1 -0.009 -0.081*** -0.009 -0.081*** -0.009 -0.081*** (0.008) (0.011) (0.008) (0.011) (0.008) (0.011) lnL 0.009 0.078*** -0.991*** -0.922*** 0.009 0.078*** (0.020) (0.024) (0.020) (0.024) (0.020) (0.024) lnN 0.706*** 0.685*** 0.706*** 0.685*** -0.294*** -0.315*** (0.026) (0.032) (0.026) (0.032) (0.026) (0.032) lnK 0.075*** 0.075*** 0.075*** (0.005) (0.005) (0.005) lnT 0.398*** 0.651*** 0.398*** 0.651*** 0.398*** 0.651*** (0.114) (0.122) (0.114) (0.122) (0.114) (0.122) lnR 0.069*** 0.063*** 0.069*** 0.063*** 0.069*** 0.063*** (0.009) (0.009) (0.009) (0.009) (0.009) (0.009) Constant 10.831*** 8.666*** 10.831*** 8.666*** 10.831*** 8.666*** (0.569) (0.650) (0.569) (0.650) (0.569) (0.650) Observations 848 691 848 691 848 691 R-squared 0.925 0.945 0.714 0.794 0.916 0.942
Country FE YES YES YES YES YES YES
Trend YES YES YES YES YES YES
Adjusted R-squared 0.921 0.941 0.698 0.780 0.911 0.938 Long Run SE 0.0348 0.0330 0.0348 0.0330 0.0348 0.0330 Bandwidth(Newey/West) 658.3 520 658.3 520 658.3 520
Standard errors in parentheses *** p<0.01, ** p<0.05, * p<0.1
When the efficiency models are estimated without their respective inputs, the results change slightly. In Table 9 (see appendix), I estimated the FMOLS models for productivity of labour without controlling for labour and productivity of land without controlling for land. By estimating the productivity of labour, the coefficient of electrification reduces, the adverse impact of institutional quality increases, the positive effect of climate increases, the effect of