DF
Rock Mass Classification Systems in
Tunnels of Western Sweden
Bachelor’s thesis in Civil Engineering
ACEX10-19-31
Julius Detlofson
Nils Janestad
Alexander Kyriakidis
Axel Persson
Bachelor’s thesis 2019
Rock mass classification systems in tunnels of
Western Sweden
Comparing rock mass classification methods in underground railway
rock tunnels of Gothenburg
Julius Detlofson
Nils Janestad
Alexander Kyriakidis
Axel Persson
An analysis of how results drawn from different rock classification methods vary when compared analytically and numerically.
©2019
Supervisor: Eleni Gerolymatou, Department of Architecture and Civil Engineering Examiner: Minna Karstunen, Department of Architecture and Civil Engineering
Bachelor’s Thesis 2019
Department of Architecture and Civil Engineering Division of Geology and Geotechnics
Julius Detlofson, Nils Janestad, Alexander Kyriakidis, Axel Persson Chalmers University of Technology
SE-412 96 Gothenburg Telephone +46 76 819 4400
Cover: Drilling of blast holes, Västlänken, Göteborg. Photo: Nils Janestad, 2019. Typeset in LATEX, template by David Frisk
Printed by Chalmers Reproservice Gothenburg, Sweden 2019
Abstract
The project analyzes two rock mass classification systems, Q-system and RMR to find differences in anchoring recommendations. To compare the two systems, a rock mass from the underground railway tunnel Västlänken is classified independently according to the two systems, through the use of a number of drill cores. Resulting anchoring recommendations are compared directly, and investigated further in a fi-nite element computer model of the planned tunnel. This model allows safety factors from different reinforcement solutions to be compared to each other, and industry standard requirements. The results show that while the two systems speak in rela-tive unison in the average rock quality case, differences occur in the more extreme scenarios, where RMR generally gives better recommendations for both very poor and very good rock. In most of the boreholes, Q-system approximates rock quality as worse than RMR predictions. The results imply that RMR performs better than the Q-system, especially in the more extreme parts of the rock quality spectrum. Most importantly, the need for geotechnical user experience when interpreting rock mass classification systems is emphasized, particularly to find optimized anchoring solutions.
Acknowledgements
We would like to express our very great appreciation to our supervisor Eleni Geroly-matou for her invaluable advice and guidance throughout the entire project. Her willingness to lend a substantial amount of her time has been vital in completing this work.
Furthermore, we would like to extend our gratitude to Jörgen Halvarsson and other staff at NCC for enabling us to visit their project Västlänken, Korsvägen to observe parts of the rock tunnel as well as their daily operations. We would also like to thank Trafikverket for providing us with rock data from the Västlänken project. Lastly, Carina Hawke and Yommine Hjalmarsson have provided constructive and meaningful writing advice, for which we are thankful.
Contents
1 Introduction 1
1.1 Rock mass classification . . . 1
1.2 Purpose and scope . . . 2
2 Background 3 2.1 Infrastructure in Sweden . . . 3
2.1.1 Västlänken and the Haga station . . . 6
2.2 Stability in rock structures . . . 7
2.3 Classification of rock . . . 7
2.4 Reinforcement and support of rock mass . . . 8
3 Theory 9 3.1 Tunnel stability . . . 9
3.1.1 Gradual advancement . . . 9
3.1.2 Bolting . . . 9
3.1.3 Shotcrete and grouting . . . 10
3.1.4 Rock mass classification systems and anchoring . . . 11
3.2 Rock mass classification systems . . . 12
3.2.1 RMR . . . 13
3.2.2 Q-system . . . 15
3.2.3 GSI and the Hoek-Brown criterion . . . 16
3.2.4 Correlation between systems . . . 17
3.2.5 Advantages . . . 18 3.2.6 Disadvantages . . . 19 3.3 Numerical analysis . . . 20 3.3.1 RS2 . . . 20 4 Method 21 4.1 Method of comparison . . . 21 4.2 Data . . . 21 4.2.1 Rock quality . . . 21
4.2.2 Distribution of Q and RMR values . . . 23
4.2.3 Interpretation of boreholes . . . 25
4.2.4 Interpretation of results . . . 28
4.3 Numerical model . . . 29
Contents
4.3.2 Parameters and materials . . . 29
4.3.3 Staging . . . 30
4.3.4 Strength factor . . . 30
5 Results 31 5.1 Anchoring solutions . . . 31
5.2 Numerical analysis . . . 31
5.2.1 Average case scenario . . . 32
5.2.2 Best case scenario . . . 34
5.2.3 Worst case scenario . . . 36
5.3 Q-system and RMR correlation . . . 38
5.4 Site visit at Västlänken Korsvägen . . . 38
6 Discussion 41 6.1 Correlation of systems . . . 41
6.2 The RMR and Q-system . . . 41
6.2.1 Average case scenario . . . 41
6.2.2 Best case scenario . . . 41
6.2.3 Worst case scenario . . . 42
1
Introduction
1.1
Rock mass classification
When building or excavating underground some form of rock support or reinforce-ment is usually needed to ensure stability. When designing specific reinforcereinforce-ment for a rock mass, a useful guide is a Rock Mass Classification System (RMCS), of which two of the most commonly used ones are called Q-system and RMR. These systems are created by experienced industry professionals based on empirical data from representative cases in order to streamline the process of identifying the prop-erties of a rock mass. There are however several different classification models that each may weigh an input parameter in its own way. Some systems may even include factors which others do not. One study by Arild Palmström found that in many projects, only one RMCS is used, despite the system authors recommendation to use at least two in combination [1]. The study also found a significant variance in support recommended by classification systems, suggesting that depending on which system is used, the output rock anchoring may vary greatly.
A comparison of rock classification methods is therefore of interest and such is the aim with this study. The way of comparing these systems will be through classification of a rock mass using two different systems and drawing conclusions from the rock quality estimate, and resulting anchoring solutions. Anchoring solutions from both Q-system and RMR are applied to a numerical rock tunnel model to find resulting safety factors. The difference between these results will shed light on the usefulness of and discrepancies between RMR and the Q-system in this type of rock stability problem.
1. Introduction
1.2
Purpose and scope
The aim of this study is to compare two RMCS in order to draw conclusions about their individual and combined usefulness, in geological conditions representative of western Sweden. The thesis will build upon previous work on the subject by apply-ing two widely used RMCS in the ongoapply-ing underground railway project Västlänken. Shortcomings of these systems, if encountered, will be investigated and their recom-mended anchoring compared at face value, as well as through safety factors, gathered from a numerical analysis. The goal is thus to examine how well the RMCS work on their own, and in relation to each other.
This study will focus on one tunnel section, situated in rock. Eleven boreholes will be used to classify the rock. Because of this, the study is quite limited in scope, though the same method could be used for further study in the future, where implications of the results could be used for a basis of study. Focus will be on the classification systems themselves and thus ethical, economical and in most regards, even structural aspects of Västlänken will not be discussed. Effects of groundwater depletion and cohesive soils will not be part of the study.
2
Background
2.1
Infrastructure in Sweden
Sweden has been growing rapidly in different waves the last 20 years, mainly from immigration, combined with a slight increase of children born [2]. On top of that, the rate of urbanization has been increasing approximately in a linear way between the start and end of the 20th century. Today 85 percent of the population lives in an urban area as defined by Statistiska Centralbyrån, compared to 10 percent 200 years ago [3]. This has led to larger cities by population and today 24 of Sweden’s municipalities are regarded as densely populated cities by Eurostat [4]. There is a span from Gothenburg on the West coast to Stockholm on the East coast with high to intermediate density areas with only a small number of municipalities regarded as rural, see Figure 2.1. In comparison to other densely populated areas in Europe, Sweden’s stretch is covering a large distance coast to coast and here a need for well developed and reliable infrastructure is born.
2. Background
Degree of urbanisation for local administrative units level 2 (LAU2) (¹)
Guadeloupe (FR) 0 25 Martin ique (FR) 0 20 Guyane (FR) 0 100 Réun ion (FR) 0 20 Açores (PT) 0 50 Madeira (PT) 0 20 Canarias (ES ) 0 100 Malta 0 10 Liechtenstein 0 5 Mayotte (FR) 0 15 0 200 400 600 800 k m
Source: Eurostat, JRC an d European Com m ission Directorate-General for Region al Policy
(¹) Based on population grid from 2011 and LAU 2014. Denm ark, Greece an d Malta: local adm in istrative un its level 1 (LAU1).
Adm in istrative boun daries: © EuroGeog raphics © UN-FAO © Turkstat Cartog raphy: Eurostat — GIS CO, 05/2016
Cities
(Densely populated areas: at least 50 % of the population lives in urban centres)
Towns and suburbs
(Interm ediate density areas: less than 50 % of the population lives in rural g rid cells and less than 50 % of the population lives in urban centres)
Rural areas
(Thin ly populated areas: more than 50 % of the population lives in rural grid cells)
Data not available
2. Background
Figure 2.2: Government infrastructure investments in Sweden over time [5]
Every year the Swedish government invests money in the national infrastructure. The plan in place as of now is to invest 700 billion SEK between the years 2018 and 2029 [6]. As seen in Figure 2.2, the quota between national infrastructure investments and total expenses has been decreasing slightly since the mid nineties [5]. This trend is expected to reverse in the coming decade, as indicated by numbers from Regeringskansliet. With the large number of upcoming national infrastructure projects in mind, this forecast seems likely. Several new infrastructure and transport projects are planned, on going or recently completed in Sweden; Ostlänken in eastern Sweden, Västlänken in Gothenburg as part of Västsvenska paketet and Citybanan in Stockholm are some notable examples. All of these are fully or in part underground transportation systems[7][8]. Rock is usually both cheaper, easier and safer to build tunnels in than clay and in the examples mentioned above rock tunnels are more common than clay ones, as presented in Banverket’s cost estimates for Västlänken [9]. The lifespan of these structures is about 100 years, according to Mira Andersson Ovuka at Trafikverket, meaning service and stability of these constructions will remain important during this time. Hence stability in rock will be a major area of interest in all of Sweden in the both close and distant future.
2. Background
2.1.1
Västlänken and the Haga station
This study will focus on the Haga station, which is a part of the Västlänken project. Västlänken is an ongoing underground railway project reaching around Gothenburg’s city centre. The tunnel entrence will be east of the central station, with the first station planned in close proximity to the existing central station. The tunnel then extends west until it reaches Göta älv. It then makes a sharp south turn towards Haga, where the second station will be located underneath the church park. By Landala it turns east, running towards the last station at Korsvägen. Under Liseberg it continues and finally moves south towards the tunnel exit.
The plan is for the Haga station is to be constructed beneath the historical Haga church which is a landmark of cultural significance. Most of the station will be situated in hard rock with the exception of the station’s entrance facing the Rosen-lund canal. This study will focus specifically on hard rock by the northern station entryway, before the clay part at the canal, see Figure 2.3 [10].
2. Background
2.2
Stability in rock structures
Rock stability will be defined as mobilized shear resistance expressed as a safety factor relating to available shear resistance [12]. Stabilizing the rock is ensuring the rock does not collapse or deform to an extent where it is no longer serviceable. The main way of ensuring stability of constructions in good quality rock is through reinforcement. Swedish bedrock mostly consists of magmatic and metamorphic ma-terials which would be very stable if massive. Due to the old age of Swedish bedrock, the most challenging parameters are the joints and the size of the blocks, which can vary greatly even in small areas [9]. The objective of anchoring methods is reinforce-ment which enhances the already favourable structural properties of the material [13]. Anchoring is a method of reinforcement that is widely used when building in this kind of material, and when designing anchoring solutions some kind of rock classifications system is often used.
2.3
Classification of rock
Classification methods for rock mass such as RMR and Q-system are ways of drawing generalized conclusions on the characteristics of rock, without the need to perform extensive studies at each new site. The methods aim is instead to find general patterns over a large sample size in order to give a formula to approximate rock quality given a number of easily accessible parameters. These systems do however vary in usefulness and in unusual conditions may not be applicable. In some cases two systems could give surprisingly contrasting results [14]. The first attempt to streamline the tunneling process was made in 1879 by August Ritter, but Karl von Terzaghi was the first to use a rock classification system for tunnel construction in 1946. Terzaghi’s idea of what factors are important when approximating rock mass stability remains roughly the same in more modern systems [14].
The Rock Tunneling Quality Index, or Q-system, for rock classification was devel-oped in the 1974 by Barton, Lien and Lunde at the Norwegian Geotechnical Institute [14]. It is useful to help interpret properties of a rock mass. It was originally de-signed to help evaluating the need for support in tunnels and caverns of rock, but its use has expanded since its creation. In the late 1980s and early 1990s the system was built upon, simplified and included in new methods of tunneling, specifically the Norwegian method of tunneling. In 1999 QT BM is introduced, which aims to
estimate advancement rate of tunnel boring machines - a major expansion from the original design purpose of the system [15].
Rock Mass Rating (RMR) was developed in 1973 by Z.T Bieniawski but has as the Q-system since been built upon and tweaked in several ways [14]. RMR system was first based on empirical studies from civil engineering projects in rock. To be applicable in the mining industry the system was modified by D.H. Laubscher starting in 1977, with different parameter weighing than the original system [14]. Arild Palmström made a brief study on the topic of combining RMCS in 2009 [1]. This study criticized the wide use of RMCS correlation to translate a value
2. Background
found within the confines of one system, neglecting to find each value independently. It was recommended by Bieniawski to use at least two methods of classification in tunnel construction [16]. Palmström argues that the application of a common correlation is not sufficient use of two systems, and presents data from case studies in comparison with a linear correlation, where some cases deviate as much as 50 % from the correlation line [1]. The conclusion of the paper is that the use of correlation may lead to severely misleading results and the independent use of several systems will lead to better results. It also notes that a common source of error is user inexperience, hence geotechnical experience is recommended if not required when using RMCS and interpreting both input and output data.
2.4
Reinforcement and support of rock mass
There are mainly two kinds of tunnel stability measures in rock engineering, these being on the one hand reinforcement and on the other support. Reinforcement in rock works to improve the strength of the rock with anchoring bolts or cables into the rock mass. Bolts are applicable to a wide range of cases and has traditionally been used for temporary support both in mining and in tunneling, they are also increasingly used to stabilize slopes and cliff faces. The installed bolts and cables can be tensioned or grouted upon installation depending on if it is a permanent or temporary reinforcement. In order to be suitable for reinforcement the rock mass needs to be of high frictional strength for the installed bolts or cables to give sufficient support. If the rock mass is weaker and more cohesive than frictional, reinforcement is seen as inefficient and may not work at all. Such rock should instead be supported, where support works as a structure that bears the load of the tunnel to prevent it from collapsing due to the pressure from the rock or soil surrounding the tunnel. Simultaneously, support is not generally installed in high quality rock, such as is present at the Haga station [14].
Grouting is a way of strengthening rock joints and preventing water inflow by in-jection of concrete that fills up joints and cracks as well as working as an anchoring mechanism for a bolt or cable fastened into a borehole. The bolt or cable can be of permanent or temporary construction, typically needing replacement every 10 years. When grouting is used the need to minimize the contact between the anchored bolt or cable and the surroundings is of great importance to prevent it from corrosion and weakening of the reinforcement [14].
3
Theory
3.1
Tunnel stability
Stability of tunnels concerns the risk of material falling or sliding from ceiling and walls. In jointed rock, it is connected to the occurrence and orientation of fault planes in surrounding rock and, where such planes intersect to form blocks, to the load-bearing capacity of their joints. Whether or not the rock is jointed, its capacity will depend on the type of rock and preexisting internal stresses. The roof of the tunnel will be the most critical part because of rock fall as a result of gravity. This means the roof requires higher factors of safety than the tunnel floor and sides. [14]
3.1.1
Gradual advancement
When tunneling through rock, bolting and grouting is gradually installed. The dis-tance excavated before reinforcement is implemented depends on rock quality, with good quality rock allowing for greater distance. It generally follows that after two tunnel diameters of advancement, the rock has reached full unloading. Furthermore, at the tunnel face, approximately a third of the total stress has been unloaded, which is an assumption made in this study [14].
3.1.2
Bolting
Bolting works by creating tension in the cable or bolt that is inserted into a pre-drilled hole in the rock, creating friction between the rock mass and the cable. Bolts and cables have to be post-tensioned because of the relaxation of the cable [17]. Bolting is usually not considered a long term solution, as the lifespan of a bolt is commonly said to be 5-10 years, meaning they have to be replaced quite frequently [14]. Bolting is still widely used and considered one of the most effective and eco-nomic methods for rock mass reinforcement [18]. The spacing between individual bolts is important to overall stability and can be obtained using charts developed for Q-system and RMR. The charts attempt to conclude the necessary bolt spacing and bolt length based on the quality of the rock [14].
3. Theory
3.1.3
Shotcrete and grouting
Shotcrete is an umbrella term for cements, fine aggregate concretes and sand mix-tures that are applied under high pressure to the inner lining of a tunnel. Shotcrete can provide effective support against falling rock masses as well as water inflow and is often combined with steel fibre reinforcement to increase the strength of the shotcrete. The thickness of the shotcrete layer varies depending on the required strength factors [14].
Application of shotcrete to the inner tunnel surface is done either by a high pressure hose or by the method of grouting. Grouting is a way of applying the concrete by injecting it into joints in the rock mass and filling up the cracks so that the joint is fully filled and sealed. The most common application is installing rock bolts into the rock mass and then covering the outside of the tunnel by steel fibre reinforcement that is covered with a layer of shotcrete of varying thickness [14].
3. Theory
3.1.4
Rock mass classification systems and anchoring
A way of finding sufficient anchoring is through rock classification systems [14]. As mentioned above these systems aim to approximate rock quality to output a complete reinforcement solution depending of quality class. Given a quality class, reinforcement type is found through the logarithmic chart in the Q-system, Figure 3.1. Necessary shotcrete thickness, bolt length, bolt spacing, steel ribs and tunnel lining are obtained as output.
3. Theory
In the RMR system, sufficient reinforcement for a given RMR value is instead found in the "RMR classification guide for excavation and support in rock tunnels" Figure 3.2. How RMR and Q-system values are obtained is presented in Sections 3.2.1 and 3.2.2 respectively.
Figure 3.2: RMR output table [20]
3.2
Rock mass classification systems
There are several ways of determining the properties of rock. Different classification systems exist and the two most common are the Barton et al’s Q-system, 1976 and Bieniawski’s RMR, 1989. Investigations in this report will include both of these systems. Parameters used in both of them are similar and in some cases identical but their weighing differs somewhat. The two systems are based on Rock Quality Designation (RQD), which is a measurement of how fragmented a rock mass is, but they differ in some regards. In these systems, the parameters are gathered through
3. Theory
3.2.1
RMR
Rock Mass Rating is in essence an addition of six parameters with varying weighing that together form a number indicating the quality of a rock mass. See Figure 3.3 for RMR table.
RM R = R1 + R2 + R3 + R4 + R5 + R6
The six parameters are as follows, from R1 through R6. • Uniaxial compressive strength of rock material • Rock quality designation (RQD)
• Spacing of discontinuities • Condition of discontinuities • Groundwater conditions • Orientation of discontinuities
After the mentioned parameters are added a value 10>RMR>100 is obtained, where the structural qualities of the rock mass improve with higher numbers. The param-eter that has the highest weighing is the condition of discontinuities, thus joint quality affects RMR the most. Planned use of the rock is taken into consideration in "Orientation of discontinuties" where different intended uses give different values. See Figure 3.3 for the table used to find R1 through R6 and the final RMR value [16].
3. Theory
3. Theory
3.2.2
Q-system
The Q system for assessing rock quality was developed at the Norwegian Geotech-nical Institute and introduced in 1974 by Barton, Lien and Lunde. Compared to earlier classification models, it attempts to simplify and generalize the assessment process of rock quality [15]. It varies on a logarithmic scale 0,001 < Q < 1000 where Q is given by: Q = RQD J n ∗ J r J a∗ J w SRF
• Rock Quality Designation RQD • Joint set number Jn
• Joint roughness Jr • Joint alteration Ja
• Joint water reduction factor Jw • Stress reduction factor SRF
The factors create three quotients representing different rock properties:
Rock Quality Designation (RQD) along with Jn represents the structure of rock mass. This is an estimated measure of the block and particle size.
Jr and Ja describes the roughness and frictional characteristics of the joints as well as the material that fills them.
The third factor consists of the parameters Jw and SRF where the latter is a stress reduction factor describing relief of pressure in clay bearing rock. Jw on the other hand is the measurement of water pressure that decreases the shear strength in the joints as a result of reduced effective normal stress. Intended use of the rock mass is considered only when the Q-value is used with the chart shown in Figure 3.1, where the y axis is a quotient:
y = Maximum span or wall height ESR
ESR is here a factor dependant on intended use. This is a notable difference from the RMR system where intended use is taken into consideration in the classification value itself.
When all parameters are known the Q-value can be calculated. The parameter with the most influence on the results is SRF. The orientation of the joints is not included. The reason for this is that the orientation is assumed to be accounted for during the early stages of the project, which is the biggest differences between RMR-classification and Q-system [22].
3. Theory
3.2.3
GSI and the Hoek-Brown criterion
The Geological Strength Index (GSI) is practical when the rocks have discontinuities. The system uses two main components, namely the rock structure and the block surface conditions. Evert Hoek states: "It is a very simple chart which is to be used by geologists to define the character of the rock as a number" [23].
GSI can not be used for intact rock or sparsely jointed rock. It can also not be used for transported or broken materials such as rock fills, gravel, sand, clay and such. GSI is based on the generalized Hoek-Brown and Mohr-Coulomb failure criteria and lets visual information from the field be implemented in the generalised Hoek-Brown criterion equation. Based on the apparent blockiness of the rock and discontinuity surface conditions the combined characteristics will give a number that describes the overall quality of the rock [24].
However, since the axis in the chart-table is descriptive it is difficult for inexperi-enced engineers, geologists and laymen to give a good estimate, often resulting in unrealistic GSI values. This can cause major issues later on, in both the construction phase as well as during service and use of the completed structure.
After a GSI value has been obtained it is used in the generalized Hoek-Brown crite-rion. The criterion and its constituent parts are defined as follows:
σ01 = σ30 + σci0 ∗ (mb σ30 σ0ci + s) a (3.1) mb = mi∗ e( GSI−100 28−14D) (3.2) s = e(GSI−1009−3D ) (3.3) a = 1 2 + 1 6(e −GSI/15− e−20/3 ) (3.4)
The parameter s spans between 0 and 1 for completely fractured rock to completely unjointed rock respectively. mb is usually larger and is calculated according to
Equation (3.2) where mi is the ratio of uniaxial compressive to uniaxial tensile
strength[25]. D is the diameter of the tunnel. These GSI parameters will be used in computer modelling of the tunnel. The following figure is the Hoek-Brown criterion plotted with different mb.
3. Theory
Figure 3.4: Hoek-Brown criterion with worst to best case of mb.
3.2.4
Correlation between systems
An extensive study was made in Iran in 2012 at over 800 stations and 14 different sites, where RMR and Q values were determined separately and then compared with different statistical methods to find the best way to relate the two systems. The correlation coefficient was used to find the closest relationship between values of Q and RMR. The conclusion was that the best coefficient of correlation was found to be 0.866, which is less than a 15% difference from the independently determined values. The relation was found to be the following [26]:
RM R = 42.87Q0.162
This correlation will be used to translate Q-system values to RMR in a visual com-parison of how the values vary with depth. The comcom-parison will not be one to one perfect, but acceptable for a visual presentation.
A combination of many case studies show the correlation of Q-system and RMR below. Noteworthy is how deviant some outliers are, deviating more than 50 % in some cases. Between GEOM. CASE STUDIES with Q-values of 1 the difference is especially large, see Figure 3.5. A similar graphing of the studied boreholes will be done in this project.
3. Theory
Figure 3.5: Correlation of Q-system and RMR values [27]
3.2.5
Advantages
The rock classification systems can give a good indication on what support is rea-sonable for the application in question without a detailed numerical analysis. Since numerical analyses are also based on observations and assumptions, results obtained from these should not be seen as inherently more accurate than those gained from using a RMCS.
In a field such as geotechnincs, where the full picture is seldom known, it is im-portant to gather a good basis on which to base further calculations. Both Hoek and Terzaghi mentions that younger generations often lack the understanding of geotechnical assumptions and their nature. RMCS are not precise nor meant to be. These systems are however a great way to pass on the previous generation’s empir-ical studies to give novice engineers a nod in the right direction when interpreting rock mass quality [14].
3. Theory
3.2.6
Disadvantages
The article "Use and misuse of rock classification systems" by Palmström and Broch, published in 2006, presents an extensive critique of the shortcomings of rock classi-fication systems. Especially the Q-system is analyzed, though parallels are drawn to other commonly used systems as well. Each input parameter of the Q-system is discussed and the essence of the criticism is as follows [15]:
• Shortcomings of RQD being a one-dimensional measurement and only covering a part of the jointing range.
• Joint set number, Jn, leaves room for different interpretations of joint set numbers. Directions on how joints created by blasting should be included in the parameter are missing.
• Inter-block shear strength, Jr/Ja. In practice it is not an easy task to assess if a jointed rock mass will have wall contact after a very small shear.
• The effect of groundwater conditions, Jw, is too simplified and several factors are not taken into account, such as: Effect of rock permeability, alternative support when shotcrete is inappropriate due to high inflow, the effect of water on joint filling properties. Joint aperture does effect ground water flow, though this is not taken into account.
• SFR is seen by the authors of the article as a means of "fine tuning" the system rather than what it is described as, namely a stress reduction factor.
ESR, the factor that weighs intended use is discussed and its small influence on the final anchorage solutions of a tunnel is mentioned. For example, the difference in support between an underground power station and a water tunnel is 2 cm of shotcrete thickness, from 14 to 12 centimeters when all other factors are constant [15]. Bolting frequency, material and bolt length are equal in both cases. If this is enough of a difference is questioned. It is however acknowledged that ESR may vary in different countries to satisfy national safety factor requirements [15]. Criticism of some input parameters are applicable to RMR as well, since several are identical, Palmström and Broch points out.
The choice to leave joint orientation out of the equation is a main difference between Q-system and other systems of classification. This decision was made with the assumption that disadvantageous orientations has been avoided. When this is not the case, which is often [15], the system lacks a vital factor. Joint size is also missing, despite being an essential parameter in rock mass evaluation.
3. Theory
3.3
Numerical analysis
Iterative analysis of rock mass by finite, boundary and discrete element methods has become endemic to the field of rock mechanics [14]. The field of rock mechanics has long used analytical methods to evaluate rock mass properties, and is still in some sense doing so. Today advanced computer programs based on finite element methods are used in order to calculate strength components and tension of tunnel sections. However, the calculations are necessarily based on the input parameters and are therefore only as good as the data. This can be one of the reasons why the geotechnical field has taken so long to adopt computer programs to calculate load distribution and strength of rock masses. Design of tunnels such as Västlänken entails making several different computer models from the worst to the best case and everything in between, these are then improved as the tunnel advances, and the model with the greatest similarity to the real rock is used. This way the computer model is adjusted to reality and can therefore be used as representative model.
3.3.1
RS2
The numerical software program that has been used is Rocscience RS2, a 2D finite element program for slope and tunnel applications. RS2 uses mesh grids to calculate given geometry and presents coloured plots for a number of parameters. Different materials are defined by strength factors and given parameters such as elasticity and compressive strength. Different failure criteria are defined such as Mohr Coulomb, Hoek-Brown amongst others. When calculating a safety factor, RS2 divides the rock strength, based on the chosen failure criterion, by the induced stress at each point in the mesh [20].
4
Method
4.1
Method of comparison
In order to draw conclusions about the RMCS, a method of comparison was devel-oped for this study. A rock mass will be classified independently with two different RMCS, Q-system and RMR. Data from different boreholes in a representative area for the Haga station is combined and mean, minimum and maximum values are analyzed. These are then input into the chart/table for the two systems, giving six different anchoring solutions: best, worst and average scenario for both Q-system and RMR. These results can be analyzed at this point, showing potential differences in anchoring output. To judge how well they perform and not only how similarly, a numerical model made in the software RS2 is introduced. This model will sim-ulate the tunnel based on GSI data corresponding to the worst, best and average scenario. In this model, suggested anchoring can be input, giving safety factors for each case and system. These safety factors can then be put in relation to each other, and industry standards and the RMCS performance can be evaluated RS2 outputs a strength factor as ratio of Hoek-Brown rock strength to induced stress, which was considered comparable to equilibrium-based safety factors such as gen-erally employed in design and analysis. Following review of case studies made by enthusiasts of the Hoek-Brown criterion, it was decided that factors of 2 for the roof section and 1.5 for the sides and floor would be considered acceptable[14].
Additionally the quality class output by boreholes in the area can be plotted on a RMR - Q system chart where the axes are quality class in each system from low to high. If a deviation from a linear relationship is found, further discussion on whether or not these systems tell the same story can follow.
4.2
Data
4.2.1
Rock quality
Borehole data from Trafikverket provided the RMCS values used in this investiga-tion. In order to select the most representative values for each system, the boreholes were marked onto a map showing the location of Haga Station underground, see Fig-ure 4.4. Boreholes 601, 602 and 603 were deemed most relevant due their proximity to the section of study. These boreholes are referred to as the main boreholes. Other boreholes lay outside the immediate station area but were still of relevance due to the additional amount of data and control of outlier values.
4. Method
4. Method
4.2.2
Distribution of Q and RMR values
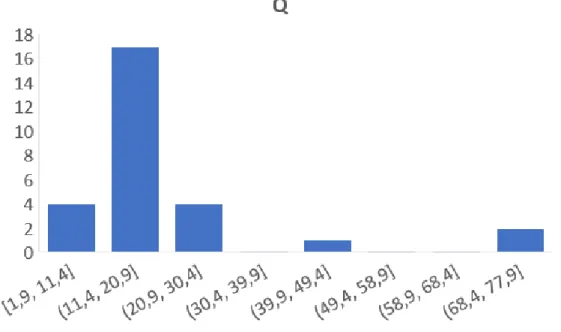
Figure 4.2: Distribution of Q for main cores.
Based on Figure 4.2, showing a histogram distribution of Q-system values of the main boreholes, a representative Q-system average would likely lie between 1.9 and 30.4.
Figure 4.3: Distribution of RMR for main cores.
Figure 4.3 shows the average RMR value for the main boreholes to lie in the span of 76 and 87.
4. Method
Map of all used boreholes
4. Method
4.2.3
Interpretation of boreholes
Figure 4.5: Q values for all cores, average connected
Figure 4.5 shows Q for all cores by depth, supporting an average of 24. For worst-and best-case scenarios, Q was estimated at 2 worst-and 89 respectively.
4. Method
Figure 4.6: RMR values for all cores, average connected
Figure 4.6, showing RMR by depth for all boreholes, for worst- and best-case sce-narios, RMR then becomes 35 and 97 respectively with an average value at 76. Because GSI values for each level were obtained by subtracting 5 from RMR, the worst, average- and best case values were selected accordingly as 30, 71 and 92.
4. Method
Mean values by depth
Figure 4.7: Mean values for RMR, Q-system and Q-system converted to RMR
The roof of the tunnel is going to be the most critical part of the section, and therefore the baseline Q-system and RMR values should correspond to the values found here. Figure 4.7 shows the mean value for RMR and Q-system values as well as the Q-system values converted to RMR. The tunnel section is marked with a black line on top of the figures. The translation of Q values to RMR through an empirically found correlation mentioned in 3.2.4 makes Q-system directly comparable to RMR in figure 4.7, which not the case otherwise, with Q-system being logarithmic.
4. Method
4.2.4
Interpretation of results
Comparing the three colour plots in Figure 4.7 with the values from the scatter plots in Figures 4.5 and 4.6, the visual confirmation can be made to confirm the chosen values for the minimum, average and maximum are of the right characteristic. Table 4.2 shows s and mb as determined by Equations 3.3 and 3.2 using the GSI
values of Table 4.1. These were used in the numerical model to approximate rock quality. Their relationship follows from Equation 3.1 in the Section 3.2.3 "GSI and the Hoek-Brown criteria". The Q and RMR values are used in their respective tables and charts that are presented in the Theory chapter, and output rock anchoring is presented in the Results.
System Min value Average value Max value
Q-system 2 24 89
RMR 35 76 97
GSI 30 71 92
Table 4.1: Minimum, average and maximum value for Q-system, RMR and GSI
Q- system Min value Average value Max value
GSI 30 71 92
s 0,00032 0,036 0,4
mb 1,7 7,7 17
4. Method
4.3
Numerical model
4.3.1
Rock properties
The properties of the gneiss encountered under Haga during site investigations were previously determined. The average Young’s modulus of elasticity of 70 GPa was reduced by three orders of magnitude to 70 MPa to account for scale effects. The average uniaxial compression strength of 130 MPa was used and Poisson’s ratio was set to 0.25. The Hoek-Brown rock strength properties for the best, worst and average case scenarios were determined using the respective GSI value, equation 3.1 for both RMR and Q systems.
4.3.2
Parameters and materials
The rock was represented by a homogeneous, unjointed, elastic-perfectly plastic material carrying the relevant material properties. A crown tunnel, 15 metres wide and 5 metres high was assumed to represent the tunnel section. A field of rock was drawn up to surround the tunnel to four times its width and height on flanks and below, so that the boundary conditions would not affect the calculations. For each classification system and case, the given support solution was implemented and a strength factor plot attained through application of the Hoek-Brown failure criterion. Material properties of rock bolts, shotcrete and other supports were the same in each case, whereas their dimensions and installation varied according to case. The principal stresses had been measured by Trafikverket at depths of 21 and 48 metres. Based on these measurements, in-plane and out-of-plane horizontal stress ratios were established and an in situ stress field attained. While measurements suggest an inclined stress field, in situ stresses were represented as strictly parallel or orthogonal to the tunnel axis in order not to complicate calculations or interpretation of plotted results. Figure 4.8 shows approximate in situ stresses at the level of the tunnel.
4. Method
4.3.3
Staging
In order to make rock bolts resist displacement and thus carry load, it is necessary to install them before the rock has displaced fully [15], meaning that a gradual advance must be simulated. This was accomplished by the use of an intermediate step between the excavation and the support steps, where the Young’s modulus of the tunnel space was lowered by one third and support was installed. Following this, the excavation of the tunnel space allowed full displacement to occur.
4.3.4
Strength factor
RS2 outputs a strength factor as ratio of Hoek-Brown rock strength to induced stress, which was considered comparable to equilibrium-based safety factors such as generally employed in design and analysis. Following review of case studies made by enthusiasts of the Hoek-Brown criterion, it was decided that factors of 2 for the roof section and 1.5 for the sides and floor would be considered acceptable [14].
5
Results
5.1
Anchoring solutions
From the data the recommended anchoring from the RMR and Q-system is pre-sented in table 5.1.
System Value Bolt length [m]
Bolt spac-ing [m]
Shotcrete
[cm] Other
Minimum 4 1.9 6-9 Fibre reinf. sfr
Q Average 4 2.6 5-6 Fibre reinf. sfr
Maximum 4 4 - Spot bolt.
Minimum 4-5 1-1.5
10-15 crown/10 sides
Wire mesh + steel ribs 1,5 m spacing
RMR Average 3 1.5-2 5 crown if
required. Wire mesh if required.
Maximum - - - Spot bolt. if required.
Table 5.1: Recommended rock reinforcement for the Q-system and RMR including
minimum, average and maximum
5.2
Numerical analysis
Models representative of the worst, average and the best case are simulated in RS2 with the recommended reinforcement for Q-system and RMR, found in Table 5.1.
5. Results
5.2.1
Average case scenario
Unreinforced
Figure 5.1: Unreinforced average scenario
5. Results
Q-system reinforced
Figure 5.3: Q-system reinforced, average scenario
Interpreting the results
In the average case, the rock is of fairly high quality, with strength factors of 1.6 in the floor and roof, and higher factors in the sides. The RMR solution generally secures safety factors around 3 in the tunnel crown, but in two spots in the roof, strength factors of 1.4 are present, which does not meet industry requirements of 2. The sides are very secure, reaching factors of 5. In the Q solution, the roof is more uniformly reinforced, and all factors of strength are around 3, approaching 4. The sides suffer instead with factors of 1.4 - this is however more acceptable as safety factor design requirements in tunnel sides are commonly set to be 1.5-1.7. Both solutions are close to acceptable, and would be with small improvements.
5. Results
5.2.2
Best case scenario
Unreinforced
Figure 5.4: Unreinforced, best scenario
5. Results
Q-system reinforced
Figure 5.6: Q-system reinforced, best scenario
Interpreting the results
As can be seen in figure 5.4, RS2 translates the best case parameters into a very strong rock mass, with the strength factor approaching 2 only in the corners where the idealized 90 degree causes an unrealistic stress concentra-tion angle. This suggests that no reinforcement is necessary. Figures 5.5 and 5.6 show that while Q-system recommends systematic rock bolting that does result in an increase in strength factor, RMR’s confidence in the rock quality is seemingly justified as strength factors remain solid without reinforcement.
5. Results
5.2.3
Worst case scenario
Unreinforced
Figure 5.7: Unreinforced, worst scenario
5. Results
Q-system reinforced
Figure 5.9: Q-system reinforced, worst scenario
Interpreting the results
In the worst case scenario, strength factors below 1 are present in the tunnel, indicating that the structure is unstable. As mentioned above, sharp edges exaggerate the strength factor in the corners. RMR anchoring succeeds in barely securing strength factors above 1 in the floor and sides, which is still lower than acceptable. In the roof however, safety factors are around 2, which is considered good. The Q-system solution fails to secure the sides, giving factors below 1, and low safety factors reach further than the RMR suggestion. The roof is however similar, even slightly better with 2-factors covering all of the crown. In general, the RMR solution would be seen as the better of the two.
5. Results
5.3
Q-system and RMR correlation
In order to compare the output from Q and RMR, the average values from all boreholes are presented in the chart 5.10. The greatest difference between systems can be found at approximately Q=11, as shown by the vertical and horizontal lines in the graph.
Figure 5.10: Correlation between RMR and Q values
5.4
Site visit at Västlänken Korsvägen
A site visit was made possible at a stretch of the Västlänken rock tunnel through a kind invitation from Jörgen Halvarsson at NCC. The group got to visit and discuss one of the two rock service tunnels at the site, that at the point of the visit had advanced 40 meters. The tunnel diameter was approximately 8x8 meters and reinforced with bolts and shotcrete of varying dimensions. The first 20 meters of anchoring was done purely according to planning phase documents, being based on RMCS predictions. After 20 meters the people on site were able to use rock observations in combination with existing predictions to optimize anchoring dimensions and amounts. This led to a fairly large decrease in anchoring intensity, seeing as the rock
5. Results
Figure 5.11: Site visit to Västlänken tunnel, station Korsvägen
Figure 5.12: Closeup of the bolting and drilling machine in the Västlänken tunnel,
6
Discussion
6.1
Correlation of systems
From the results it is clear that the suggested rock mass quality from our two RMCS is very similar, following an almost linear trend without large outliers. This is different from the expectation based on previous studies, where results differing by 50% and more from the common correlation are present. The implication is that the RMCS speak in unison, which supports confidence in the reinforcement recommended by the RMCS. Even though results were very similar in this study, using one system to design anchoring is not advisable. Other studies suggest that large variations can exist, and furthermore, the reason that the results in this study can be seen as good and reliable is precisely because two independent systems were used.
6.2
The RMR and Q-system
6.2.1
Average case scenario
The average case is meant to be a representation of the mean value for the tunnel section, in this regard it would be interesting if the RS2 model indicates acceptable solutions for the average cases based on RMR and Q-system, since it is a measure for the most likely case. Both systems have suggested practically acceptable solutions. RMR however, reaches higher strength factors in general, with less material used, requiring only 54 metres of bolt length for the section compared to 56 metres in the Q-solution. The amount of shotcrete used is also significantly less in the RMR recommendation.
6.2.2
Best case scenario
The best case represents the absolute highest rock quality present in the data. The best case scenario may occur in a number of places along the entire tunnel but will be rather rare. Reinforcement according to the Q-system in this scenario is spot bolting with 4 meter long bolts with a spacing of 4 meters. No shotcrete is recommended. RMR suggests no systematic bolting or shotcrete at all, only recommending "spot bolting if required", see Table 5.1. Seeing as the safety factors in all areas of the tunnel geometry are close to 5, a recommendation of systematic bolting as in the
6. Discussion
Q-system case is too conservative and unnecessary. Spot bolting to secure loose blocks would be sufficient.
6.2.3
Worst case scenario
Worst case scenario represents the lowest present values of Q and RMR in the data, were several joints and weakness zones are present. Worst case reinforcement from the Q-system secures the roof, but does not manage to deal with weakness zones in the sides. RMR secures the roof, though not as well, but does also secure the sub 1 strength factors in the tunnel sides. Both these measures are not enough to ensure acceptable strength factors, the RMR solution is however to prefer.
6.2.4
Implications
From the results, specifically Table 5.1, one can conclude that RMR tends to be more liberal when the rock is of good or higher quality and more conservative when the rock mass is of worse quality. The Q-system on the other hand tends to be less varied over the whole spectrum of rock quality, recommending the same bolt length for all three scenarios. Building on this, the RS2 models show that RMR anchoring succeeds better in reaching acceptable safety factors in the worst case scenario. In general, in all scenarios, anchoring succeeds with securing high safety factors in the roof, spreading load upwards and into the tunnel sides. This is good, because the roof is by far the most critical part of the tunnel. Acceptable safety factors were said to be approximately 2, meaning that the RMR solution for worst case containing factors of 1.1 is still unacceptable, but it comes closer to a reasonable amount of reinforcement than the Q-system solution for the same scenario. One might expect the Q-system to fare better when rock quality is higher, as a result of the more uniform predictions. Maybe surprisingly this is not the case. In the best case scenario RS2 models, the rock quality is so good that factors of safety above 5 are present in the tunnel sides and ground, and all factors of safety are above 2, even in the tunnel roof and floor. Because of this, a recommendation of any general, continuous support, such as in the Q-system case (see Figure 5.6), is seemingly too conservative. The RMR recommendation in the best case on the other hand is no general support and spot bolting where required, i.e where loose blocks are present. This recommendation is much more reasonable when put side to side with the numerical model.
These results show RMR to be better weighed than the Q-system, reaching better solutions in both the worst and best case scenario and equally good in the average one. Worth noting is that this analysis assumes the legitimacy of the numerical model. While the model is not representing an exact truth, time and effort has been put in to make it as close to reality as possible. The model, while sufficient for this study, could be perfected further and more confident conclusions could be drawn.
6. Discussion
As mentioned previously, the Q-system overestimated necessary bolting in the best case scenario. While landing on the conservative side is better than results that cause failure, in order to build as efficiently as possible, it is desirable to limit an-choring. With that said, the results from RMCS should not be seen as more than an approximation of the optimal solution. Interestingly enough, we were told during our site visit at the Västlänken tunnel that during the start of construction, an-choring was installed strictly according to RMCS approximations. After advancing 40 meters, the anchoring was adapted according to observations made by on-site geotechnical staff, combined with RMCS design suggestions. Hence, we got to ob-serve how RMCS are used in a practical environment in a way which matches our theoretical conclusions.
In general, the RMCS exceeded our expectations. The results gave reasonably sim-ilar anchoring solutions in the most common scenarios, which sufficiently met re-quired safety factors. Seen as an approximation and a first step in tunnel design, these RMCS give a fair estimate of what reinforcement will be required. One of the main takeaways is that trusting the results from one system blindly might work in specific cases, such as the average scenario of this study, but to efficiently interpret the output, more than one system is of great help, and the task should be performed by a user with practical geotechnical experience.
“I am more and more amazed about the blind optimism with which the younger generation invades this field, without paying attention to the inevitable uncertainties in the data on which their theoretical reasoning is based and without making serious attempts to evaluate the resulting errors”. - Karl von Terzaghi
Bibliography
[1] A Palmström. Combinig the RMR, Q and RMi classification systems. 2009. [2] Statistiska centralbyrån. Sveriges folkmängd från 1749 och fram till idag. 2017. [3] Statistiska centralbyrån. Urbanisering - från land till stad. 2015.
[4] Eurostat. Degree of urbanisation for local administrative units level 2 (LAU2),. 2011/2016.
[5] Ekonomistyrningsverket. Utgifter i statens budget under en 50 års period, 2019. [6] Regeringen. Nationell infrastrukturplan 2018-2029, 2018.
[7] Trafikverket. Så bygger vi västlänken. 2012. [8] Trafikverket. Om ostlänken. 2018.
[9] Banverket. Järnvägsutredning inklusive miljökonsevensbeskrivning.
Trafikver-ket, 2006.
[10] A.M. Söder, P.E. Edwardsson. Geotechnics in västlänken, 2016.
[11] OpenStreetMaps Team. Vastlanken train tunnel in gothenburg sweden map based on openstreetmaps, 2015.
[12] A.S. Balasubramaniam. Developments in geotechnical engineering. A.A. Balkema, 1995.
[13] Udd J.E. Underground support systems. Canadian Institute of Mining and Metallurgy, 1987.
[14] E. Hoek. Practical rock engineering. RocScience, 2018.
[15] Broch E. Palmström, A. Use and misuse of rock mass classification systems with particular reference to the Q-system. Tunneling and Underground Space
Technology, 2006.
[16] Z.T. Bieniawski. Engineering classification of jointed rock masses. The Civil
Engineer, 1973.
[17] P Nicholson. Soil Improvement and Ground Modification Methods. A.A. Balkema, first edition, 2015.
[18] S. Xia K. Yang X. Zhang D. Wang S. Zhu J. Zhang, B. Li. Reinforcement of rock mass with cross-flaws using rock bolt. 2015.
[19] Norwegian Geotechnic Institute. Using the Q-system, Rock mass classification
and support design. Norwegian Geotechnic Institute, 2015.
[20] Rocscience.com. Strenght factor, 2019.
[21] Z.T Bieniawski. The rmr (rock mass rating) system, 1989.
[22] Lien R. Barton, N. and J. Lunde. Engineering classification of rock masses for the design of tunnel support. Rock Mechanics, 1974.
[23] E. Hoek. Rock mass properties, 2016.
[24] E. Kang K. Hong, K. Han. Journal of rock mechanics and geotechnical engi-neering. 2017.
Bibliography
[25] E.T Hoek, E. Brown. The hoek-brown failure criterion and gsie2018 edition. 2018.
[26] Abaspoor M. A. Laderian, A. The correlation between rmr and q-systems in parts of iran. Tunneling and Underground Space Technology, 27(1):149–158, 1 2012.
[27] Z.T Bieniawski. Engineering Rock Mass Classification. John Wiley sons, inc, first edition, 1989.
![Figure 2.1: Population density in Europe by Eurostat [4]](https://thumb-eu.123doks.com/thumbv2/5dokorg/3028471.5458/16.892.136.760.185.801/figure-population-density-in-europe-by-eurostat.webp)
![Figure 2.2: Government infrastructure investments in Sweden over time [5]](https://thumb-eu.123doks.com/thumbv2/5dokorg/3028471.5458/17.892.150.740.165.549/figure-government-infrastructure-investments-sweden-time.webp)
![Figure 2.3: Västlänken and the area of study in dotted blue [11]](https://thumb-eu.123doks.com/thumbv2/5dokorg/3028471.5458/18.892.147.751.464.982/figure-västlänken-and-the-area-study-dotted-blue.webp)
![Figure 3.1: Q-system anchoring chart [19]](https://thumb-eu.123doks.com/thumbv2/5dokorg/3028471.5458/23.892.142.718.325.741/figure-q-system-anchoring-chart.webp)
![Figure 3.2: RMR output table [20]](https://thumb-eu.123doks.com/thumbv2/5dokorg/3028471.5458/24.892.131.709.274.700/figure-rmr-output-table.webp)
![Figure 3.3: RMR table [21]](https://thumb-eu.123doks.com/thumbv2/5dokorg/3028471.5458/26.892.134.788.158.849/figure-rmr-table.webp)

![Figure 3.5: Correlation of Q-system and RMR values [27]](https://thumb-eu.123doks.com/thumbv2/5dokorg/3028471.5458/30.892.127.711.142.554/figure-correlation-q-rmr-values.webp)
![Figure 4.4: Boreholes for which data has been used [11]](https://thumb-eu.123doks.com/thumbv2/5dokorg/3028471.5458/36.892.134.761.194.917/figure-boreholes-data-used.webp)
