ScienceDirect
Procedia Computer Science 109C (2017) 343–350
1877-0509 © 2017 The Authors. Published by Elsevier B.V. Peer-review under responsibility of the Conference Program Chairs. 10.1016/j.procs.2017.05.362
10.1016/j.procs.2017.05.362
1877-0509 © 2017 The Authors. Published by Elsevier B.V. Peer-review under responsibility of the Conference Program Chairs.
Procedia Computer Science 00 (2016) 000–000
www.elsevier.com/locate/procedia
The 8th International Conference on Ambient Systems, Networks and Technologies
(ANT 2017)
An extended TAPAS-Z model and a case study of the transport of
forest products
Johan Holmgren
a,∗, Linda Ramstedt
baFaculty of Technology and Society, Malmö University, Malmö Högskola, SE-205 06 Malmö, Sweden bSweco Society AB, Gjörwellsgatan 22, Box 340 44, SE-100 26 Stockholm, Sweden
Abstract
We contribute an extension of the agent-based freight transport analysis model TAPAS-Z, whose aim is to simulate decision-making and other activities in transport chains. TAPAS-Z is a further development of the TAPAS model, and it enables stochastic variation, based on statistical distributions, of the locations of senders and receivers of freight, hence providing improved support for simulation of transport between larger regions. The model extension presented in this paper enables stochastic sampling of sender and receiver locations from historically known data, which we argue is beneficial in those situations where such data exist. We also contribute a case study where we used our extended TAPAS-Z model to simulate transport of timber from forest felling places to a Swedish paper mill. The case study illustrates how we recommend conducting a case study using the extended TAPAS-Z model. The aim of the study was to assess the possible implications of a structural change from a time-based to a distance-based Eurovignette system for heavy freight trucks in Sweden, which will lead to increased costs for most road users. As a mitigation action for the increased costs, we studied the possibility to use heavier trucks than the currently allowed 60 tonne trucks. The simulation results suggest that an introduction of a distance-based Eurovignette is expected to cause a small modal shift from road to rail for the studied type of transport. Furthermore, an introduction of larger freight trucks is expected to lead to a complete shift to road transport.
c
�2016 The Authors. Published by Elsevier B.V.
Peer-review under responsibility of the Conference Program Chairs.
Keywords: Multi-agent-based simulation, Freight transport modeling, Case study, Forest industry, TAPAS-Z, Road user charging, RUC
1. Introduction
Freight transport is a vital component in the modern society of today, and it is known to cause positive effects related to economy and social welfare, as it enables the trade of goods between locations that are separated in space. For example, freight transport enables distributed manufacturing and it allows end users to consume products that have been produced at far away locations. However, freight transport also has significant negative effects, mainly to the environment, as it contributes to pollution, noise, etc. Due to the need to achieve an efficient balance between
∗Corresponding author. Tel.: +46-40-6657688 ; fax: +46-40-665 76 46. E-mail address:johan.holmgren@mah.se
1877-0509 c�2016 The Authors. Published by Elsevier B.V. Peer-review under responsibility of the Conference Program Chairs.
the positive and negative effects of freight transport, the planning of freight transport is a complex task that requires the involvement of various types of actors, including public authorities. Public authorities, operating on regional, national, and international levels, are responsible for planning for a sustainable transport system that is capable of fulfilling the (freight) transport needs of society. At the same time, they are responsible for reducing the negative effects of transport, which has led to several initiatives and actions, often referred to as transport policies.
A promising type of action is infrastructure user charging, which has been traditionally used in order to finance
transport infrastructure, such as roads and bridges. Distance-based road user-charging1,2for heavy freight transport,
is a particular type of road user charging system, which is currently under investigation in many countries, and which has been already implemented in some European countries. In contrast with other ways to charge the road users, such as fuel taxes and time-based fees, distance-based road user charging may have several advantages. For example, it is expected to contribute to a fair charging system, where the road users pay for the infrastructure wear they cause, in the country where they operate, and for the environmental impact they cause. Initiatives like road user charging may lead to transport with better environmental performance by giving incentives to, for example, shift transport to more environmentally friendly modes of transport and increasing the fill rate during transport. The industry, on the other hand, is worried about the increased transport costs. Due to the different types of consequences of an initiative like distance-based road user charging system, it is important to assess the expected implications before the system is implemented. The introduction of a distance-based road user charging system in Sweden is the main focus of a case study presented in the current paper. The case study was commissioned by the Swedish government agency Transport analysis.
As transport polices may lead to both desired and undesired effects, it is important to assess their expected impacts prior to their implementation. This is often achieved through the use of different types of analysis models, and it is an important step in order to both avoid negative effects as well as to confirm positive effects. The traditional (model-based) approach for assessing the effects of transport polices is to use various types of macro-level models,
such as TRANS-TOOLS (TOOLS for TRansport Forecasting ANd Scenario testing)3 and SAMGOODS4,5.
Macro-level models are based on highly aggregate data, typically on international, national or regional Macro-level. However, there is an ongoing trend towards using modeling approaches that includes behavioral aspects (i.e., agent-based models) and where individual entities (or groups of entities) are represented and the relations between entities are typically studied over time. Examples of agent-based models that can be used for different types of policy analysis studies
are INTERLOG6, TAPAS7, and TAPAS-Z8. See also the recent work on freight market modeling by Cavalcante &
Roorda9and Abed et al.10.
In the current paper, we contribute an extension of the agent-based freight transport analysis model TAPAS-Z, whose aim is to simulate decision-making and other activities in transport chains. TAPAS-Z is a further development of the TAPAS model, and it enables stochastic variation, based on statistical distributions, of the locations of senders and receivers of freight, hence providing improved support for simulation of freight transport between larger regions. The model extension contributed in this paper enables stochastic sampling of sender and receiver locations from historically known data, which we argue is beneficial in those situations where such data exist.
As mentioned above, we also contribute a case study, where we simulated transport of timber from forest felling place storages to a paper mill located at the Swedish east coast. We conducted the study together with a representative of a major Swedish forest company, who provided data, for example, on historical felling place locations and transport cost components. The aim of the study was to assess the expected impacts, on transport choice and transport cost, of an updated Eurovignette directive for heavy road freight traffic in Sweden. The Eurovignette system currently in use in Sweden is time-based, where heavy trucks (over 12 tonne) pay a yearly fee that give them the right to use the Swedish road network. In our study, we analyzed the consequences of replacing the time-based Eurovignette with a distance-based road user charging system. The considered update of the charging system will lead to increased transport costs for most road users, and as a possible mitigation action, we included the possibility to use heavier trucks than the currently allowed 60 tonne trucks (in Sweden).
The results of our study have been used as input, by the Swedish public authorities responsible for the transport network, in a recent analysis on a structural change of the Eurovignette system used in Sweden. We argue that the results are of particular importance as the focus of the study was on transport of forest products, which is a type of transport that is often considered to be essential for the Swedish economy. Forest products is a relatively low valued product type where the transport cost constitute a large part of the total cost. These types of transport constitute a
significant share of the freight transport in Sweden, as they represent transport intensive sectors, like forestry and mining, which dominate the Swedish industry. We further argue that our results, which have been compared with the results obtained in an independent analysis conducted by the forest company involved in the study, contributes to the validation of the TAPAS-Z model, and in particular the extended TAPAS-Z model, which is used in the study.
In the next section (Section 2) we describe the TAPAS models, focusing on the extended TAPAS-Z model used in the case study presented in Section 3. Then, in Section 4, we conclude the paper with a discussion and some pointers to future work.
2. The TAPAS models
In this section, we describe the extended TAPAS-Z model, which is a contribution of the current paper, and which we used in our case study presented in Section 3. However, before presenting the extended TAPAS-Z model, we give a brief account on its predecessors, that is, TAPAS and TAPAS-Z, hence putting the extended TAPAS-Z model in its context.
2.1. TAPAS and TAPAS-Z
The Transportation And Production Agent-based Simulator (TAPAS)7is an agent-based model for simulation of
decision-making and activities in transport chains. TAPAS aims to assess the impact of various types of transport policy and infrastructural measures. It takes into account how transport chain actors are expected to act under different conditions, and the fundamental idea is that the simulated production and transport activities are consequences of the ordering and planning processes that take place in order to fulfill the consumers’ demand for products. Hence, it is based on causality, which is not the case with most traditional (macro-level) models for freight transport analysis. TAPAS is built using a 2-tier architecture with a physical simulator and a decision-making simulator (see Fig. 1). In the physical simulator, all the physical entities and their activities are modeled, and in the decision-making simulator, six transport chain decision maker roles are modeled as cost minimizing agents. In order to fulfill the consumers’ demands for products, the agents participate in a process that includes ordering of products and a transport solution, selection of which resources and infrastructure to use, and planning of how to use resources and infrastructure. This process starts each time a customer agent sends an order request, and it ends when products and a transport plan have been booked and confirmed.
Fig. 1. The 2-tier architecture of the TAPAS model.
TAPAS-Z8extends TAPAS, and it follows the same main principle as TAPAS, that is, that shipments are simulated
to represent a large number of suppliers and consumers of freight, which is achieved by randomly varying their locations within geographical zones. Hence, it enables to simulate shipments between geographical zones, and in that way it provides extended possibilities to estimate total transport volumes between geographical regions. In TAPAS-Z, all suppliers and consumers in a geographical zone are assumed to be randomly located in the catchment area of one logistics terminal, which is used to represent the whole zone. All suppliers and consumers in a zone are represented by one supplier and consumer node respectively, and by one supplier and customer agent respectively. Hence, all randomly generated consumers in a zone share inventory, consumption pattern, and ordering policy, although they are separated in space. Similarly, all suppliers in a zone share inventory and production facilities. Hence, decisions of when to order are taken centrally, and logistic choices are made based on the location of the supplier and the consumer, which are specific for each shipment. In this way it can be argued that TAPAS-Z is an agent-based model, which integrates some features from the macro-level paradigm.
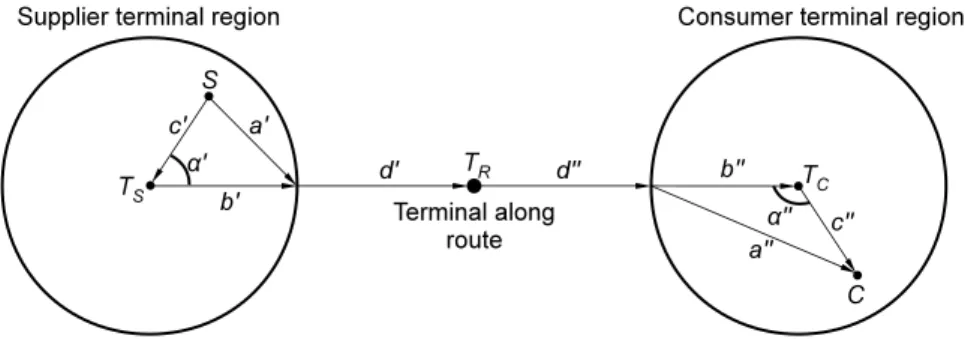
Furthermore, TAPAS-Z makes use of a transport network where road transport is enabled directly between a
sup-plier S and a consumer C, which in the example in Fig. 2 gives the approximate distance a′+ d′+ d′′+ a′′, or via their
local terminals (TS and TC), which gives the approximate distance c′+ b′+ d′+ d′′+ b′′+ c′′. The latter case typically
occurs when freight is transported by rail or sea between TS and TC, and by road between S and TS, and between TC
and C. Another transport option (among all possible alternatives) is road transport from S to TRand from TCto C,
and rail or sea transport from TRto TC(distance a′+ d′+ d′′+ b′′+ c′′).
Fig. 2. Illustration of distances for different routes from a supplier S , via a terminal TRto a consumer C. Transportation may occur, e.g., via terminals TS and TC(c′+ b′+ d′+ d′′+ b′′+ c′′) or direct by road (a′+ d′+ d′′+ a′′).
2.2. Extended TAPAS-Z
As mentioned above, the TAPAS-Z model makes use of a stochastic approach in order to vary the locations of suppliers and consumers (or senders and receivers of freight) around logistic terminals, hence introducing realistic variation when simulating shipments in particular relations (see Fig. 2, where the locations of C and S are generated stochastically for each shipment). In particular, TAPAS-Z makes use of the assumption that suppliers and consumers cluster around logistic terminals, and uses exponential distributions to approximate the distances between terminals and the suppliers and consumers that are located around terminals, which means that closer distances are generated with higher probability than larger distances. The directions of suppliers and consumers relative to terminals are generated using a uniform probability distribution.
An important reason for building TAPAS-Z on the abovementioned assumptions is that it is often difficult to obtain detailed information about the real world senders and receivers of freight that needs to be represented in the simulation model, for example, concerning their exact geographical locations. Often, only aggregate data about the freight flowing in and out from geographical zones are known. In such cases it is, instead, important to make assumptions that represent reality as accurately as possible, using whatever information is available for the model.
In situations where information is available about the shipments to model, for example, their origins and desti-nations, it is typically possible to do better than making stochastic modeling as in TAPAS-Z. However, it should be noted here that TAPAS-Z was constructed in order to deal with situations with very limited amount of information about shipments. In the current paper, we consider the situation where information is available about the locations of senders and receivers, and about the freight volumes flowing in particular sender-receiver relations. Hence, in the
extended TAPAS-Z model, which is a contribution of the current paper, it is possible to sample a sender-receiver location stochastically, from the known locations, for each shipment instead of generating the sender and receiver locations stochastically as in TAPAS-Z.
The probability that the model will sample a particular sender-receiver relation depends on the relative total volume (for example, yearly total volume) for that particular relation. For example, a sender-receiver relation with a total volume that is twice as high as the total volume in some other sender-receiver relation will be chosen with a probability that is twice as high.
3. Case study
In a case study, we used our extended TAPAS-Z model in order to study transport of forest products (i.e., timber for pulp production) from approximately 200 felling place storages, of varying size, to a paper mill located at the east cost of Northern Sweden (see Fig. 3 for an illustration of the case study).
Fig. 3. Illustration of the case study.
As mentioned above, we conducted our study in close collaboration with a representative of a major Swedish forest company, which helped us confirm the relevance of the considered studied case, validate the results, etc. In order to further validate our study, we discussed all assumptions made with experts representing the Swedish public authority Transport Analysis.
From the industry representative, we received a list of historical felling place storages corresponding to the first six months of 2014. For each felling place storage location, we received information about the total volumes, as well as distances both to a railway terminal, which might be used during transport, and to the paper mill. In addition, we received transport cost components for the types of vehicles currently used by the company.
The felling place storages are located in an area centered northwest of the paper mill. The road distance from the felling place storages to the paper mill varies between 6 km and 257 km, where the average distance is 109 km and the median is 90 km. Only trucks can reach the felling place storages, as they are located in the forests; however, there is a railway terminal located to the west of the paper mill, where timber can be reloaded from truck for further transport by rail directly to the paper mill. This is an option that the forest company currently utilizes for some of their shipments. The driving distance from the felling place storages to the railway terminal varies between 1 km and 191 km, where the average is 81 km, and the median is 76 km. The length of the railway link connecting the railway terminal and the paper mill is 153 km. In summary, there are two transport alternatives from the felling place storages to the paper mill:
• Road: Direct road transport using logging trucks.
• Road-Rail: Transport via the railway terminal, that is, transport using logging trucks to the terminal followed
Which of the two alternatives that is to prefer for a particular felling place storage is mainly determined by its location relative both the railway terminal and the paper mill.
In our case study, we studied how a structural update of the Swedish Eurovignette for heavy freight trucks (which for most road users lead to increased transport cost), increased railway infrastructure fees, and increased fuel prices are expected to influence the choice of transport alternative and the transport cost.
In the simulation study, we included the following five scenarios: A. 2014: Calibration scenario
B. 2017: Increased railway infrastructure fee + increased fuel prices (comparison alternative) C. 2017: Updated Eurovignette + increased railway infrastructure fee + increased fuel prices
D. 2017: Updated Eurovignette + increased railway infrastructure fee + increased fuel prices + 74 tonne trucks E. 2017: Updated Eurovignette + increased railway infrastructure fee + increased fuel prices + 90 tonne trucks We used scenario A (the current situation at the time of the study) in order to calibrate the model, that is, to repro-duce the distribution between the two considered transport alternatives, or in other words reprorepro-duce the percentage of road and road-rail transport respectively, which was reported by the forest company for the same set of felling place storage locations and volumes. We calibrated the model by adjusting the reloading cost from truck to train.
We used scenario B as our comparison alternative for 2017, as it includes increased road fuel prices and increased railway infrastructure fees according to the forecasts made in the study, but no structural update of the Eurovignette.
In scenario C, D, and E, we considered a distance-based Eurovignette of e 0.19/km for all types of the considered trucks, and an increased railway infrastructure fee of e 0.32/km. We forecasted an increased fuel price (for trucks) of e 0.043/litre. Furthermore, we converted the current (time-based) Eurovignette (e 1099/year), used in scenario A and B, based on the assumption that a typical logging truck travels approximately 17000 km/year, giving us a corresponding distance-based cost of e 0.065/km. All the above prices were in Swedish currency (SEK) and converted for improved clarity here into Euro using the official average exchange rate of 9.10 SEK/e (for 2014) from the Swedish tax agency.
As a mitigation action for the possible consequences of the increased costs following the considered structural change of the Eurovignette, the increased fuel prices, and the railway infrastructure fees, we included in scenario D and E the possibility to use heavier trucks than is currently allowed to use the Swedish roads. Currently, there is a 60 tonne weight limit for freight trucks operating in Sweden. However, despite the risk of increased road wear, there
are ongoing discussions in Sweden on allowing trucks up to 90 tonnes11,12, at least on the main road network. 60
tonne trucks (the only type of trucks included in scenario A-C) has a load capacity of 40 tonne, whereas 74 tonne trucks (included in scenario D) has a load capacity of 50 tonne and 90 tonne trucks (included in scenario E) has a load capacity of 65 tonne. The fuel consumption is assumed to be 12% higher for 74 tonne trucks than for 60 tonne trucks and 30% higher for 90 tonne trucks than for 60 tonne trucks.
For each shipment, a pickup location (i.e., a felling place location) was chosen stochastically from the list of known locations, which is in line with the functionality of the extended TAPAS-Z model (see Section 2.2). Moreover, the random choices of pickup location were weighted so that the possibility to choose a particular felling place storage location was proportional to the size of that location. For each of the considered scenarios (A-E), we simulated the transport of approximately 4000 tonnes of timber. We used the same random seed for all of the scenarios, which allowed us to pairwise compare the scenarios.
In Table 1 we present, for each of the five scenarios, the simulated share of transported tonnes for the two considered routes, and in Table 2 we present the expected change of transport cost for the alternative scenarios for 2017 (i.e., C, D, and E), compared to our comparison scenario for 2017 (i.e., B).
For our calibration scenario (A), our results show that the direct road alternative was chosen for 96% of the trans-ported volumes, whereas the road-rail alternative was chosen for the remaining 4% of the volumes. This corresponds quite well with the figures reported by the forest company involved in the study; they reported that 95% of the volumes was transported using the road alternative and 5% was transported using the road-rail alternative. For our comparison alternative (B), we achieved the same proportions of transported volumes as for scenario A, that is, 96% for the road alternative and 4% for the road-rail alternative. A plausible reason that we get the same proportions for these two scenarios is that the increase in fuel price and the increase in railway infrastructure fees cancel each other out.
For scenario C, where we included the distance-based Eurovignette, but no mitigation action was considered, our results suggest a decrease of direct road transport to 93% (from 96%) and an increase of the road-rail transport alternative to 7% (from 4%). For scenario C, the transport cost is expected to increase with 7,6% compared to scenario B (our comparison scenario for 2017). It should be noted here that the company involved in the study independently conducted their own analysis using their transport planning software, resulting in a transport cost increase of 7%, which is in line with our result.
For scenario D and E, where we introduced larger trucks as an action to mitigate the increased costs caused by the introduction of distance-based road user charging, our results show a complete shift to road transport; the railway alternative is not used at all. The obvious reason for this is that the introduction of larger vehicles is expected to reduce the transport cost to such a level that railway transport is no longer a competitive alternative. The expected cost reductions for scenario D and E, compared to scenario B, is 7.2% and 19.8% respectively.
Table 1. Distribution of transported tonnes for the two considered routes.
Scenario Road Road - Rail
A 2014: Calibration scenario 96% 4%
B 2017: Increased railway infrastructure fee + increased fuel prices (comparison alternative) 96% 4% C 2017: Updated Eurovignette + increased railway infrastructure fee + increased fuel prices 93% 7% D 2017: Updated Eurovignette + increased railway infrastructure fee + increased fuel prices + 74 tonne trucks 100% 0% E 2017: Updated Eurovignette + increased railway infrastructure fee + increased fuel prices + 90 tonne trucks 100% 0%
Table 2. Expected change of transport cost for the three alterative 2017 scenarios (i.e., C, D, and E), compared to our comparison scenario (B).
Scenario (2017) Change of transport cost
C Updated Eurovignette + increased railway infrastructure fee + increased fuel prices 7.6 % (increase compared to B) D Updated Eurovignette + increased railway infrastructure fee + increased fuel prices + 74 tonne trucks -7.2% (decrease compared to B) E Updated Eurovignette + increased railway infrastructure fee + increased fuel prices + 90 tonne trucks -19.8% (decrease compared to B)
4. Concluding remarks
We have presented an extension of TAPAS-Z, which is a model for simulation of decision-making and other activi-ties in transport chains. In turn, the TAPAS-Z model extends the TAPAS model, through enabling stochastic variations of the locations of senders and receivers of freight around network nodes, hence providing improved support for sim-ulation of freight transport between geographical regions. The extended TAPAS-Z model, presented in this paper, enables stochastic sampling of sender and receiver locations from historically known data about senders, receivers, and transport volumes. This is not the case with the original TAPAS-Z model, which instead makes use of statistical distributions in order to estimate the locations of senders and receivers of freight. We argue that the sampling ap-proach used by the extended TAPAS-Z model is to prefer whenever detailed data is available about the locations of the senders and receivers of freight, as this might help obtaining improved simulation results.
We have also presented a case study where we used our extended TAPAS-Z model in order to simulate transport of timber from forest felling places to a paper mill in Northern Sweden. We conducted the case study in collaboration with a representative of a major Swedish forest company, who provided data and helped us validate our study through enabling us to compare our results (for the 2017 comparison alternative) with the results obtained in an analysis the forest company conducted independently, considering the same felling place storages and volumes, using their own planning software. They also provided the information that was necessary to calibrate our model.
The comparison with the analysis conducted by the forest company supports the validation of our simulation results, in particular as the two independent studies produced similar results. The case study further shows how we recommend to conduct a study with the extended TAPAS-Z model; including data collection, calibration, analysis of future scenarios (including both a comparison scenario and extended scenarios), etc.
The conducted case study directly supports the validation of the extended TAPAS-Z, which makes use of sampling of historical sender and receiver locations. However, we argue that it indirectly also supports the validation of the original TAPAS-Z model as well as its predecessor TAPAS. The reason we make this claim is that TAPAS-Z and its extension (presented in the current paper) is built on stochastic variation of senders and receivers of freight using the same principles; however using different sampling approaches. Furthermore, TAPAS-Z inherits most of the character-istics of TAPAS, for example, the models use the same agent-based decision model. See Section 2 for a more detailed discussion on the TAPAS models.
The results of our study indicate that an introduction of the studied, distance-based, Eurovignette is expected to cause a small modal shift from road to railway transport due to an increase of the total transport cost of approximately 7% for the studied transport. Furthermore, the introduction of 74 and 90 tonne freight trucks is expected to lead to a complete shift to road transport for the studied type of transport, and transport cost reductions of 7.2% and 19.8% respectively.
It should be emphasized that our results suggest that the use of heavier (and longer) trucks might be an important mitigation action for increased transport cost caused by, for example, increased road user charging. The current discussion in Sweden suggests that freight trucks heavier than 60 tonne should be allowed only to use the European highways and the larger national highways. Even so, we argue that our results are important, for example, as they might justify exceptions to these restrictions for transport that are considered important for the Swedish economy, like the type of transport considered in our study.
A possible direction for future work is to study, using the extended TAPAS-Z model, the consequences of allowing heavier (and longer) trucks on only parts of the road network. Future work also includes further development of the sampling strategies used in TAPAS-Z, hence improving its performance in case there is no such detailed data available as we used in the current study.
Acknowledgements
We acknowledge the Swedish forest company that provided the data for our study and helped us validate our study. We also want to thank the Swedish governmental authority Transport Analysis for supporting our study in various ways and for providing the necessary funding for our work.
References
1. Broaddus, A., Gertz, C.. Tolling heavy goods vehicles: Overview of European practice and lessons from German experience. Transportation Research Record: Journal of the Transportation Research Board 2008;2066:106—-113.
2. Mbiydzenyuy, G., Widell, J., Sandbreck, C., Dahl, M., Pettersson, M.. Effektutvärdering av kilometerskatt för tunga fordon. 2016. 3. Rich, J., Overgaard Hansen, C., Vuk, G., Anker Nielsen, O., Korzenewych, A., Bröcker, J.. Report on scenario, traffic forecast and
analysis of traffic on the TEN-T, taking into consideration the external dimension of the union - TRANS-TOOLS version 2; model and data improvements. 2009. Funded by DG TREN, Copenhagen, Denmark.
4. Swahn, H.. The Swedish national model systems for goods transport SAMGODS - a brief introductory overview. SAMPLAN-report 2001:1; Swedish Institute for Transport and Communications Analysis (SIKA); 2001.
5. de Jong, G., Ben-Akiva, M.. A micro-simulation model of shipment size and transport chain choice. Transportation Research Part B 2007;41(9):950–965.
6. Liedtke, G.. Principles of micro-behavior commodity transport modeling. Transportation Research Part E 2009;45(5):795–809.
7. Holmgren, J., Davidsson, P., Persson, J.A., Ramstedt, L.. TAPAS: A multi-agent-based model for simulation of transport chains. Simulation Modelling Practice and Theory 2012;23:1–18.
8. Holmgren, J., Dahl, M., Davidsson, P., Persson, J.A.. Agent-based simulation of freight transport between geographical zones. In: Procedia Computer Science: Vol. 19. Proceedings of the 2nd International Workshop on Agent-based Mobility, Traffic and Transportation Models, Methodologies and Applications (ABMTRANS). 2013, p. 829–834.
9. Cavalcante, R.A., Roorda, M.J.. Freight market interactions simulation (fremis): An agent-based modeling framework. In: Procedia Computer Science: Vol. 19. Proceedings of the 2nd International Workshop on Agent-based Mobility, Traffic and Transportation Models, Methodologies and Applications (ABMTRANS). 2013, p. 867–873.
10. Abed, O., Bellemans, T., Janssens, G.K., Janssens, D., Yasar, A.U.H., Wets, G.. An agent based simulated goods exchange market; a prerequisite for freight transport modeling. In: Procedia Computer Science: Vol. 52. Proceedings of the 6th International Conference on Ambient Systems, Networks and Technologies (ANT-2015), the 5th International Conference on Sustainable Energy Information Technology (SEIT-2015). 2015, p. 622–629.
11. Swedish Transport Administration, . Tyngre fordon på det allmänna vägnätet. 2014.