INTIMATE PARTNER VIOLENCE
AGAINST MEN. A SYSTEMATIC
REVIEW OF HOW DEFINITION,
STUDY CHARACTERISTICS AND
QUALITY AFFECTS
PREVALENCE
INTIMATE PARTNER VIOLENCE
AGAINST MEN. A SYSTEMATIC
REVIEW OF HOW DEFINITION,
STUDY CHARACTERISTICS AND
QUALITY AFFECTS
PREVALENCE
RONJA LINDSTRØM
Lindstrøm, R.
Intimate partner violence against men. A systematic review of how definition, study characteristics and quality affects prevalence.
Degree project in criminology, 30 credit.
Malmö University: Faculty of health and society, Institution of criminology, 2018
Abstract
Intimate partner violence (IPV) is an important social problem, but historically the scientific research has focused mostly on the female victims. Several reviews exist on female victims, but no on male victims. The prevalence rates presented in the literature are very heterogeneous, which has been explained by variations in methodology, a lack of a clear recognized definition and a missing golden standard. This thesis reviews prevalence rates in studies on IPV with a male victim, and answers the following questions; (1) What are the total prevalence rates in relation to the different study characteristics and do we see any significant differences within these characteristics? (2) How does the definition of intimate partner violence and study characteristics affect the prevalence rate? (3) What type of relationship do we see between the quality of studies and prevalence rate? A systematic review has been carried out resulting in 49 relevant studies on male victims of IPV. The data from these 49 studies have been extracted based on the operationalization of “definition” in categories of type of violence, type of instrument and number of survey questions and in the operationalization of study quality based on a quality index by Looney et al. (2000). A students t-test and linear regression models was conducted to answer the research questions. This study finds that men are more often victims of psychological violence than
physical violence, which is in contrast to female victims. The study also finds that the introduction of each of the definition-variables results in higher prevalence rates. This indicates, that factors related to the definition are important elements in the study of IPV prevalence in male victims.
Keywords: definition, intimate partner violence, male victim, methodological
TABLE OF CONTENTS
1.INTRODUCTION
...3 1.1. Objective………4 Research questions………..42. METHODS
……….4 2.1 Search strategy……….4 2.2 Selection criteria………..5 2.3 Data collection………..6 2.4 Statistical analysis………...8 2.5 Ethical considerations………83. RESULTS
...84. DISCUSSION
………...145. REFERENCES
………181. INTRODUCTION
Intimate partner violence (IPV) is a serious social problem, which affects millions of men, causing depression, suicidal ideation and physical harm (Cascardi & Vivian, 1995; Chan, 2008; CDC, 2017; Hines & Douglas, 2009; Hines & Malley-Morrison, 2001). Historically speaking, intimate partner violence has been considered a female victim issue (Ellsberg & Heise, 2005) and the concept of female victims is much more recognized in the general population than the concept of male victims (Dasgupta, 2002). The research on female IPV has been the subject of a substantial amount of research, but on the other hand, IPV against men is a phenomenon that has received very little attention in the academic literature and the media around the world (Hines & Douglas, 2009). The mismatch between male and female victims of IPV is even evident in the law enforcement system as research show, that women are more likely to go unpunished of IPV, because they generally are looked at as victims not perpetrators (Felson & Pare, 2007; Kingsnorth & MacIntosh, 2007). This mismatch is present despite the fact that several studies has shown similar and even higher prevalence rates for male victims of IPV compared to female victims, but that remains debated (Archer, 2000; Straus & Gelles, 1986). Furthermore, evidence showing large differences in prevalence rates between studies, has been a source of much speculation (Buzawa & Buzawa, 2002) and the true prevalence of IPV both in relation to male and female victims still remains a question of intense debate (Straus, 2010).
How to define and measure IPV are two important and correlated elements in the investigation of IPV prevalence. Intimate partner violence (IPV) is as the name indicates violence in intimate relationships. However, what constitutes an intimate partner and what constitutes a violent act is not clear, and there does not exist any clear definition of what the term covers, making it necessary with some degree of interpretation in order to measure it (Thackeray & Randell, 2011). This has been proposed as an explanation for the great difference in prevalence among studies (Buzawa & Buzawa, 2002). The World Health Organisation (WHO) defines IPV as, ”any behaviour within an intimate relationship that causes physical,
psychological or sexual harm to those in the relationship” (WHO, 2002). This definition will act as the basis of this study, and should be distinguished from the broader definition of domestic violence, where the violent act in contrast can be between anyone in the household, not exclusively between intimate partners (Buzawa & Buzawa, 2002).
In relation to the measurement of IPV, no agreed on golden standard exist, which is a problem, as research has shown, that the measurement used to detect IPV in participants has significant impact on the prevalence (Waltermaurer, 2005; Johnson & Ferraro, 2004). The most used and validated instrument in relation to measuring intimate partner violence is the conflict tactics scale (CTS) (Costa & Barros, 2016). This is a survey consisting of 80 questions/items asking about experience of specific violent acts, grouped into three types of violence, physical, psychological and sexual. There are several different versions of the CTS, but the most used is the CTS or the revised version the CTS2 (Costa & Barros, 2016). Typically the studies using the CTS handpick some of the items and only rarely all items are used (Straus et al, 1996). The most used items in the group of physical violence are questions like; slapped, punched, bit, grabbed my partner (minor); "Kicked, hit, beat up my partner" (severe). In the psychological group it
can be items like; called name, yelled or shouted, stomped out of the room,
embarrassed the partner and the sexual items is often; insisted on sex or used force or threat to make partner have sex (Straus et al. 1996). The CTS as an instrument have been criticized for not taking into account elements like intention and context. And thus, other ways of categorizing IPV has been proposed. The most recognized is Johnson’s typology (2006), which divide types of violence into four categories based on the control context of the violent act and whether the violence is bidirectional (Johnson, 2006).
Furthermore, other methodological factors have been proposed as being important in prevalence studies of IPV. Variables to be aware of in relation to these
methodological factors are whether the surveys are self-administered or by interview and whether the population is representative or subgroup (Carmo et al., 2011; Gracia, 2004). Furthermore, evidence has shown that prevalence among female victims varies between continents (WHO, 2013) and the type of violence measured (Buzawa & Buzawa, 2002).
Several systematic reviews on the prevalence of female IPV victimization have been carried out (Alhabib et al., 2009), but no one on male victims other than two systematic reviews comparing the prevalence of male and female victims (Archer, 2000; Chan, 2011). This makes it highly relevant to carry out a systematic review on IPV against male victims. And as indicated above, several studies have pointed out numerous methodological pitfalls in relation to the measurement of IPV including definition, but no studies have carried out an investigation of several methodological variables in combination with a systematic review on prevalence.
1.1. Objective
The overall objective of this thesis is to review prevalence rates in studies on intimate partner violence with a male victim, and to study whether study quality and methodological factors have influenced the rates of prevalence that are presented in different studies.
Research questions:
(1.1.1) What is the total prevalence rate in relation to the different study characteristics and do we see any significant differences?
(1.1.2) How does the definition of intimate partner violence and study characteristics affect the prevalence rate?
(1.1.3) What type of relationship do we see between the quality of studies and the prevalence rate?
2. METHODS
2.1 Search strategy
Literature searches of two databases; PubMed and PsycINFO were undertaken for the period 2000–2018. All published articles concerning IPV, with a basis in the WHO definition, described in the introduction, where identified using a broad and comprehensive search in the databases. The reference lists from retrieved studies
were hand searched to look for further studies that might not have been retrieved by the databases search.
The search had the following selection in the database; Full text, year 2000-2018, humans, English, title and abstract. Through a preliminary research, frequently chosen words used in the research and literature regarding IPV was identified and used in the search string. The search string related to PsycINFO was restricted further compared to the search string used in PubMed as it produced to many results. The search included words with combinations of “AND” and “OR”. See box 1.
Box. 1. Words used in the search
PubMed 1. Domestic OR 2. Spouse OR 3. Partner OR 4. Intimate OR 5. Marital OR 6. Relationship AND 7. Violence OR 8. Violent OR 9. Abuse OR 10. Abusing OR 11. Battered AND 12. Male OR 13. Men OR 14. Man PsycINFO 1. Domestic OR 2. Spouse OR 3. Partner OR 4. Intimate OR 5. Marital OR 6. Relationship AND 7. Violence OR 8. Violent OR 9. Abuse OR 10. Abusing OR 11. Battered AND 12. Male victim* 2.2 Selection criteria
In this study the inclusion criteria were as follows: (1) original research, (2) peer-reviewed studies, (3) written in English, (4) published between January 1, 2000 and March 1, 2018, (7) articles available via online access for students of University of Malmö. The exclusion criteria were as follows: (1) studies that do not report the prevalence of male victim IPV, (2) studies with incomplete or unclear data or logical errors, (3) duplicate publications, and (5) register studies, (6) data that clearly stated inclusion of homosexual men.
The search was limited to data between year 2000 and 2018, because a thorough systematic review was published in 2000 comparing male and female prevalence rates of IPV victimisation. Register studies, such as police reports and emergency records were excluded, because studies have shown that data from register studies
and surveys are very different and therefore very difficult to compare and
generally it is debated whether it is even suitable to calculate prevalence rates on the basis of this kind of registers (Gelles, 2000). Studies on homosexual men were excluded to make the studies more comparable, as the perpetrators naturally differ from perpetrators in heterosexual relationships.
2.3 Data collection
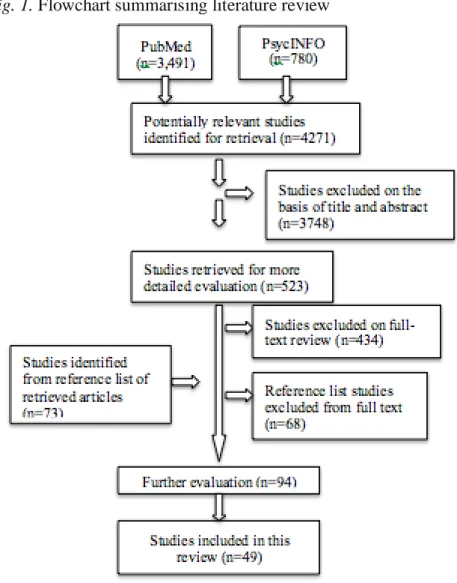
The searches identified 4271 primary studies. 3748 studies were excluded after reading the title and abstract. 523 studies were left for full text reading, and 434 were excluded after that. The evaluation of reference lists gave 73 additional studies for full text reading, where only five studies met the criteria. That gave in total 94 studies to examine again. Many of the remaining 94 studies were
excluded, because the data did not distinguish clearly between males and females; data was from before year 2000; the articles were register studies; the studies did not have information about the sample size and prevalence.The final examination resulted in 49 studies to include in the review (see Fig. 1).
Fig. 1. Flowchart summarising literature review
By using a self-designed protocol, the information of the included studies was evaluated independently. The self-designed protocol was designed based on inspiration from other reviews (Alhabib et al., 2009; Chan, 2011; Sparrow, 2017; Archer, 2000). The different categories were chosen in order to answer the
research question. The following basic data of each study was extracted: year of publication, author and population size.
Furthermore, a total prevalence rate was extracted and used as the dependent variable in all analyses, it was defined as the rate of any type of violence (types of violence see next section). In cases where any violence was not specified, the highest rate among the three types of violence was used.
In order to measure the effect of methodological characteristics a decision of what constitute a methodological characteristic was made on the basis of what previous research has shown to be important and what other studies on IPV typically report on of methodological characteristics. The following variables were
operationalized as the methodological characteristics and categorized as follows. (1) Time frame categorized as short term (within last 12 months) and long term (between 12 months and lifetime). (2) Geographical location divided into
continents (North America, Europe, Australia, Africa, Asia and South America). (3) Survey method categorized into interview (any personal contact with an interviewer either telephone or face-to-face) and self-administered. (4)
representative sample, grouped into representative or others (population samples, or not representative for the country such as college students, farm workers and not defined). (5) response rate categorized as above 70% or below.
How to measure the definition of IPV has been a challenge in this thesis as the most studies doesn’t provide with a clear definition and as described in the introduction in order to make the definition of IPV concrete, it is necessary with some degree of interpretation. In this study the measurement of IPV definition is operationalized by three variables that reflect indirect measures of the definition of IPV. The three variables are; (1) Types of violence, categorized into three types according to the WHO definition as physical violence, psychological violence or sexual violence. (2) Instrument, categorized into CTS (both CTS2 and original CTS) and others (other validated instruments, own survey questions or not defined). (3) Number of survey items/questions, categorized numerically as the total number of questions used in a instrument or any self made questionnaire. These three variables are considered the best indirect measures of definition in the available data material.
To assess the methodological strength of the included articles, a scoring system specific for prevalence studies was used (Loney et al. 2000). The articles are evaluated individually for each of the 8 quality items. Hereby, the final quality score ranges from 0 to 8, where 8 is the score for the highest possible quality. The 8 items are as follows: (1) Random sample or whole population, (2) Unbiased sampling frame (i.e. census data) (3) Adequate sample size ( >223 subjects), (4) Measures were the standard (if the instrument of measure was validated, (5) Outcomes measured by unbiased assessors, (6) Adequate response rate (>70%), (7) Confidence intervals provided, (8) Study subjects described. (Loney et al. 2000). If the text was unclear or did not describe an item, then a score of 0 was given for that item. Adequate sample size was calculated on the basis of the formula for cross sectional studies giving a minimum sample of 223 from an estimated prevalence of 17.6 according to the total pooled prevalence of this study (Pourhoseingholi et al., 2013). See Table 6 for how the 49 studies are distributed on the quality score.
2.4 Statistical analysis
All the statistical analysis is made in SPSS. Differences in prevalence rates in relation to different study characteristics, cf. research question (1.1.1), was analysed with the students t-test. A p-value of 0.05 or lower was considered significant. This p-value is also the limit of significance in the following analysis. How the definition of IPV affects the prevalence rate cf. research question (1.1.2), was tested using a multiple linear regression analysis. The total prevalence for each study was used as the dependent variable and the study characteristics were used as the independent variables. The variables are presented in table 4 and 5. In order to limit the number of independent variables the categories in the variables “type of violence” and “geographical location” was recoded into dichotome nominal variables. The type of violence was categorized as psychological (all studies containing information of the psychological prevalence rate) and not psychological (information on only physical and/or sexual and not defined). Furthermore the geographical location was categorized as Western continents (North America, Europe and Australia) and Non-Western continents (Africa, Asia and South America).
Furthermore, a univariate linear regression analysis was constructed in order to evaluate the relationship between number of study items and prevalence rate. A lot of the included studies do not provide information on study items, which leads to a reduction in observations in a regressions analysis. Therefore, the number of items was not included in the multiple linear regression analysis, but analysed separately in a univariate linear regression analysis.
How the quality score correlates to the prevalence rate cf. research question (1.1.3), was likewise tested using a univariate linear regression analysis, with the quality score as the independent variable and prevalence rate as the dependent variable.
2.5 Ethical considerations
Before conducting scientific research, ethical considerations should be made. The main reasons for taking ethical considerations is to ensure the safety of the
participants, human rights and respect for personal confidential boundaries (Wager & Wiffen, 2011). Since this study is a systematic review, there are no direct or indirect risks of such possible negative impact on the participants as these have already been studied. However, you still have to be aware that the results of the study can affect political decisions relating IPV and hereby also the victims of IPV either negatively or positively.
The unbiased and objective approach to answer the research question is identified as one of the most important ethical considerations in relation to this study. There has been much attention into this ethical consideration in the literature search by focusing on the inclusion of all relevant articles. In all parts of the process of writing this thesis, a large amount of effort has been into upholding this unbiased approach to answering the research questions.
3. RESULTS
(1.1.1)
The prevalence rates in relation to different study characteristics have been identified for each of the selected studies. The pooled prevalence for all studies
was calculated afterwards as a weighted average, and the results can be found in table 1 below.
Table 1. Pooled prevalence rates by study characteristic (%) Study characteristics Pooled prevalence
rate Type of assault Physical 12 Psychological 28 Sexual 5 Not defined 23 Time frame Short term 10 Long term 17 Not defined 21 Continent Africa 16 Asia 24 Australia 11 Europe 13 N. America 17 S. America 11 Total 18
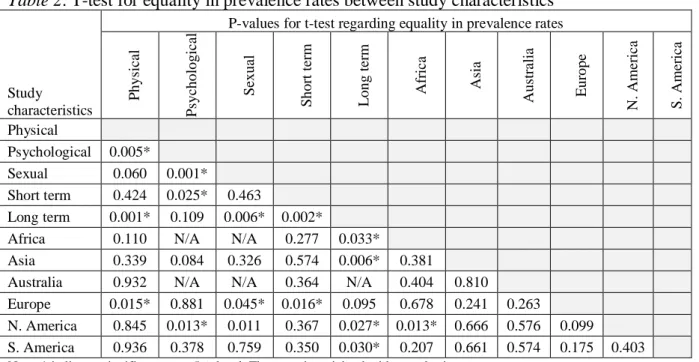
The difference between these prevalence rates was formally tested with a t-test, which is shown in table 2 below.
Table 2. T-test for equality in prevalence rates between study characteristics
Study
characteristics
P-values for t-test regarding equality in prevalence rates
P hys ic al P syc hol ogi ca l S exua l S hor t te rm L ong te rm A fr ic a A sia A us tr ali a E ur ope N . A m er ic a S . A m er ic a Physical Psychological 0.005* Sexual 0.060 0.001* Short term 0.424 0.025* 0.463 Long term 0.001* 0.109 0.006* 0.002*
Africa 0.110 N/A N/A 0.277 0.033*
Asia 0.339 0.084 0.326 0.574 0.006* 0.381 Australia 0.932 N/A N/A 0.364 N/A 0.404 0.810 Europe 0.015* 0.881 0.045* 0.016* 0.095 0.678 0.241 0.263 N. America 0.845 0.013* 0.011 0.367 0.027* 0.013* 0.666 0.576 0.099 S. America 0.936 0.378 0.759 0.350 0.030* 0.207 0.661 0.574 0.175 0.403
Note: * indicates significance at a 5%-level. The t-test is weighted with sample size.
There is a significant difference between the prevalence rate for physical IPV (12%) and psychological IPV (28%). The t-test also reveals a significant difference between the prevalence rate for sexual IPV (5%) and psychological IPV (28%).
The prevalence rate for long term studies (17%) is significantly larger than the prevalence rates for short term studies (10%). There are other significant
differences in prevalence rates between study characteristics, cf. table 2, but they are not relevant for the research questions addressed in this thesis.
In order to evaluate the reliability of the pooled prevalence rates in table 1, it is relevant to look at the homogeneity in prevalence rates between studies. Table 3 gives an overview of the prevalence rates for all 49 studies included in this review, ranked with numbers from 1-49 in alphabetical order. Table 3 indicates that there is a large amount of heterogeneity in prevalence rates between studies, which reduces the reliability of the pooled prevalence rates. No formal
heterogeneity test has been conducted due to lack of confidence intervals in the most of the included studies.
Ph ys ica l Ps yc ho lo gic al Se xu al No t d ef in ed Sh or t t er m Lo ng te rm No t d ef in ed Af ric a As ia Au str ali a Eu ro pe No rth A m er ica So ut h Am er ica Ge ne ra l Cl in ica l
1 2009 Allen, C. T. 92 34 (37) Self-administered CTS2 No Yes 34 (37) 34 (37) 34 (37) 34 (37) 2 2011 Amanor-Boadu, Y. et al. 257 70 (27.2) Self-administered CTS2 No No 70 (27.2) 70 (27.2) 70 (27.2) 70 (27.2) 3 2002 Anderson, K. L. 3,132 282 (9) Self-administered Yes No 282 (9) 282 (9) 282 (9) 282 (9) 4 2007 Andersson, N. et al. 8,113 1294 (15.9) Interview Yes Yes 1294 (15.9) 1294 (15.9) 1294 (15.9) 1294 (15.9)
5 2005 Baker, C. K. et al. 907 0 (0) Interview Yes Yes 0 0 0 0
6 2005 Balsam, K. F. et al. 185 80 (43) Self-administered No No 80 (43) 80 (43) 80 (43)
7 2017 Barros, C. R. D.S. & Schraibe, L. B.775 79 (10.2) Interview No No 21 (2.7) 55 (7.1) 12 (1.6) 79 (10.2) 79 (10.2) 79 (10.2) 8 2017 Blodgett, C. & Lanigan, J. D.484 109 (23) Self-administered No No 109 (23) 15 (3) 109 (23) 109 (23) 109 (23)
9 2008 Breiding, M. J. et al. 26,258 3035 (11.5) Interview BRFSS Yes No 2839 (10.7) 378 (1.5) 166 (0.7) 3035 (11.5) 3035 (11.5) 3035 (11.5) 10 2011 Breiding, M. J. et al. 5,848 2719 (46.5) Interview Yes No 1608 (27.5) 2719 (46.5) 556 (9.5) 281 (4.8) 2719 (46.5) 2719 (46.5) 2719 (46.5) 11 2005 Cerone, J. J. et al. 189 160 (84.6) Self-administered CTS2 No No 79 (41.80) 160 (84.6) 79 (41.8) 79 (41.80) 79 (41.80) 12 2004 Chan, K. L. 1,870 1166 (62.3) Interview CTS2 No Yes 164 (8.8) 914 (48.9) 88 (4.7) 992 (53.0) 1166 (62.3) 1166 (62.3) 1166 (62.3) 13 2009 Chang, D. F. et al. 707 85 (12.0) Interview CTS No Yes 85 (12.0) 85 (12.0) 85 (12.0) 85 (12.0) 14 2015 Colorado-Yohar, S. M. et al182 47 (25.8) Interview No Yes 18 (10.4) 45 (24.7) 1 (0.05) 47 (25.8) 47 (25.8) 47 (25.8) 15 2015 Costa, D. et al. 1,470 870 (59.2) Self-administered CTS2 No No 238 (16.2) 870 (59.2) 241 (16.4) 238 (16.2) 238 (16.2) 238 (16.2) 16 2011 Duke, M. R. & Cunradi, C. B. 37 8 (21.6) Interview CTS2 No No 8 (21.6) 8 (21.6) 8 (21.6) 8 (21.6) 17 2014 Fehringer, J. A. & Hindin, M. J.511 285 (55.8) Not defined CTS No No 285 (55.8) 285 (55.8) 285 (55.8) 285 (55.8) 18 2005 Fergusson, D. et al. 391 260 (66) Interview CTS2 Yes Yes 260 (66) 260 (66) 260 (66)
19 2013 Flake, T. A. et al. 133 100 (75.2) Self-administered CTS2 No Yes 44 (33) 85 (63.9) 49 (36.8) 100 (75.2) 100 (75.2) 100 (75.2) 20 2009 Fox, K. A. et al. 528 64 (12.10) Self-administered CTS2 No No 64 (12.10) 64 (12.10) 64 (12.10) 64 (12.10) 21 2011 Gass, D., et al. 641 128 (20.9) Interview CTS No Yes 128 (20.9) 128 (20.9) 128 (20.9) 128 (20.9) 22 2014 Graham, K. et al. 14,634 1170 (8.0) Self-administered No No 1170 (8.0) 1170 (8.0) 171 (10.6) 46 (3.7) 57 (8.3) 289 (14.2) 472 (6.9) 140 (6.2) 1170 (8.0) 23 2001 Harned M. S. 385 335 (87) Self-administered CTS2 No No 81 (21) 335 (87) 115 (30) 81 (21) 81 (21) 81 (21) 24 2003 Harwell, T. S. et al. 418 4 (1) Interview BRFSS Yes Yes 4 (1) 4 (1) 4 (1) 4 (1) 25 2011 Helweg-Larsen, K. et al. 6,109 16 (0.3) Interview Yes No 16 (0.3) 16 (0.3) 16 (0.3) 16 (0.3) 26 2007 Hines, D. A. 3,461 899 (25.9) Self-administered CTS2 No No 899 (25.9) 899 (25.9) 180 (20.0) 11 (1.2) 270 (30) 438 (48.7) 38 (4.2) 899 (25.9) 27 2016 Kamimura, A. et al. (A) 348 67 (19.2) Not defined CTS2 No No 67 (19.2) 67 (19.2) 67 (19.2) 67 (19.2) 28 2016 Kamimura, A. et al. (B) 23 22 (95.7) Not defined CTS2 No No 22 (95.7) 22 (95.7) 22 (95.7) 22 (95.7) 29 2013 Khalifeh, H. et al. 9,723 1254 (12.9) Self-administered Yes Yes 795 (7.0) 811 (7.5) 48 (0.5) 273 (2.6) 1254 (12.9) 1254 (12.9) 1254 (12.9) 30 2010 Kim, J. Y. et al. 3,205 256 (8.8) Interview CTS2 Yes No 256 (8.8) 256 (8.8) 256 (8.8) 256 (8.8) 31 2013 Le, M. T. H. et al. 604 115 (19.2) Self-administered No Yes 8 (1.3) 5 (0.8) 115 (19.2) 115 (19.2) 115 (19.2) 32 2008 Lysova, A. V. & Douglas, E, M.156 87 (56.5) Self-administered CTS2 No No 44 (28.6) 87 (56.5) 23 (15.4) 44 (28.6) 44 (28.6) 44 (28.6) 33 2012 Lövestad, S. & Kranz, G. 173 64 (37) Self-administered CTS2 No No 14 (8.1) 64 (37) 9 (5.2) 23 (13.2) 18 (10.4) 36 (20.8) 36 (20.8) 34 2003 Murty, S. A. et al. 621 187 (30.1) Self-administered CTS Yes No 29 (4.7) 187 (30.1) 29 (4.7) 29 (4.7) 29 (4.7) 35 2017 Norris, A. H. et al. 158 30 (19) Self-administered CTS No No 30 (19) 30 (19) 30 (19) 30 (19) 36 2013 Nybergh, L. et al. 399 102 (25.6) Self-administered No No 29 (7.6) 92 (24) 9 (2.3) 102 (25.6) 61 (15.3) 102 (25.6) 102 (25.6) 37 2007 Obi, S. N. & Ozumba, B. C. 600 35 (5.8) Interview No No 35 (5.8) 35 (5.8) 35 (5.8) 35 (5.8) 38 2008 O’Leary, K.D. et al. 558 48 (8.6) Self-administered No Yes 48 (8.6) 32 (5.8) 47 (8.6) 48 (8.6) 48 (8.6) 39 2004 Parish, W. L. et al. 1,658 298 (18) Self-administered Yes Yes 298 (18) 298 (18) 298 (18) 298 (18) 40 2006 Paul et al. 98 89 (91) Self-administered No Yes 52 (54) 89 (91) 52 (54) 52 (54) 52 (54) 41 2008 Reid, R. J. et al. 420 121 (28.8) Interview BRFSS Yes No 73 (17.4) 121 (28.8) 44 (10.4) 121 (28.8) 121 (28.8) 121 (28.8) 42 2011 Robertson, K. & Tamar, M. 30 6 (20) Self-administered CTS2 No No 6 (20) 6 (20) 6 (20) 6 (20)
43 2008 Straus, M. A. 3,944 1262 (32) self-administered CTS2 No Yes 1262 (32) 1262 (32) 231 (35.2) 241 (36.8) 172 (26.2) 201 (30.6) 231 (35.3) 173 (26.4) 1262 (32) 44 2017 Tharp, A. T. et al. 1,268 367 (28.9) Self-administered SDVS No No 367 (28.9) 367 (28.9) 367 (28.9) 367 (28.9) 45 2013 Verduin, F. et al. 130 22 (17) Self-administered CTS2 No No 22 (17) 22 (17) 22 (17) 22 (17) 46 2012 Waller, M. W. et al. 3,197 703 (22) Self-administered Yes Yes 501 (15.7) 205 (6.4) 703 (22) 703 (22) 703 (22) 47 2016 Watt, M. et al. 201 81 (40) Self-administered CTS2 No No 81 (40) 63 (31) 81 (40) 81 (40) 81 (40) 48 2009 Wubs, A. G. et al. 2,733 571 (20.9) Self-administered CTS No No 571 (20.9) 571 (20.9) 571 (20.9) 571 (20.9) 49 2014 Zhang, H. et al. 625 58 (9.2) Interview AAS No Yes 58 (9.2) 28 (4.5) 58 (9.2) 58 (9.2) 58 (9.2)
Total summary score: 108,589 19144 (17.6) 11823 (12.1) 6521 (27.5) 3001 (5.4) 1576 (22.6) 7709 (9.7) 11684 (16.7) 477 (21.2) 2563 (17.3) 2734 (24.1) 240 (10.6) 2863 (13.0) 9011 (17.2) 530 (11.2) 17284 (16.6) 287 (15.1) Prevalence rate, n (%) By population Prevalence rate, n (%) By type of assault Ye ar Au th or Po pu lat io n siz e To ta l p re va le nc e ra te n (% ) Su rve y m et ho d In str um en t Re pr es en ta tive sa m pl e Re sp on se ra te ab ove 7 0% # Prevalence rate, n (%) Time-frame Prevalence rate, n (%) By continent/origin
(1.1.2)
In order to investigate the relationship between definition of IPV and the prevalence rate, a regression analysis has been performed. The multiple linear regression analysis can quantify the effect of introducing CTS as an instrument, while keeping all other independent variables constant. Descriptive statistics for the variables in the regression model are presented below.
Table 4. Frequencies for the dependent and independent variables
Dependent variable (interval variable)
Descriptive statistics
IPV prevalence rate
Average: 31.1% Median: 22.0% Min: 0% Max: 95.7% Independent variables (nominal variables) Frequencies Survey method Self-administration 61.2%
Interview and not def. 38.8%
Instrument
CTS 53.1%
Other 46.9%
Type of assault
Psychological 30.6%
Physical, sexual and not def. 69.4% Time frame
Short term 61.2%
Long term and not def. 38.8%
Continent Western countries 59.2% Non-Western countries 40.8% Representative sample Yes 28.6% No 71.4% Response rate Below 70% (low) 63.3% Above 70% (high) 36.7%
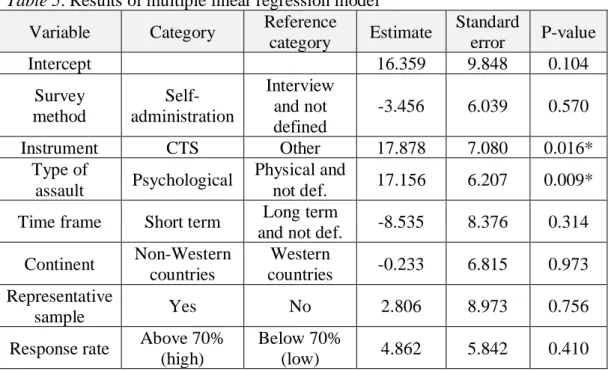
Table 5. Results of multiple linear regression model
Variable Category Reference
category Estimate Standard error P-value Intercept 16.359 9.848 0.104 Survey method Self-administration Interview and not defined -3.456 6.039 0.570 Instrument CTS Other 17.878 7.080 0.016* Type of assault Psychological Physical and not def. 17.156 6.207 0.009*
Time frame Short term Long term
and not def. -8.535 8.376 0.314
Continent Non-Western countries Western countries -0.233 6.815 0.973 Representative sample Yes No 2.806 8.973 0.756
Response rate Above 70% (high)
Below 70%
(low) 4.862 5.842 0.410
Note: * indicates significance at 5%-level.
49 studies (observations) were included in the regression analysis.
CTS as a survey instrument is a way of defining intimate partner violence. The introduction of CTS has a significant positive effect on the prevalence rate
according to the results of the multiple linear regression models. The introduction of CTS will on average cause a 17.9%-points increase in the prevalence rate, when keeping other independent variables constant.
Type of assault is another element in the definition of intimate partner violence. The inclusion of psychological violence as part of a survey causes an average increase of 17.2%-points to the prevalence rate. These results are significant at a 5%-level.
No significant effect was found between the other methodological factors and the prevalence rate.
The number of items in a survey is another element in the operationalization of definition of IPV. The number of survey items was not included in the multiple linear regression model due missing values in many studies. To avoid a critical reduction in the number of observations in the multiple linear regressions, the relationship between survey items and prevalence rate has been investigated in a univariate linear regression analysis. There are 32 studies with information on survey items, and the number of survey items spans from 1 to 78 with mean=15 and median=8. The number of survey items has a significant positive effect on the prevalence rate, and adding 10 additional items will on average cause a 7%-points increase in the prevalence rate. This result is significant at a 1%-level.
(1.1.3)
The relationship between the quality of studies and the prevalence rate has already been partly analysed in the multiple linear regression analysis. Response rate and representative sample are part of the overall study quality index, but table 5 above reveals that high response rate and a representative sample has no significant effect on the prevalence rate.
The quality score index constructed from 8 different quality parameters is an ordinal variable, and the relationship between this quality score and the
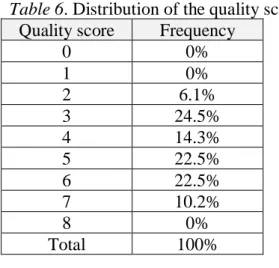
prevalence rate has been analysed in a univariate linear regression analysis. The regression found no significant relationship between quality score and prevalence rate at a 5%-level. For distribution of the quality score see table 6.
Table 6. Distribution of the quality score
Quality score Frequency
0 0% 1 0% 2 6.1% 3 24.5% 4 14.3% 5 22.5% 6 22.5% 7 10.2% 8 0% Total 100%
4. DISCUSSION
As stated earlier in the thesis, it is a challenge to measure the effect of definition, as the definitions used in the included studies are rather broad and very little concrete. This has made it necessary with more tangible measures operationalized as the three variables, types of violence, instrument and number of items. This study finds that the definition of intimate partner violence, when looking at all three variables, has a significant effect on the prevalence rate.
To be more concrete introducing psychological violence as a part of the definition in a study significantly increases the prevalence rate compared to studies only including physical and/or sexual violence in the definition. This is further supported by results showing significant differences in prevalence rates between psychological and physical and/or sexual violence. This is in contrast to studies on female victims of IPV, which shows that women are more often victims of
physical violence (Delara, 2016). Gender differences in the reporting of IPV has been observed in other studies, where women are more often exposed to severe violence and injury (Swan, 2008).
The results in this thesis also indicate, that the introduction of the CTS increases the prevalence rate for male victims of IPV. This is in accordance with research showing that male populations have a tendency to over-report IPV victimization when using the CTS (Ackerman, 2018).
The regression analysis also reveals that the number of survey items/questions is positively related to the prevalence rate for male victims of IPV. However no earlier research has been found to either support or contradict the results. The CTS and the number of survey questions is a way of defining IPV, and therefore the definition of IPV seems to influence the prevalence rate.
This thesis also finds, that study quality does not have significant influence on the prevalence rates.
The results in this thesis must be interpreted with great caution, because of the many critical methodological problems related to this thesis. One of the primary methodological problems relates to the great variance in the definition of IPV and other methodological characteristics in the 49 studies. The differences cause a large amount of heterogeneity in prevalence rates between studies, which decreases the reliability of the pooled prevalence.
Furthermore, the data in this thesis is based on survey-data from 49 different studies. Some surveys leads to over- or under-reporting due to the sensitivity of the subject of intimate partner violence. This potential bias in the survey data reduces the validity of the results in this thesis. Several mitigating actions have been taking in the literature searching process in order to ensure uniformity and high data quality, but few studies within the area of male victims of IPV has made it difficult to set up high quality standard in the study selection process.
About half of the studies included in this thesis have used the CTS as their instrument. However, a part to be aware of in relation to the CTS is, that even in studies using the same CTS instrument, it varies how many of the possible items there are used and which ones. Only a minority of studies specified what specific questions they were using, which makes it hard to do a comprehensive analysis on this. In the absence of thorough data, a univariate linear regression analysis with the number of items used as the independent variable and prevalence rate as dependent variable was constructed. This thesis found that the number of items listed in a survey, has a significant positive effect on the prevalence rate. This is in accordance with earlier research showing that it is important that the specific abusive act, experienced by the respondents, is available in the instrument, in order to uncover all victims of IPV. And so it makes sense that the more items you ask, the higher is the probability that an individual will recognize the act described. The regression analysis however does not take into account the content of the items, due to insufficient data in the included studies. This is highly
relevant as earlier research has shown that broad and open-ended questions will increase the likelihood of a positive score, and that the formulation of the questions can have an effect on the willingness to answer (Waltermaurer, 2005; Schwartz, 2000) Furthermore whether the constructed items consist of questions that in fact covers abusive acts is also a relevant distinction to make, as the items in IPV instruments in general are very different and of varying severity (Buzawa & Buzawa, 2002). At least one of the included studies in this review (Fergusson et al., 2005) has earlier been criticized for including items that could hardly be characterized as violence, resulting in a to high prevalence rate (Johnson, 2005). This issue might cause people to trivialize the term of intimate partner violence (DeKeseredy, 2000).
This leads forward to a discussion about whether it is to simple to categorize specific acts as violence without taking into account the context and intention, which is what the CTS has been critized for (Dobash & Dobash, 2004). Research has proposed that a great deal of the male victims are victims of self defence from the female perpetrator or only victim of bidirectional minor violence, in contrast to female victims who suffers more severe violence. Furthermore evidence show that a substantial amount of the men who scores positive on a specific item does not find the act abusive even though they get registered as victims. And in another study 85 % of male IPV victims reported no fear in relation to the violence, whereas 70 % of the female IPV victims reported being very frightened (Caldwell et al., 2012). This indicates that the simplified distinction between violence or not
violence and thus victim or not victim, might be too simplified. However only a small fraction of the included studies evaluates on context, making it hard to do reliable analyses on, and thus something beyond this thesis.
As stated earlier, the definition of IPV consist of two interpretative parts, intimate partner and violence. The definition of the violence, has in this study, been
covered by and operationalized by the three variables, type of violence, instrument and number of items. However the part of the definition covering intimate partner has not been operationalized into an analysis in this study. The reason for this is that the formulations regarding intimate partner has been too vague and scattered to make categories that makes sense. However only the fact that the definitions are this vague and scattered calls for further research and focus on making the definition of intimate partner more concrete and homogenous. In the multivariate regression analysis survey method (self-administered or interview) does not influence the prevalence rate significantly. This however is in contrast to the general research, which shows that using interviews instead of self-administration significantly increases the prevalence rate (Hamby et al., 1996; McFarlane et al., 1991). The explanation for this is that people in
self-administered surveys tend to misinterpret questions in a neglecting way causing them to underreport IPV (Randle & Graham, 2001). However this, as most other research of IPV, is made on female respondents.
This systematic review is naturally limited by the quality of the included studies. In almost all of the included studies the male prevalence is a secondary part of the study, which makes the available data less detailed. Furthermore the backbone of this study has been a very broad definition of IPV by WHO and no
methodological characteristics, other than register studies and homosexual relationships has been excluded. These conditions has allowed a wide range of studies with a great amount of variation in methodological characteristics and great deal of variation in detail of available data. This is visually quite clear when taking a look at table 3. The main consequence of this is that it makes comparison between studies very difficult, and the statistical analysis less reliable.
Given the great variability between studies, it has been necessary to do some crude categorisations. The most evident is the division of countries into continents and in the case of the multiple linear regressions, even division of continents into western vs. non-western continents. This is a huge simplification that poses a big limitation. Some even argue that it is wrong to look at whole countries or even cites under one, as there can be substantial cultural differences within ethnical groups (Tjaden & Thoennes, 2000; Straus & Gelles, 1986). Another example of simplification is the division of instrument into the categories of CTS versus all other, which is very generalising. However as stated earlier this was necessary in order to limit the complexity of the multiple linear regression model.
In the area of how definition and other methodological factors affect the prevalence, there is a great shortcoming of research, which makes it hard to validate the results. This is further limited by the fact that most of the available research is made on female victims, making it hard generalizing the results to male victims.
As a conclusion this study shows that psychological violence is the most
occurring type of violence among male victims of IPV. Furthermore it is clear that the definition of IPV has a significant effect on the prevalence of IPV and thus an important part to be aware of when conducting and assessing prevalence studies of IPV. However the simple understanding of IPV as physical, psychological and sexual violence, without a focus on what specific acts this covers, might be to simplified in order to take account for other factors responsible for the complexity of IPV and the measurement of it.
Future research should strive towards agreement on more consistent definitions and on the basis of this the measurement of IPV. This is essential in order to make it easier to compare studies across time and place and construct better statistical analyses. Hopefully this will contribute to the creation of more reliable and valid prevalence rates among male victims of IPV, which is paramount in the research of this area.
5. REFERENCES
Ackerman, J. (2018). Assessing Conflict Tactics Scale validity by examining intimate partner violence overreporting. Psychology of Violence, 8(2), 207-217. Alhabib, S., Nor, U. & Jones, R. (2009). Domestic Violence Against Women: Systematic Review of Prevalence Studies.
Allen, C. T., Swan, S. C. & Raghavan, C. (2009). Gender symmetry, Sexism, and Intimate Partner Violence.
Amanor-Boadu, Y., Stith, S. M., Miller, M. S., Cook, J., Allen, L. & Gorzek, M. (2011). Impact of Dating Violence on Male and Female College Students. Anderson, K. L. (2002). Perpetrator or victim? Relationships Between Intimate Partner Violence and Well-Being.
Andersson, N., Ho-Foster, A., Mitchell, S., Scheepers, E., & Goldstein, S. (2007). Risk factors for domestic physical violence: National cross-sectional household surveys in eight southern African countries. BMC Women’s Health, 7, 11.
Archer, J. (2000). Sex differences in aggression between heterosexual partners: A meta analytic review.
Baker, C. K., Norris, F.H., Diaz, D. M. V., Perilla, J.L., Murphy, A. D., Hill, E. G. (2005). Violence and PTSD in Mexico. Soc Psychiatry Psychiatr Epidemiol 40:519–528.
Balsam, K. F., Rothblum, E. D. & Beauchaine, T. P. (2005) Victimization over the life span: A comparison of lesbian, gay, bisexual, and heterosexual siblings. Barros, C. R. D.S. & Schraibe, L. B. (2017). Intimate partner violence reported by female and male users of healthcare units. Universidade Católica de Santos. Santos, SP, Brasil.
Birkler, J. (2005). Videnskabsteori. København: Munksgaard Danmark, 2005. Blodgett, C. & Lanigan, J. D. (2017). The Prevalence and Consequences of Intimate Partner Violence Intrusion in the Workplace.
Breiding, M. J., Black, M. C. & Ryan, G. W. (2008). Prevalence and risk factors of intimate partner violence in eighteen U.S. states/territories, 2005.
Breiding, M. J., Smith, S.G., Basile, K.C., Walters, M. T., Chen, J. & Merrick, M. T. (2011). Prevalence and Characteristics of Sexual Violence, Stalking, and Intimate Partner Violence Victimization.
Buzawa, E. S. & Buzawa, C. G. (2002). Defining and Measuring Domestic Violence and Its Impact. Chapter 2. Domestic Violence : The Criminal Justice Response.
Caldwell, J. E., Swan, S. C. & Woodbrown, D. E. (2012). Gender Differences in Intimate Partner Violence Outcomes.
Carmo, R., Grams, A. & Magalhaes, T. (2011). Men as victims of intimate partner violence.
Cascardi, M. & Vivian, D. (1995). Context for specific episodes of marital violence: Gender and severity of violence differences.
Centers for Disease Control and Prevention (CDC), (2017).
Cercone, J. J., Beach, S. R. H. & Arias, I. (2005). Gender Symmetry in Dating Intimate Partner Violence: Does Similar Behavior Imply Similar Constructs? Chan, K. L. (2004). Gender Symmetry in the Self-Reporting of Intimate Partner Violence.
Chan, K. L. (2008). Prevalence of dating partner violence and suicidal ideation among male and female university students worldwide.
Chan, K. L. (2011). Gender differences in self-reports of intimate partner violence: A review. Aggression and Violent Behavior,16(2), 167-175.
Chang, D. F., Shen, B. J. & Takeuchi, D. T. (2009). Prevalence and demographic correlates of intimate partner violence in Asian Americans.
Colorado-Yohar, S. M., Agudelo-Suárez, A. A., Huerta, J. M. & Torres-Cantero, A. M. (2015). Intimate Partner Violence and Its Associated Factors in a Sample of Colombian Immigrant Population in Spain.
Costa, D., Soares, J., Lindert, J., Hatzidimitriadou, E., Sundin, Ö., Toth, O., Ioannidi-Kapolo, E. & Barros, H. (2015). Intimate partner violence: a study in men and women from six European countries.
Costa, D. & Barros, H. (2016). Instruments to Assess Intimate Partner Violence: A Scoping Review of the Literature.
Dasgupta, S. D. (2002). A Framework for Understanding Women’s Use of Nonlethal Violence in Intimate Heterosexual Relationships.
DeKeseredy, W. S. (2000). Current Controversies on Defining Nonlethal Violence Against Women in Intimate Heterosexual Relationships. Delara, M. (2016). Mental Health Consequences and Risk Factors of Physical Intimate Partner Violence.
Dienve, O. P. & Gbeneol, P. K.(2009). Domestic Violence Against Men in Primary Care in Nigeria.
Dobash, R. P. & Dobash, R. E. (2004). Women's Violence to Men in Intimate Relationships: Working on a Puzzle. The British Journal of Criminology, Volume 44, Issue 3.
Duke, M. R. & Cunradi, C. B. (2011). Measuring intimate partner violence among male and female farmworkers in San Diego County, Ca.
Ellsberg, M. & Heise, L. (2005). Researching Violence Against Women: A Practical Guide for Researchers and Activists.
Felson, R. B. & Pare, R. P. (2007). Does the Criminal Justice System Treat Domestic Violence and Sexual Assault Offenders Leniently?
Fehringer, J. A. & Hindin, M. J. (2009). Like Parent, Like Child: Intergenerational Transmission of Partner Violence in Cebu, the Philippines.
Fergusson, D. M., Horwood, L. J., & Ridder, E. M. (2005). Partner Violence and mental health outcomes in a New Zealand birth cohort. Journal of Marriage and Family, 67, 1103–1119.
Flake, T. A., Barros, C., Schraiber, L. B. & Menezes, P. R. (2013). Intimate partner violence among undergraduate students of two universities of the state of São Paulo, Brazil.
Forsberg, C. & Wengström, Y. (2003). Att göra systematiska litteraturstudier. Stockholm, Sverige: Bokförlaget Natur och kultur.
Fox, K. A., Nobles, M. R. & Piquero, A. R. (2009). Gender, crime victimization and fear of crime.
Gracia, E. (2004). Unreported cases of domestic violence against women: towards an epidemiology of social silence, tolerance, and inhibition. J Epidemiol
Community Health, 58(7), 536-537.
Gass, D., Stein, D. J., Williams, D. R., & Seedat, S. (2011). Gender differences in risk for intimate partner violence among South African adults. Journal of
Interpersonal Violence,26(14), 2764–2789.
Gelles, R. J. (2000). Estimating the Incidence and Prevalence of Violence Against Women: National Data Systems and Sources
Graham, K., Bernards, S., Wilsnack, S. C. & Gmel, G. (2014). Alcohol May Not Cause Partner Violence but It Seems to Make It Worse: A Cross National
Comparison of the Relationship Between Alcohol and Severity of Partner Violence.
Grande, E. D., Hickling, J., Taylor, & Woollacott, T. (2003). Domestic violence in South Australia: A population survey of males and females. Australian and New Zealand Journal of Public Health, 27(5), 543–550.
Hamby, S. L., Poindexter, V. C., & Gray-Little, B. (1996). Four measures of partner violence: Construct similarity and classification differences. Journal of Marriage and the Family, 58(1), 127-139.
Harned M.S. (2001).‘‘Abused women or abused men? An examination of the context and outcomes of dating violence’’, Violence and Victims, Vol. 16 No. 3, pp. 269-85.
Harwell, T. S., Moore, K. R. & Spence, M. R. (2003). Physical violence, intimate partner violence, and emotional abuse among American Indian men and women in Montana. Preventive Medicine, 37 (4) (2003), pp.297-303.
Helweg-Larsen, K., Sørensen, J., Brønnum-Hansen, H. & Kruse, M. (2011). Risk factors for violence exposure and attributable healthcare costs: Results from the Danish national health interview surveys.
Hines, D. A. & Malley-Morrison, K. (2001). Psychological effects of partner abuse against men: A neglected research area.
Hines, D. A. (2007). Posttraumatic stress symptoms among men who sustain partner violence: An international multisite study of university students.
Hines, D. A. & Douglas, E. M. (2009). Women's Use of Intimate Partner Violence against Men: Prevalence, Implications, and Consequences, Journal of Aggression, Maltreatment & Trauma, 18:6, 572-586.
Johnson, M. P. & Ferraro, K. J. (2004). Research on Domestic Violence in the 1990s: Making Distinctions.
Johnson, M. P. (2005). Domestic Violence: It's Not About Gender—Or Is It? Johnson, M. P. (2006). Conflict and control: gender symmetry and asymmetry in domestic violence.
Kamimura, A., Nourian, M. M., Assasnik, N. & Franchek-Roa, K. (2016a). Intimate partner violence–related experiences and mental health among college students in Japan, Singapore, South Korea and Taiwan.
Kamimura, A., Nourian, M. M., Assasnik, N. & Franchek-Roa, K.(2016b). Depression and intimate partner violence among college students in Iran.
Khalifeh, H., Hargreaves, J., Howard, L. & Birdthistle, I. (2013). Intimate partner violence and socioeconomic deprivation in England: findings from a national cross-sectional survey. Am J Public Health 103:462–472.
Kim, J. Y., Oh, S. & Nam, S. I. (2016). Prevalence and Trends in Domestic Violence in South Korea: Findings From National Surveys.
Kingsnorth, R. F. & MacIntosh, R. C. (2007). Intimate Partner Violence: The Role of Suspect Gender in Prosecutorial Decision‐Making.
Le, M. T. H., Tran, T. D., Nguyen, H. T. & Fisher, J. (2013). Early Marriage and Intimate Partner Violence Among Adolescents and Young Adults in Viet Nam.
Loney, P., Chambers, L., Bennett, K., Roberts, J., & Stratford, P. (2000). Critical appraisal of the health research literature: prevalence or incidence of a health problem.
Lysova, A. V. & Douglas, E, M. (2008). Intimate Partner Violence Among Male and Female Russian University Students.
Lövestad, S. & Kranz, G. (2012). Men’s and women’s exposure and perpetration of partner violence: an epidemiological study from Sweden.
McFarlane, J., Christoffel, K., Bateman, L., Miller, V. & Bullock, L. (1991). Assessing for abuse: self-report versus nurse interview.
Murty, S. A., PeekAsa, C., Zwerling, C, Stromquist, A. M., Burmeister, L. F. & Merchant, J. A. (2003). Physical and emotional partner abuse reported by men and women in a rural community. American Journal of Public Health, 93 (7)(2003), pp. 1073-1075.
Norris, A. H., Decker, M. R., Weisband, Y. L. & Hindin, M. J. (2017). Reciprocal physical intimate partner violence is associated with prevalent STI/HIV among male Tanzanian migrant workers: a cross-sectional study.
Nybergh, L., Taft, C., Enander, V. & Krantz, G. (2013). Self-reported exposure to intimate partner violence among women and men in Sweden: results from a population-based survey. BMC Public Health 13:845.
Obi, S. N. & Ozumba, B. C. (2007). Factors associated with domestic violence in south-east Nigeria.
O’Leary, D. K., Tintle, N., Bromet, E. J. & Gluzman, S. F.(2008). Descriptive epidemiology of intimate partner aggression in Ukraine.
Parish, W. L., Wang, T., Laumann, E. O., Pan, S. & Luo, Y. (2004). Intimate partner violence in China: national prevalence, risk factors and associated health problems.
Paul, G., Smith, S. & Long, J. (2006). Experience of intimate partner violence among women and men attending general practices in Dublin, Ireland: A cross-sectional survey. The European Journal of General Practice,12 (2) (2006), pp. 66-69.
Pourhoseingholi, M. A., Vahedi, M. & Rahimzadeh, M. (2013). Sample size calculation in medical studies.
Randle, A. A. & Graham, C. A. (2001). A Review of the Evidence on the Effects of Intimate Partner Violence on Men.
Reid, R. J., Bonomi, A. E., Rivara, F. P., Anderson, M. L., Fichman, P. A., Carrell, D. S. & Thompson, R. S. (2008). Intimate Partner Violence Among Men: Prevalence, Chronicity, and Health Effects.
Robertson, K. & Tamar, M. (2011). Women and Men's Use of Coercive Control in Intimate Partner Violence.
Schwartz, M. (2000). Methodological issues in the use of survey data for measuring and characterizing violence against women.
Sparrow, K., Kwan, J., Howard, L., Fear, N. & MacManus, D. (2017). Systematic review of mental health disorders and intimate partner violence victimisation among military populations.
Straus, M. A. & Gelles, R. J. (1986). Societal change and change in family violence from 1975 to 1985 as revealed by two national surveys.
Straus, M. A., Hamby, S. L., Boney-McCoy, S., Sugarman, D. B. (1996). "The Revised Conflict Tactics Scales (CTS2): Development and Preliminary
Psychometric Data" (PDF). Journal of Family Issues. 17 (3): 308–309
Straus, M. A. (2008). Dominance and symmetry in partner violence by male and female university students in 32 nations. Children and Youth Services Review, 30, 252-275.
Straus, M. A. (2010). "Thirty years of denying the evidence on gender symmetry in partner violence: implications for prevention and treatment".
Swan, S. C., Gambone, L. J., Caldwell, J. E., Sullivan, T. P. & Snow, D. L. (2008). A review of research on women's use of violence with male intimate partners.
Thackeray, J. D. & Randell, K. A. (2011). Epidemiology of Intimate Partner Violence.
Tharp, A. T., McNaughton Reyes, H. L., Foshee, V., Swahn, M. H., Halla, J. E. & Logan, J. (2017). Examining the Prevalence and Predictors of Injury From
Adolescent Dating Violence.
Tjaden, P. & Thoennes, N. (2000). Prevalence, Incidence, and Consequences of Violence Against Women: Findings From the National Violence Against Women Survey.
Verduin, F., Engelhard, E. A. N., Rutayisire, T., Stronks, K. & Scholte, W. F. (2013). Intimate Partner Violence in Rwanda: The Mental Health of Victims and Perpetrators.
Wager, E. & Wiffen, P. J. (2011). Ethical issues in preparing and publishing systematic reviews.
Waller, M. W., Iritani, B. J., Flewelling, R. L., Christ, S. L., Halpern, C. T. & Moracco, K. E. (2012). Violence Victimization of Young Men in Heterosexual Relationships: Does Alcohol Outlet Density Influence Outcomes?
Waltermaurer, E. (2005). Measuring intimate partner violence (IPV): you may only get what you ask for.
Watt, M. H., Guidera, K. E., Hobkirk, A. L., Skinner, D. & Meade, C. S. (2016). Intimate partner violence among men and women who use methamphetamine: A mixed‐methods study in South Africa.
WHO (2002); Krug, E. G., Dahlberg, L. L., Mercy, J. A., Zwi, A. B. & Lozano, R. World report on violence and health.
WHO, (2013). Global and regional estimates of violence against women:
prevalence and health effects of intimate partner violence and non-partner sexual violence.
Wubs, A. G., Aarø, L. E., Flisher, A. J., Bastien, S., Onya, H. E., Kaaya, S. & Mathews, C. (2009). Dating violence among school students in Tanzania and South Africa: Prevalence and socio-demographic variations.
Zhang, H., Wong, W. C. W., Ip, P., Fan, S. & Yip, P. S. F. (2014). Intimate Partner Violence Among Hong Kong Young Adults: Prevalence, Risk Factors, and Associated Health Problems.