THESIS
ADVANCED CONTROL TECHNIQUES AND SENSORS FOR GAS ENGINES WITH NSCR
Submitted by John Gattoni
Department of Mechanical Engineering
In partial fulfillment of the requirements For the Degree of Master of Science
Colorado State University Fort Collins, Colorado
Spring 2012
Master’s Committee:
Advisor: Daniel Olsen Anthony Marchese Peter Young
Copyright by John Mario Gattoni 2012 All Rights Reserve
ii ABSTRACT
ADVANCED CONTROL TECHNIQUES AND SENSORS FOR GAS ENGINES WITH NSCR
High exhaust emissions reduction efficiency from an Internal Combustion Engine (ICE) utilizing a Non Selective Catalyst Reduction (NSCR) catalyst system requires complex fuel control strategies. The allowable equivalence ratio operating range is very narrow where NSCR systems achieve simultaneous reduction of Carbon Monoxide (CO), Nitrogen Oxides (NOx), Total Hydrocarbons (THC), Volatile Organic Compounds (VOC’s), and formaldehyde (CH2O). This range is difficult to maintain as transients are introduced into the system. Current fuel control technologies utilizing lambda sensor feedback are reported to be unable to sustain these demands for extended operation periods. Lambda sensor accuracy is the critical issue with current fuel controllers.
The goal of this project was to develop a minimization control algorithm utilizing a Continental NOx sensor installed downstream of the NSCR catalyst system for feedback air/fuel ratio control. When the engine is operated under lean conditions, NOx is produced in the engine out exhaust emissions and the NOx sensor responds accordingly. When the engine is operated under rich burn conditions, the NSCR catalyst system produces Ammonia (NH3). NOx sensors have a cross sensitivity to NH3 and will respond as though it has been exposed to NOx. This behavior provides a unique control strategy that allows lambda sensor calibration to be ignored. Testing was performed on a Cummins-Onan Generator Set, model GGHD 60HZ, capable of a power output of 100kW at standard ambient air conditions. The engine was
iii
reconfigured to operate utilizing an electronic gas carburetor (EGC2) with lambda sensor feedback, manufactured by Continental Controls Corporation (CCC) and a high reduction efficiency NSCR catalyst system manufactured by DCL International. A Data Acquisition (DAQ) system manufactured by National Instruments (NI) acquired the NOx sensor output. The control algorithm was programmed utilizing a LabVIEW interface and a feed forward command was executed through the NI DAQ system to the CCC EGC2 where the fuel trim adjustment was physically made.
Exhaust gas species measurements were acquired via a Rosemount 5-gas analyzer and a
Nicolet 6700 FTIR. Fuel composition was acquired utilizing a Varian CP-4900 Micro GC and Air Fuel Ratio (AFR) was obtained with an ECM AFRecorder 4800R. Results utilizing NOx sensor feedback control revealed that under steady state operating conditions, improvements in emissions reduction efficiency of CO, NOx, and THC were significant. The system was also evaluated during load and fuel composition transients.
iv
ACKNOWLEDGEMENTS
Many people were involved throughout the project by providing guidance, technical support and help with various portions of the developmental process. First and foremost, I would like to send many thanks to my advisor Dr. Daniel Olsen who I immediately worked with on a regular basis to achieve all tasks of the project. His expertise and patience was of great value and a wealth of knowledge was passed onto me, aiding towards the successful
completion within the desired time period. Additional thanks to Dr. Anthony Marchese and Dr. Peter Young for serving on the thesis committee for this project.
Kirk Evans, Engineering Manager at the Engines and Energy Conversion Lab (EECL) performed the LabVIEW programming for the NOx sensor control algorithm and exhaust emissions measurements. He also provided technical support as needed throughout the project during all phases. Research Engineer at the EECL Cory Kreutzer was available for technical support and control room assistance. Research Engineer Philip Bacon provided guidance during the engine reconfiguration process. Post graduate student Christian L-Orange was indispensable as he provided guidance in many areas including instrumentation selection, control room operations, and thesis writing advice. Undergraduate student Cory Degroot provided additional engine emissions testing support. Undergraduate students Benjamin Neuner and Darryl Beemer aided with the installation of the catalyst assembly and tap water plumbing for the intercooler setup, respectively.
The main funding source for the project was the California Energy Commission (CEC) with additional funding from Pipeline Research Counsil International (PRCI). Donations in kind
v
for the EGC2 electronic fuel control system and required hardware, and the NSCR catalyst system were provided from Continental Controls Corporation (CCC) and DCL International, respectively. Additional technical assistance was provided from Continental Controls
Corporation. Vice President Rick Fisher and Electrical Engineer Hillary Grimes were nice enough to fly out to the EECL to personally see through the installation of the CCC EGC2 electronic carburetor. Hillary performed a large portion of the wiring required for their hardware to operate correctly. He was also very patient and enthusiastic to answer all technical questions we had throughout the project. Joe Aleixo from DCL International provided technical assistance in regards to the NSCR catalyst assembly.
vi TABLE OF CONTENTS
ABSTRACT ... ii
ACKNOWLEDGEMENTS ... iv
LIST OF FIGURES ...viii
LIST OF TABLES ... x
LIST OF ABBREVIATIONS ... xi
1. Introduction ... 1
1.1 Motivation for Research ... 1
1.2 Spark-Ignition Natural Gas Exhaust Emissions ... 2
1.3 Spark-Ignition Natural Gas Emissions Regulations ... 4
1.4 Response to Emissions Regulations... 5
2. Literature Review ... 7
2.1 Current Fuel Control Techniques ... 7
2.2 Exhaust Gas Treatment ... 9
2.3 NOx Sensor Construction and Operation ... 13
2.4 Minimization Control Algorithms ... 15
3. Experimental Setup and Procedures ... 18
3.1 Generator Set Specifications ... 18
3.2 Continental Controls EGC2 Carburetor... 20
3.3 Continental Controls Catalyst Monitor ... 23
3.4 DCL Catalyst ... 24
3.5 Turbocharger After-cooler ... 26
3.6 NOx Sensor Systems ... 28
3.7 Data Acquisition ... 30
3.8 CCC EGC2 and Catalyst Monitor Calibration and Software ... 31
3.9 Test Procedure (Steady State and Transient) ... 35
3.10 Control Room Analyzers and Preparation ... 37
4. Baseline NSCR Control Results ... 44
4.1 Gas Chromatograph Analysis ... 44
vii
4.3 Equivalence Ratio Sweep ... 49
4.4 Load Sweep (Steady State and Transient) ... 52
4.5 Transient Propane Injection ... 56
4.6 Exhaust Back Pressure Transient ... 59
5. NSCR Control with NOx Sensor Feedback ... 61
5.1 Control Algorithm Development ... 61
5.2 Test Results ... 64
6. Summary and Conclusions ... 74
6.1 Recommendations for Future Work ... 75
REFERENCES ... 78
Appendix I – Experimental Setup and Hardware ... 82
Appendix II – Baseline Testing ... 94
viii LIST OF FIGURES
Figure 1-1: Typical NOx, HC, and CO trends with respect to equivalence ratio in a gasoline SI
engine (Heywood 1998) ...4
Figure 2-1: Typical NSCR catalyst light off curves (Johnson Matthey Catalysts) ...9
Figure 2-2: ZrO2 NOx sensor construction and operation (Continental 2008) ...14
Figure 2-3: Golden section algorithm example ...15
Figure 3-1: Original engine configuration ...19
Figure 3-2: CCC EGC2 installed ...22
Figure 3-3: CCC Catalyst Monitor control logic (Continental Controls Corporation 2010) ...24
Figure 3-4: DCL International catalyst chosen for the project ...25
Figure 3-5: Intercooler installed and plumbed for air and water ...28
Figure 3-6: Continental Smart NOx sensor (Continental 2008) ...30
Figure 3-7: Valve Viewer software graphical user interface ...32
Figure 3-8: Catalyst Monitor Viewer software graphical user interface ...33
Figure 3-9: Rosemount 5-gas analyzer rack ...39
Figure 3-10: Nicolet 6700 FTIR ...40
Figure 3-11: Varian CP-4900 Micro GC...41
Figure 3-12: ECM AFRecorder 4800R ...42
Figure 4-1: Generator Efficiency vs. Electrical Power Output (Onan Corporation 2001b) ...46
Figure 4-2: Pre catalyst exhaust emissions concentrations (ppm) with respect to equivalence ratio ...51
Figure 4-3: Post catalyst exhaust emissions concentrations (ppm) with respect to equivalence ratio ...51
ix
Figure 4-4: Exhaust emissions reduction efficiency with respect to engine load, using lambda
feedback ...53
Figure 4-5: Exhaust emissions reduction efficiency with respect to post catalyst temperature ..54
Figure 4-6: Exhaust emissions concentration (ppm) for load transient ...55
Figure 4-7: Pre and post catalyst temperatures for load transient ...56
Figure 4-8: Propane blending transient with lambda feedback control ...58
Figure 4-9: Exhaust back pressure transient ...60
Figure 5-1: Continental NOx sensor behavior with respect to lambda ...62
Figure 5-2: Minimization control algorithm flow chart and logic for NOx sensor feedback control ...64
Figure 5-3: NOx sensor closed loop operation turned on at rich starting point ...65
Figure 5-4: NOx sensor closed loop operation turned on at lean starting point ...66
Figure 5-5: NOx sensor and exhaust emissions response for manual lean to rich sweep ...67
Figure 5-6: NOx sensor and exhaust emissions response for manual rich to lean sweep ...68
Figure 5-7: Exhaust emissions reduction efficiency with respect to engine load, with NOx sensor feedback control ...69
Figure 5-8: Load transient with closed loop NOx sensor feedback ...72
x LIST OF TABLES
Table 1-1: CARB 2007 Fossil Fuel Emission Standards ...5
Table 2-1: Major components in regards to construction and functionality of exhaust gas treatment systems (BASF Corporation), (DCL International 2009), (Heywood 1998), (Navarro 2008), (Pulkrabek 2004), (Schmitt 2010) ...11
Table 2-2: Main chemical kinetic reactions that occur across a 3-way catalyst (DCL International 2009) ...12
Table 3-1: Engine specifications ...18
Table 3-2: Instrumentation list of all sensors installed to monitor and provide feedback from the engine configuration and the corresponding NI module ...31
Table 3-3: CCC EGC2 carburetor settings ...34
Table 3-4: Exhaust gas species characterized, methods, and devices used ...43
Table 4-1: Variables for BSE calculations ...48
Table 4-2: CCC EGC2 carburetor target AFR, calculated recorded AFR via ECM AFRecorder 4800R, and corresponding equivalence ratio...50
Table 4-3: Propane blending target flow rate (SCFH), actual molar concentration (%), and calculated stoichiometric AFR ...57
Table 5-1: Control algorithm variables ...62
Table 5-2: Post catalyst BSE (g/bkW-hr) and reduction efficiency (%) for steady state load sweep. Comparison of lambda versus NOx sensor feedback control is displayed, as well as reduction efficiency improvement (%) ...70
xi
LIST OF ABBREVIATIONS
AFR – Air Fuel Ratio
BSE – Brake Specific Emissions BHP – Brake Horsepower
CCC – Continental Controls Corporation CH2O – Formaldehyde
CI – Compression Ignition
CM – Chemiluminescence Method CO – Carbon Monoxide
CO2 – Carbon Dioxide DAQ – Data Acquisition DG – Distributed Generation ECU – Electronic Control Unit
ECM – Engine Controls and Monitoring
EECL – Engines and Energy Conversion Laboratory EGC – Electronic Gas Carburetor
FID – Flame Ionization Detection GUI – Graphical User Interface H2O – Water
HAP – Hazardous Air Pollutant ICE – Internal Combustion Engine IR – Infrared Radiation
xii
NESHAP – National Emissions Standards for Hazardous Air Pollutants
NH3 – Ammonia
NI – National Instruments NO – Nitric Oxide
NO2 – Nitrogen Dioxide NOx – Nitric Oxides
NSCR – Non Selective Catalyst Reduction NSPS – New Source Performance Standards
O2 – Oxygen
O3 – Ozone
PID – Proportional Integral Derivative SEGO – Simulated Exhaust Gas Oxygen SI – Spark Ignition
SOx – Sulfuric Oxides
STP – Standard Temperature and Pressure THC – Total Hydrocarbons
VOC – Volatile Organic Compound VRSS – Variable Reluctor Speed Sensor YSZ – Yttria Stabilized Zirconia
1
1.
Introduction
1.1 Motivation for Research
Stationary reciprocating Internal Combustion Engines (ICE’s) are used in a variety of applications including electrical power generation, gas compression, and liquid pumping. These systems require regular system calibration in order to meet exhaust emissions regulations. In order to accomplish this, expensive mobile exhaust emissions testing equipment must be transported to the site and setup. The engine is run and the fuel delivery system is adjusted until an optimum equivalence ratio (Φ) is achieved, minimizing exhaust emissions for the given application. Non Selective Catalyst Reduction (NSCR) catalyst systems are employed on
stoichiometric, stationary ICE’s. These systems are most effective in stoichiometric Spark Ignited (SI) engines. When controlled properly they simultaneously reduce Nitric Oxides (NOx), Carbon Monoxide (CO), Total Hydrocarbons (THC), Volatile Organic Compounds (VOC’s), and formaldehyde (CH2O) (DCL International 2009).
Proper NSCR catalyst system functionality requires that the equivalence ratio (Φ) be precisely controlled within a narrow range near stoichiometric conditions (Amadu and Olsen 2008). As emissions regulations are lowered, fuel control technologies must evolve accordingly. Long term stability of air/fuel ratio (AFR) control systems to maintain the required equivalence ratio range has not been established for stationary ICE’s. Two aspects that make long term stability difficult are requirements for continuous operation and variable fuel quality. Many
2
control systems utilize lambda sensor feedback for equivalence ratio control; however, research suggests that the lambda sensor calibration drifts, leading to a shift outside of the narrow control range (Nuss-Warren and Hohn 2011). The use of additional instrumentation for feedback fuel control such as a NOx sensor has been investigated (Vronay et al. 2010), leading to the evolution of this project.
1.2 Spark-Ignition Natural Gas Exhaust Emissions
Natural gas, which is primarily composed of methane (CH4), is considered one of the most promising alternative fuels to meet strict engine emission regulations in many countries.
Natural gas has relatively wide flammability limits, allowing natural gas engines to be operated in a large range of lean, stoichiometric, and rich burn conditions. The operating equivalence ratio and exhaust after treatment system employed generally characterizes the engine exhaust emissions (Cho and He 2007). The main engine out exhaust pollutants are NOx, CO, and VOC’s. Other pollutants, such as Sulfuric Oxides and Particulate Matter (PM) are not a concern for SI natural gas engines. The sulfur content of the fuel dictates emissions of sulfur compounds and is predominantly in the form of SO2. PM is emitted mainly in compression Ignition (CI) engines using liquid fuels (Energy and Environmental Analysis 2008).
NOx emissions are primarily composed of Nitric Oxide (NO) and Nitrogen Dioxide (NO2). NOx is typically reported either as parts per million (ppm), as a mass flow rate (lbs/hr), or in reference to engine power (g/bhp-hr or g/bkW-hr). NOx levels vary based on equivalence ratio and combustion temperature, which are related to each other. The lowest engine out NOx emissions in SI natural gas engines occur when operating under extreme lean burn conditions
3
(Φ < 1), close to the flammability limit, due to the low combustion chamber temperatures (Korakianitis 2009). The tradeoff is an increase in engine out CO and THC emissions due to slower flame initiation and propagation at extreme lean burn conditions (Cho and He 2007).
High CO and THC engine out exhaust emissions are produced under rich burn conditions (Φ > 1) due to insufficient oxygen to fully oxidize the fuel. Exhaust residence time, reaction quenching in the exhaust process, and cooling at the combustion chamber walls also contribute to incomplete combustion and increased CO and THC concentration (Energy and Environmental Analysis 2008), (Cho and He 2007). At the same equivalence ratio, natural gas SI engines can produce CO2 levels lower than that of diesel engines. Natural gas can also produce more than 20% lower CO2 levels than gasoline engines at equal power due to basic stoichiometry
(Korakianitis 2009). The typical trends of NOx, THC, and CO with respect to equivalence ratio are displayed in Figure 1-1. This is based on a SI engine running standard gasoline fuel, however, the trends are very similar for natural gas.
4
Figure 1-1: Typical NOx, HC, and CO trends with respect to equivalence ratio in a gasoline SI engine (Heywood 1998)
1.3 Spark-Ignition Natural Gas Emissions Regulations
Air quality has been a concern in the US for over 50 years. Emissions standards for automobiles were introduced initially in California and then nationwide in the United States shortly after, starting in the early 1960s (Heywood 1998). Growing concern with internal combustion engine exhaust emissions has resulted in the implementation of strict emission regulations in many automotive and industrial fields in the United States and Europe. There are separate emissions regulations corresponding to engine type and size, application and fuel being used. National Emission Standards for Hazardous Air Pollutants (NESHAP) for
5
Protection Agency (EPA). Docket ID No. EPA-HQ-OAR-2008-0708, FRL-9277-3 details the new RICE emissions requirements for Hazardous Air Pollutants (HAP’s) set forth on March 9th, 2011 (US EPA 2011). New Source Performance Standards (NSPS) describes the national emissions standards for stationary SI ICE’s with regards to NOx, CO, and VOC’s. Docket ID No. EPA–HQ– OAR–2005–0030, FRL-8512-4 details the emissions standards which were made effective as of March 18th, 2008 (US EPA 2011).
The California Air Resources Board (CARB) also imposes their own set of emissions standards for various ICE platforms in the state of California. In particular, the CARB 2007 distributed generation (DG) certification program requires manufacturers of electrical generation technologies to meet specific emission standards before they can be sold in
California starting on or after January 1, 2007. Any DG unit subject to this regulation burning a fossil fuel source must be certified pursuant to section 94204 to the following set of standards shown in Table 1-1 (CEPA ARB 2007).
Table 1-1: CARB 2007 Fossil Fuel Emission Standards
Pollutant Emission Standard (lb/MW-hr) g/bhp-hr g/kW-hr
NOx 0.07 0.024 0.032
CO 0.1 0.034 0.045
VOC’s 0.02 0.007 0.009
1.4 Response to Emissions Regulations
The emissions signature of natural gas SI engines has improved significantly over the last 10 years by improved design and control of the combustion process and advancements in catalyst systems. Controlling the fuel delivery to a specified equivalence ratio is the best
6
approach to tailoring the engine out exhaust emissions; however, there are tradeoffs to each approach. The 1st approach is to adjust to extreme lean burn conditions to achieve the lowest NOx concentration, with the possibility of increased CO and THC emissions. The 2nd approach is to find an optimal balance between emissions and efficiency. The 3rd approach is to design for the highest efficiency and use an exhaust after treatment system. The 3rd approach is widely accepted as the most effective way of reducing exhaust emissions without sacrificing thermal efficiency (Energy and Environmental Analysis 2008).
The exhaust after treatment system is typically coupled to the application based on if the engine operates under lean burn or stoichiometric burn. In order to meet extremely low emissions regulations, like CARB 2007, with lean burn engines, a rather complex NOx reduction after treatment system is required, such as a Selective Catalyst Reduction (SCR) method or a NOx trap system (Energy and Environmental Analysis 2008). Lean burn operating limits are dependent on ignition timing and energy, combustion chamber geometry, and turbulence. The addition of an Exhaust Gas Recirculation (EGR) system not only reduces combustion
temperatures leading to a decrease in NOx concentration, but results in better fuel economy at stoichiometric SI operating conditions.
Stoichiometric SI natural gas engines equipped with a NSCR catalyst can meet future emissions demands, but requires very precise AFR control strategies and highly efficient catalyst systems. A heated O2 sensor is used as feedback to maintain precise AFR control, promoting high NSCR catalyst activity, ultimately leading to high emissions reduction of NOx, CO, and VOC’s (Korakianitis 2009).
7
2.
Literature Review
2.1 Current Fuel Control Techniques
Many forms of fuel delivery control exist and commonly are characterized as mechanical or electronic. Fuel delivery techniques, both mechanical and electronic, using carburetors and injectors are found on all types of engines including, SI, CI, 2-stroke, lean burn, rich burn, and stoichiometric burn engines. Mechanical carburetors and fuel injectors are installed on all of the above mentioned platforms of nearly any engine displacement, for various fuel types, and in both automotive and industrial applications. Both mechanical fuel delivery devices are incorporated onto engines as a single component, providing fuel to all cylinders by distributing the air/fuel mixture accordingly through an intake manifold. Furthermore, a carburetor or injector can be placed at the intake runner of each cylinder to provide individual fuel delivery.
Small scale (<100 kW) Stationary natural gas SI internal combustion engines typically utilize a simplistic mechanical carburetor fuel delivery system. The fuel is quantified using a venturi that air passes through, creating a vacuum and drawing the fuel into the air stream. There is no feedback control but rather the air/fuel is manually adjusted via a needle jet screw located on the carburetor. As fuel composition and ambient air conditions change, exhaust emissions output will change and many times emissions compliance can no longer be met. This becomes especially apparent with NSCR catalyst systems that require stoichiometric operation. Passive, mechanical systems are incapable of controlling AFR in the narrow range required for
8
NSCR operation. Electronic carburetors with lambda feedback, such as the Continental Controls Corporation (CCC) Electronic Gas Carburetor (EGC) 2 incorporate a pre catalyst lambda sensor for feedback control (Continental Controls Corporation 2008). These systems will often operate at stoichiometric burn conditions, unless the system has the support for the user to designate the air/fuel ratio. The application operating AFR is typically coupled with the type of exhaust after treatment that will be used.
The lambda sensor, originally invented in 1976 by Bosch, has revolutionized the way in which fuel delivery is controlled. All automobiles today utilize at least 1, if not 2 lambda sensors and are coupled with a NSCR system. It provides feedback to the electronic control unit (ECU) based on the O2% contained in the exhaust gas, which then determines the amount of fuel to be delivered to the engine to maintain an air/fuel ratio as close to stoichiometric burn as possible (Bosch 2006). Automotive systems with an ECU and lambda feedback are equipped with electronic fuel delivery systems either using a distributed fuel injector on an intake
manifold (throttle body injection) or fuel injectors at each cylinder head intake port (tuned port injection).
Recent developments in direct injection SI gasoline engines use a NOx sensor as feedback fuel control in lean burn engines. A NOx storage catalyst system is employed to adsorb the high levels of NOx produced when the engine is operated lean. Once the catalyst is saturated, the NOx sensor, installed downstream of the catalyst, communicates to the ECU. The ECU then operates the engine at a rich condition for approximately 2 seconds, effectively reducing NOx into harmless N2 (NGK 2012).
9 2.2 Exhaust Gas Treatment
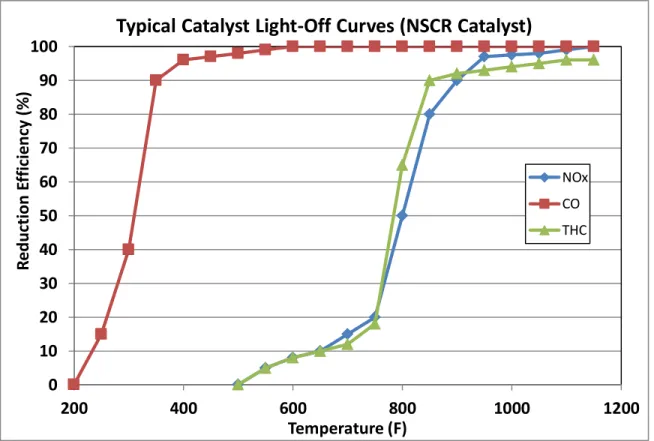
Many forms of exhaust gas after treatment exist for applications of spark ignition (SI) engines, compression ignition (CI) engines, and various fuels. This includes oxidation catalysts, SCR systems, NSCR systems, thermal reactors, EGR systems, and particulate and NOx traps. All catalyst systems are designed to operate in a specified temperature range and are ineffective until temperature has risen above a designated value. The term “light-off temperature” is used to describe this minimum temperature where the catalyst operates at a reduction efficiency of 50% or greater. An example of a typical light-off curve for a NSCR catalyst is shown in Figure 2-1.
Figure 2-1: Typical NSCR catalyst light off curves (Johnson Matthey Catalysts)
0 10 20 30 40 50 60 70 80 90 100 200 400 600 800 1000 1200 R e d u ct ion E ff ici e n cy ( % ) Temperature (F)
Typical Catalyst Light-Off Curves (NSCR Catalyst)
NOx CO THC
10
Catalyst reduction efficiency is determined by equation 2.1 below, where ̇
represents the mass flow of a given species measured prior to entering the catalyst and ̇
is the mass flow of a given species exiting the catalyst. Table 2-1 describes exhaust after treatment systems.
̇
11
Table 2-1: Major components in regards to construction and functionality of exhaust gas treatment systems (BASF Corporation), (DCL International 2009), (Heywood 1998), (Navarro 2008), (Pulkrabek 2004), (Schmitt 2010)
Oxidation Catalyst
Oxidizes THC and CO into CO2 and H2O
O2 introduced by lean burn or stoichiometric operation Air pump can be used to provide additional O2
Catalyst bed constructed of noble metals (Platinum and palladium)
SCR
Involves injection of reagent (urea, NH3) in the exhaust upstream of the catalyst
Reduces NOx into chemically benign diatomic nitrogen and water Designed to operate in CI and lean burn SI engines
NSCR
Simultaneously reduces NOx and oxidizes THC and CO
Narrow range of air/fuel ratios near stoichiometric required for high reduction efficiency (~0.1 air/fuel ratios)
Close loop control via an O2 sensor is required
Cyclic variation (~1 Hz) of fuel flow (dithering) widens this range Rich operating conditions produces NH3 across catalyst
Catalyst bed constructed of Rhodium (Rh) and Platinum (Pt)
Thermal Reactors
Oxidizes CO and THC, typically in an enlarged exhaust manifold Designed to operate with rich burn engines and air injection Effectiveness depends on temperature, available oxygen and
residence time
EGR
Designed to primarily reduce NOx emissions
Recirculates exhaust gases back into the intake manifold Effectively reduces maximum combustion temperature
NOx Traps
Designed to reduce NOx on lean burn SI and CI engines
System contains oxidation catalyst (Pt), adsorbent (Barium), and reduction catalyst (Rh)
NO is oxidized to NO2, adsorbs onto Barium surface, then engine is operated at rich condition, reducing NOx
Particulate Traps
Designed to reduce particulate emissions in CI engine systems Filter like systems made of ceramic in a mat or mesh structure Traps typically remove 60-90% of particulates in exhaust stream Requires oxidation regeneration periodically
12
Currently for stationary reciprocating SI stoichiometric natural gas engines, NSCR catalytic converters are the primary focus for exhaust after treatment. They are designed to
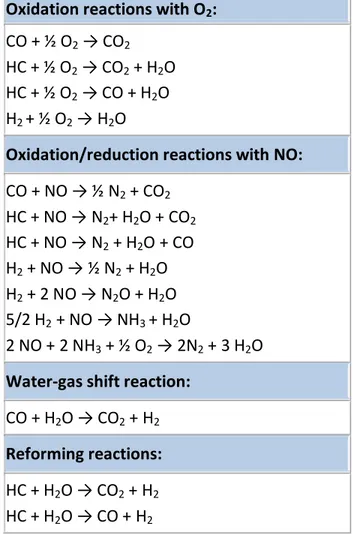
simultaneously reduce NOx, CO, and THC concentrations while also having an impact on the reduction of VOC’s and HAP’s. These systems are only used in SI internal combustion engines and not CI, two-stroke, or other lean burn engines because the catalyst is required to operate at stoichiometric air/fuel ratios. Table 2-2 describes the dominant chemical reactions that occur within a NSCR catalyst including the 2 major reactions that occur within a NSCR catalyst that produce NH3.
Table 2-2: Main chemical kinetic reactions that occur across a 3-way catalyst (DCL International 2009)
Oxidation reactions with O2: CO + ½ O2 → CO2
HC + ½ O2 → CO2 + H2O HC + ½ O2 → CO + H2O H2 + ½ O2 → H2O
Oxidation/reduction reactions with NO: CO + NO → ½ N2 + CO2 HC + NO → N2+ H2O + CO2 HC + NO → N2 + H2O + CO H2 + NO → ½ N2 + H2O H2 + 2 NO → N2O + H2O 5/2 H2 + NO → NH3 + H2O 2 NO + 2 NH3 + ½ O2 → 2N2 + 3 H2O
Water-gas shift reaction: CO + H2O → CO2 + H2
Reforming reactions: HC + H2O → CO2 + H2 HC + H2O → CO + H2
13 2.3 NOx Sensor Construction and Operation
NOx sensor technology dates back to the late 1980’s, with the initial designs being constructed from various forms of ceramic type metal oxides including yttria stabilized zirconia (YSZ). Material selection was adopted from lambda sensor technology which had been
developed previous to the NOx sensor. Improved models such as the dual chamber Zirconium Dioxide (ZrO2) have been developed and continue to be an area of active engineering research. Requirements of a robust NOx sensor include a wide operating temperature range, sensitivity, accuracy, lifetime, and appropriate material selection to avoid degradation by gases such as CO2 and SO2 (Woo 2010).
The ZrO2 dual cavity NOx sensor operates in the following sequence: (a) Exhaust gases including NOx, HC, CO, O2, H2, etc. enter the 1st cavity of the sensor, (b) O2 concentration is maintained to a constant concentration within a few ppm of NOx via the main O2 pumping cell and the rest are oxidized at the Pt pumping electrode, (c) The new concentrated gas of NOx and O2 enter the 2nd cavity of the sensor, (d) The auxiliary pump completely removes gaseous O2 in the 2nd cavity, (e) At the measuring electrode, the equilibrium of 2NO is changed by removing the generated oxygen from the reduction of NO, (f) The measuring pump extracts and measures this generated oxygen , which represents the NOx concentration of the exhaust gas. The zirconia electrolyte acquires an amperometric measurement. An ECU is required to provide power control in order to heat and maintain the temperature of the sensor
(Continental 2008), (Inagaki et al. 1998). Figure 2-2 displays the operation and construction of a ZrO2 NOx sensor.
14
Figure 2-2: ZrO2 NOx sensor construction and operation (Continental 2008)
There are multiple uses for implementing a NOx sensor into a combustion system such as an ICE. These range from monitoring NOx levels to feedback control. NOx sensors have a cross sensitivity to NH3, which is produced across a NSCR catalyst when the ICE is operated in a rich condition (ɸ ≥ 1). SCR systems on both spark ignition and compression ignition engines often are coupled with NOx sensor feedback to control the injection concentration of chemicals such as urea and NH3 (Schmitt 2010), (Marquis 2001). With a NSCR system, engine out emissions do not include NH3, rather it is produced across the catalyst (Vronay et al. 2010). NOx sensors are primarily designed to be utilized in stoichiometric or lean burn engines (ɸ ≤ 1) where NOx is prevalent. To make gasoline engines more environmentally friendly and consume less fuel, manufacturers are focusing on direct injection engines that operate at lean conditions when run at partial load. The result is a decrease of fuel consumption by 12-20%; however, it requires a NOx storage catalytic converter and a NOx sensor (NGK 2012).
15 2.4 Minimization Control Algorithms
Techniques to drive a feedback signal to a minimum are available in many forms and complexities. The most basic form is to acquire 2 consecutive samples of data, evaluate if the 2nd sample has decreased or increased, and then make a feed forward command to drive it in the same or opposite direction, respectively. Slightly more advanced algorithms would include the Golden Section Algorithm and the Brent Minimization Algorithm.
The Golden Section Algorithm is a search method used for unimodial concave or convex curves when trying to find a minimum or maximum point. An interval of uncertainty is
designated between 2 points (A, B) with length B-A. Two points, (X1, X2) are chosen between this interval and the function is evaluated for f(X1) and f(X2). For determining a minimum point, whichever evaluated point is higher in magnitude, becomes the upper bound. For example if f(X1) > f(X2) as shown in Figure 2-3, the function is decreasing in the range of [X1, X2], therefore the minimum cannot be greater than X1 and f(X1) and the new interval now becomes (X1, B] (Cheney and Kincaid 1994), (Gerald and Wheatley 2004).
16
The values of X1 and X2 are chosen such that each point divides the interval of uncertainty [A, B] into 2 separate fractions where:
(2.2) ( )
The length of the larger fraction (F) is solved for by taking the positive root of the quadratic. To solve for X1 and X2, the fraction multiplied by the initial interval of uncertainty is subtracted from the opposite end of the interval:
X1 = B – F*(B-A) (2.3)
X2 = A + F*(B-A) (2.4)
By dividing the line segment up in this manner, the interval of uncertainty is updated every iteration and one of the previous test points can be used in the following iteration. It is not referred to as the most efficient search method, but can work well with complicated unimodal curves and can be modified to compliment other types of functions (Cheney and Kincaid 1994), (Gerald and Wheatley 2004).
The Brent Minimization Algorithm combines the Golden Section Algorithm with a parabolic interpolation producing a faster algorithm that still remains robust and improves convergence. When iterations are performed, the Brent Minimization Algorithm approximates a function by interpolating a parabola through 3 existing points acquired on the curve. The
17
parabolas minimum point is used as the estimate for the minimum point of the function. If this point is within the range of the current interval, then it is accepted and used to generate a smaller interval of uncertainty. If the point is not within the range, then the algorithm reverts back to the standard Golden Section Algorithm (Gonnet 2002).
18
3.
Experimental Setup and Procedures
3.1 Generator Set SpecificationsThe platform utilized is a Cummins-Onan Generator Set, model GGHD 60HZ, assembled in 1999. This system contains a rugged 4-cycle industrial ICE manufactured by Ford, model LSG-875, that can operate on various gaseous fuels including propane and natural gas. This particular model chosen for testing had been previously installed in the Engines and Energy Conversion Laboratory (EECL), providing an ample opportunity for an engine configuration for testing.
Displacement of the engine is 7.5 liters or 460 cubic inches. It utilizes a cast iron block and heads in a 90 degree V-8 configuration, and operates at approximately 1800rpm. Engine parameters in tabularized format are shown in Table 3-1 (Onan Corporation 2001a).
Table 3-1: Engine specifications
Base Engine LSG-875, Turbocharged
Displacement in^3 (L) 460.0 (7.5) Gross Engine Power Output, bhp (kWm) 173.0 (129.1)
BMEP, psi (kPa) 150.0 (1034.2)
Bore, in. (mm) 4.36 (110.7)
Stroke, in. (mm) 3.85 (97.8)
Piston Speed, ft/min (m/s) 1155.0 (5.9)
Compression Ratio 8.6:1
Lube Oil Capacity, qt. (L) 10.0 (9.5) Exhaust Gas Flow (Full Load), cfm (m3/min) 760.0 (21.5)
19
Natural Gas had been originally plumbed at the EECL into the mechanical carburetor installed on the engine. Engine rotational speed is monitored via an electronic governor manufactured by Woodward Governor. Mechanically it operates the throttle body valve position, ultimately controlling the amount of air/fuel mixture required to maintain the
generator load at 1800rpm. A variable reluctor speed sensor (VRSS) installed in the bell housing surrounding the flywheel gives feedback to the governor module as a reference to execute an adjustment to the throttle body. Figure 3-1 is an image of the original engine configuration of the generator set.
20
Additionally, the engine is equipped with a non wastegated turbocharger manufactured by Holset, model number H1C, which provides additional air/fuel mixture at higher loads. The turbocharger is located shortly upstream of the throttle body and does not have any type of air after-cooler to control the temperatures of the intake charge seen at the intake manifold. There is no exhaust after treatment installed on this engine either.
The engine is coupled to an electric alternator or generator, model UCF3. Maximum power output rating of the generator set on natural gas at STP air conditions is 100kW, however, at the elevation of approximately 5000 feet, the maximum power output or 100% load was derated to 80KW. The electrical power output can be supplied to the main city
electrical grid system or to load bank. The generator was operated at 480 Volts, 60 Hertz, and a power factor of 1, meaning no reactive power (Onan Corporation 2001b).
3.2 Continental Controls EGC2 Carburetor
From the factory this generator set was equipped with a mechanical carburetor manufactured my IMPCO, which operates at a zero gage fuel pressure that is regulated upstream by an IMPCO fuel pressure regulator as seen in Figure 3-1. The carburetor and regulator were removed and a state of the art electronically controlled carburetor with lambda feedback, manufactured by CCC, EGC2 was installed and the fuel system was plumbed
accordingly. A manufacturer drawing of the EGC2 is provided in Appendix I. The carburetor location was retained as before in the pre-compressor location, drawing air and fuel through the compressor inlet of the turbocharger promoting further air and natural gas mixing via the compressor wheel.
21
With the upstream fuel pressure regulator removed, the CCC EGC2 receives natural gas at a pressure of approximately 15 inches of water column. The EGC2 precisely controls the air to fuel ratio using the patented advanced mixing venturi designed for natural gas, variable
pressure control, and wideband oxygen sensor feedback control. This system coupled with a 3-way catalyst yields high emissions reduction efficiency and improved engine fuel efficiency.
The venturi mixer is precisely shaped to produce a lower pressure in the throat, drawing the fuel through the injection ports and into the air stream where it is mixed. The injection ports and venturi mixer produce an optimal air to fuel ratio under all engine load and speed conditions at steady state operation when setup correctly by the user. A pressure transducer is located in the carburetor surrounding the gas injection holes in the venturi mixer. It measures the gas injection pressure and gives feedback in order to adjust the pressure set point within the carburetor just upstream of the gas injection holes. A wideband oxygen sensor located before the 3-way catalyst provides additional feedback to the carburetor. The air to fuel ratio is trimmed by adjusting the electronic pressure regulator inside of the carburetor (Continental Controls Corporation 2008). Figure 3-2 is an image of the CCC EGC2 installed on the engine.
22
Figure 3-2: CCC EGC2 installed
Additional wiring and sensors were needed in order to successfully install this
carburetor. The carburetor required two power sources both of which are 12VDC, one for the power control board as well as the electronic pressure regulator, fused individually at 1 amp and 6 amps, respectively. This particular carburetor has a built in manifold absolute pressure (MAP) sensor plumbed into the intake manifold just beneath the throttle body. Additionally, the carburetor needs a speed signal to control fuel delivery start and stop commands. A VRSS manufactured by Magnetic Sensors Corporation, secondary to the one installed for the engine speed governor, was installed into the bell housing. This provides feedback directly to the CCC EGC2. Refer to Appendix I for additional VRSS details.
23 3.3 Continental Controls Catalyst Monitor
In addition to the CCC EGC2 and all of the hardware previously discussed in Section 3.2, Continental Controls also provided a catalyst monitor which interacts with the fuel delivery and data acquisition (DAQ) systems. The main intention of this device is to monitor various sensors, including 2 thermocouples, differential pressure across the catalyst, 2 wideband O2 sensors, 2 NOx sensors, a single 4-20mA input, and 2 CAN Bus inputs if the NOx sensor inputs are not used. This provides a means of monitoring the aging and degradation of the catalyst. There are 2 programmable safeguards built into the system that can be activated to provide engine shutdown upon specific conditions for instance a high temperature condition above the
maximum operating temperature of the catalyst. High temperatures can sinter precious metals located on the catalyst. Another example would be increased differential pressure across the catalyst, which may indicate masking and fouling of the catalyst sites (Continental Controls Corporation 2010).
All models of the catalyst monitor have a built in standalone data logger to acquire data for post processing. The catalyst monitor has the ability to receive feedback from a NOx sensor located downstream of the catalyst and use this feedback loop for further air/fuel ratio trim adjustments performed by the carburetor. The catalyst monitor communicates with the CCC EGC2 via CAN Bus communications to feed forward the desired air/fuel ratio increment adjustment. The adjustment is calculated utilizing a minimization control algorithm, which is the major focus of this work. One common CAN Bus is shared by the catalyst monitor, EGC2, Continental NOx sensor and NI Hardware. Figure 3-3 is a flow diagram that represents the logic performed by the catalyst monitor system.
24
Figure 3-3: CCC Catalyst Monitor control logic (Continental Controls Corporation 2010)
3.4 DCL Catalyst
The catalyst used for the project was a NSCR, or 3-way, catalyst designed to reduce exhaust emissions including CO, THC, NOx, and aldehydes. It is manufactured by DCL International and was sized accordingly for the engine specifications. The MINE-X model catalytic converters from DCL International are designed with reliability and long life operation in mind and come with an emissions performance guarantee. The manufacturer guarantees a reduction efficiency of 90-99% for NOx and CO, 50-90% for THC, and 80-95% for CH2O and
25
HAP’s. HAP’s are a specific category of pollutants designated by the EPA. Typically the only species emitted about regulatory limits is CH2O.
NSCR catalysts are universal to many applications as they can accompany various fuels including natural gas, propane, and gasoline. Additionally, the catalyst has a modular design and can be easily modified to complement a different application. The assembly has removable catalyst inserts that can be stacked to meet the engine exhaust flow rate and emissions
requirements. It is designed with a stainless steel structure and brazed metal substrate (DCL International 2009). The catalyst that was provided for the project can be seen in Figure 3-4.
26
The catalyst was sized for the project by DCL to have 3 catalyst inserts, with a volume of 4560 (cm3) each and an active area of 24.8 (cm2/cm3). It is also equipped with 4 threaded fittings, 2 pre and 2 post catalyst, located in the end caps where the catalyst is flanged. Pre and Post catalyst thermocouple measurements as well as the plumbing required to the differential pressure transducer, logged by the CCC catalyst monitor consumed these available threaded ports. The catalyst assembly arrived with 3 inch, 4 bolted ANSI companion flanges. The catalyst was placed in a location with flow characteristics in mind. It was also installed as close as possible to the engine to maximize catalyst temperature and reduction efficiency. In order to achieve high exhaust gas temperatures entering the catalyst, heavy insulation of the exhaust between the engine exhaust manifolds and catalyst outlet was performed. This resulted in temperatures just less than the catalysts maximum temperature and the highest emissions reduction efficiencies.
3.5 Turbocharger After-cooler
Previous testing performed by Southern California Gas Company and CCC, using the CCC EGC2 revealed that temperature fluctuations in the ambient air (mass air flow) around the intake filter due to radiator and engine heat were resulting in inconsistent engine exhaust emissions (Vronay Engineering Services Corp. 2011). To address this issue, their team plumbed the air filter away from the engine environment to try and maintain steady state air properties entering the engine.
To address the issue for this project, a water to air intercooler was installed between the turbocharger compressor outlet and the throttle body. The intercooler also compensates for
27
slow changes in air properties throughout the day. The intercooler is manufactured by Frozen Boost, who builds intercoolers primarily for automotive applications. It is rated up to 350 HP, has a pressure drop less than 0.1psig, and recommended for flow rates up to 450 CFM. Thus, the intercooler is oversized for the Cummins-Onan Genset. The finished intercooler setup installed and plumbed is displayed in Figure 3-5.
28
Figure 3-5: Intercooler installed and plumbed for air and water
3.6 NOx Sensor Systems
During initial engine re-configuration, there were 2 different NOx sensors installed downstream of the catalyst with their corresponding signal conditioners. The first system is manufactured by CCC, utilizes a Continental brand NOx sensor, and came with the EGC2 and
29
Catalyst Monitor. The second system was a standalone system manufactured by Engine
Controls and Monitoring (ECM), model number NOx 5210. There are differences between both systems and comparison of their output values will be further investigated in Chapter 4. For the sake of this project, the Continental NOx sensor became the only system retained in the latter part of the project. Both NOx sensors were positioned in the exhaust stream according to manufacturer recommendations. Additionally, the driving technology for both sensors is a specialized thick film ZrO2 standalone smart sensor that uses integrated in-connector control electronics.
The ECM NOx 5210 system is a much more versatile unit and can be easily implemented in the field to nearly any application. There are 2 sensor options including the NGK and the NTK sensor, with the main difference being their error tolerance of plus/minus 15 ppm for NGK and plus/minus 30 ppm for NTK. The NTK sensor was used during baseline testing. It returns values for NOx, Lambda, Equivalence Ratio, Air/Fuel Ratio (AFR), and % O2. It also has the option for a secondary channel in which 2 sensors can be monitored simultaneously and logged (Engine Control and Monitoring 2008).
The Continental Smart NOx sensor “Uninox_12V” goes through a NOx sensor module manufactured by CCC that processes this raw signal and returns a signal in units of ppm onto the CAN Bus. This particular sensor is designed to operate between the range of 0 and 1500 ppm. The system returns an updated value to the CAN Bus every 50ms, or at a rate of 20Hz (Continental 2008). The Continental sensor is a thick film ZrO2 dual cavity construction with in-connector control electronics, shown in Figure 3-6.
30
Figure 3-6: Continental Smart NOx sensor (Continental 2008)
3.7 Data Acquisition
Various measurement sensors were installed throughout the engine and its plumbing systems in order to monitor and record all necessary engine parameters. All sensor outputs were wired into the appropriate National Instruments (NI) module through conduit surrounding the engine platform. Each NI module plugs directly into a cRIO 9076 NI chassis that
communicates to the LabVIEW data acquisition interface on the main floor of the EECL in the control room via Ethernet connection. All of the NI hardware was powered using a 24VDC power supply from the generator set control box. Multiple screen shots of the LabVIEW interface are shown in Appendix I.
Thermocouple measurements were wired using K-Type thermocouple wire and ran into a NI 9213 16-channel capable thermocouple input module. Analog inputs were wired into a wiring block fastened inside of the control box and then into a NI 9205 32-channel capable 0-5V input module. Parameters from the CCC EGC2, CCC Catalyst Monitor, and Continental NOx sensor system were wired onto one CAN Bus and the ECM 5210 NOx sensor system was wired onto its own designated CAN Bus. Each CAN Bus then communicates to a NI 9853 2-channel CAN Bus module. A list of instrumentation and sensors is provided in Table 3-2.
31
Table 3-2: Instrumentation list of all sensors installed to monitor and provide feedback from the engine configuration and the corresponding NI module
Measurement
Instrumentation
Data Collection System
Pre-Intercooler Temp 1/8" Type K thermocouple NI-9213, LabVIEW Post-Intercooler Temp 1/8" Type K thermocouple NI-9213, LabVIEW Pre-Turbine Temp 1/4" Type K thermocouple NI-9213, LabVIEW Pre-Catalyst Temp 1/4" Type K thermocouple NI-9853, LabVIEW Post-Catalyst Temp 1/4" Type K thermocouple NI-9853, LabVIEW Fuel Inlet Temp 1/4" Type K thermocouple NI-9213, LabVIEW Post-Intercooler
Pressure
Omega PX309-050A5V pressure
transducer NI-9205, LabVIEW
Pre-Turbine Pressure Omega PX309-050A5V pressure
transducer NI-9205, LabVIEW
Fuel Inlet Pressure Omega PX309-030GI pressure
transducer NI-9205, LabVIEW
Catalyst Differential Pressure
Rosemount 0-15 inH2O
pressure transducer NI-9853, LabVIEW Fuel Inlet Flow Omega FTB938 flow meter NI-9205, LabVIEW Fuel Inlet Flow Omega FLSC-62A signal
conditioner NI-9205, LabVIEW
Engine Speed Magnetic Sensors Corporation
VRSS NI-9853, LabVIEW
Carburetor Fuel
Pressure CCC EGC2 Carburetor NI-9853, LabVIEW
Intake Manifold
Pressure CCC EGC2 Carburetor NI-9853, LabVIEW
Lambda (O2%) Bosch LSU 4.2 Sensor NI-9853, LabVIEW
Continental NOx
System Continental NOx Sensor NI-9853, LabVIEW
ECM NOx System ECM NOx 5210 with NTK
Sensor NI-9853, LabVIEW
3.8 CCC EGC2 and Catalyst Monitor Calibration and Software
In addition to the ability to log all CCC EGC2 and Catalyst Monitor parameters via CAN Bus communications, there is also the option to view the data live time using the software provided with the product. It offers a graphical user interface (GUI) with the ability to log and adjust parameters through the use of a laptop that communicates with both the CCC EGC2 and
32
Catalyst Monitor via serial communications. This provides a full engine on board diagnostics tool.
The EGC2 parameters including O2 sensor set point, fuel pressure range limits, dithering options, initial cranking conditions, O2 sensor and fuel pressure gain values can be set utilizing their “Valve Viewer” software. When the carburetor is in operation and connected to a laptop via the serial communications connector, the software provides a GUI feedback that updates at a rate of 1 Hz. Data logging can be enabled within the software as well. Figure 3-7 shows a screen shot of the Valve Viewer software.
Figure 3-7: Valve Viewer software graphical user interface
Catalyst Monitor parameters including range adjustments of inputs and alarm settings can be modified using the secondary software provided referred to as “Catalyst Monitor
33
Viewer.” Additionally the software provides a GUI that displays pre and post catalyst
temperatures, Continental NOx sensor output (ppm), and catalyst differential pressure. These parameters can be logged for post processing as well. The EGC2 carburetor and Catalyst Monitor require a serial connection to communicate to their respective software. Figure 3-8 is a screen shot of the Catalyst Monitor Viewer software.
Figure 3-8: Catalyst Monitor Viewer software graphical user interface
Parameters that can be set within the CCC EGC2 include O2 sensor set point, fuel pressure set point and range limits, dithering settings, initial conditions, O2 sensor and fuel pressure gain values. In order to optimize these values, the engine was operated through a series of tests over the course of multiple days to determine the ideal settings needed to
34
5-gas analyzer rack. Table 3-3 compares the factory EGC2 carburetor settings to the new values found to provide the best engine out emissions results under steady state and transient
conditions.
Table 3-3: CCC EGC2 carburetor settings
Setting Previous Value Optimal Value
Target AFR 17.2 17.053
O2 Sensor Gain 100 700
Pressure Proportional Gain 1600 1600
Pressure Integral Gain 600 200
Dithering Amplitude 1800 600
Dithering Period 667 (~1 s) 667
When dithering was enabled, the engine out emissions tended to be more stable and produce overall lower concentrations. Dithering is an operation performed by the EGC2 where it oscillates the AFR above and below the target AFR set point at a designated amplitude and frequency (period). Dithering was incorporated into the system initially by CCC due to previous research suggesting that it widened the narrow equivalence ratio operating range (Vronay et al. 2010). The O2 sensor gain, dithering amplitude, and dithering period are all a function of one another and the actual AFR amplitude created by dithering depends on all 3 parameters.
Initially under load transients, the O2 sensor gain was not high enough to keep up with the demands of the fuel adjustment required to maintain the desired AFR. After this value was increased, the ramp rate at which dithering occurred increased and started to make the engine speed lope up and down. To compensate, the dithering amplitude had to be lowered to keep the actual AFR amplitude within a practical range for steady engine operation. The dithering period of 667 corresponds to 1 second, meaning the dither will go above and then below the
35
target AFR set point in that period of time. This value was retained as this is a common
frequency at which dithering occurs in automotive applications. Additionally, it was found that by lowering the pressure integral gain, the rate at which the fuel pressure changed internal to the EGC2 to ultimately change the AFR was appropriate under steady state and transient conditions.
3.9 Test Procedure (Steady State and Transient)
A test procedure was developed to accurately compare baseline testing to that using a NOx sensor feedback control algorithm. Various steady state and transient conditions were created in order to evaluate the system’s ability to maintain high 3-way engine emissions reduction efficiency. When the engine was operated at 100% load for only a short period of time, overheating occurred due to the generator set being located in an area of the facility with poor air circulation. It was decided that 80% load (64 kW electric power) would be the
maximum load.
5 test procedures were developed for the study: 1. Equivalence Ratio Sweep Steady State 2. Load Sweep Steady State
3. Load Transient
4. Propane Blending (Steady State and Transient) 5. Exhaust Back Pressure Transient
36
All testing, other than the load sweep and load transient tests, was performed at 60% load (48 kW electric power). For all testing, other than the equivalence ratio sweep, the optimal AFR was used. The equivalence ratio sweep is where the optimal AFR was obtained. During steady state testing, any time a test change was made, the engine was allowed to run until the Rosemount 5-gas emissions were stable (about 15 minutes). Shortly after, a 5 minute period of test data was recorded via LabVIEW, which included all inputs from the engine configuration shown in Table 3-2, the Rosemount 5-gas analyzer rack, Nicolet 6700 FTIR, and ECM AFRecorder 4800R.
The equivalence ratio sweep was among the most important test procedures that had to be executed because it determined the optimal AFR for all other tests performed. Additionally, the response of the NOx sensors with respect to the AFR can be accurately evaluated, which is critical for NOx sensor control. The target AFR in the CCC EGC2 was changed in both lean and rich directions so that a wide range of AFR’s were captured in order to see the effects on the engine exhaust emissions output and NOx sensor response.
The load sweep consisted of operating the engine at steady state generator load settings of 20, 40, 60, and 80%. The effects of catalyst temperature and its relation to the required AFR set point were evaluated, as well as NOx sensor correlations. The load transient in test was conducted to evaluate the ability of the control system to maintain emissions compliance as load changes. The load transient test consisted of the following sequence: (a) zero load for 2 minutes, (b) step load up to 20% (16KW electric power) at a rate of
37
electric power), (e) hold for 15 minutes, and (f) repeat through load steps of 60, 80, 60, 40, 20, and 0%.
In order to execute the propane blending testing, a propane injection system plumbed into the natural gas fuel feed line was developed using a standard propane holding tank, appropriate propane safe pressure valve, rota-flow meter and needle control valve. Flow rates of 25, 50, 75, and 100 SCFH were targeted and the Gas Chromatograph (GC) was used to determine the actual concentration (molar %). To be sure that satisfactory propane and natural gas mixing would occur before the Varian CP-4900 Micro GC sampling line, the propane was introduced approximately 2 feet upstream. For the transient test, propane blending was introduced instantly at a designated time and flow rate.
The last test developed was an exhaust back pressure transient. This was chosen with the understanding that a large amount of exhaust backpressure across the catalyst and lambda sensor, introduced instantaneously would compromise the calibration of the sensor and correct AFR lambda feedback control would not operate in the targeted range. A manual exhaust back pressure valve, manufactured by Apexi was installed downstream of the catalyst, exhaust sensors and emissions probes. A pressure gage was used to monitor exhaust backpressure. The 4 available exhaust back pressure settings the engine could operate at were 1, 5, 9, and 10 psig which corresponded to the valve manual set points.
3.10 Control Room Analyzers and Preparation
A total of 8 instruments characterized gaseous engine exhaust emissions and fuel composition. Included is a Rosemount 5-gas analyzer rack with 5 individual instruments to
38
monitor NOx, CO, THC, CO2, and O2 concentration. A Nicolet 6700 Fourier Transform Infra-Red (FTIR) spectrometer was used to acquire HAP’s including NH3. A Varian CP-4900 Micro GC evaluated the fuel composition and an ECM AFRecorder model 4800R acquired the AFR.
A condenser removes water from the exhaust sample prior to entering the 5-gas analyzers rack. NOx concentration is measured using the chemiluminescence method (CM). NO2 is reduced into NO across the catalyst and then NO reacts with generated ozone (O3), forming an electronically excited NO2 molecule. The excited molecule immediately reverts to the ground state emitting photons, which is directly measured by a photodiode. The intensity is proportional to the NOx concentration. CO and CO2 concentration is measured by each
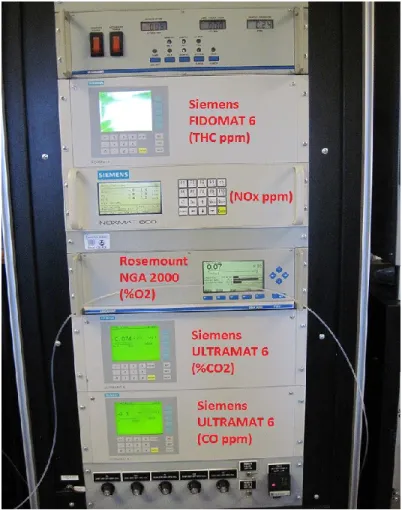
respective analyzer using Infrared radiation (IR) adsorption. Total hydrocarbon compounds are detected using a flame ionization detection (FID) method. The sample exhaust gas flow is regulated and passes through a flame that is combusted by a fuel gas and air that is regulated as well. The flame produces electrons and positive ions, which are collected by an electrode that creates a current through the circuit which is proportional to the number of carbon atoms. O2 concentration is determined by measuring the magnetic susceptibility of the exhaust sample gas, referred to as paramagnetic detection (PD). O2 is strongly paramagnetic, and accounts for nearly all of the exhaust sample gas magnetic susceptibility. Figure 3-9 is an image of the Rosemount 5-gas analyzer rack with its corresponding devices.
39
Figure 3-9: Rosemount 5-gas analyzer rack
Other gaseous components and Hazardous Air Pollutants (HAPs), defined by the EPA, are characterized using a FTIR spectrometer. The FTIR can be used to measure any polar molecule below a molecular weight of approximately 45. It uses an infrared light absorption (ILA) method by measuring the entire infrared spectrum of light in the exhaust gas sample using an interferometer. This pattern is then analyzed using a Fourier Transformation, resulting in a plot of absorbance magnitude versus wavelength. The absorbance plot is used to determine the species and their concentrations in the exhaust gas sample. Figure 3-10 is an image of the
40
Figure 3-10: Nicolet 6700 FTIR
The Varian CP-4900 Micro GC was used to analyze fuel gas composition. A continuous sample was acquired just upstream of the engine and flowed to the GC located in the control room, where an analysis was carried out every 2 minutes. This analyzer utilizes a split-sample technique to achieve very fast analysis times (~50 seconds). Gas species are separated with packed columns and detected using a thermal conductivity detector. Typically the analysis is set up to determine fuel gas composition up through C6. Figure 3-11 is an image of the Varian CP-4900 Micro GC.
41
Figure 3-11: Varian CP-4900 Micro GC
The AFR is accurately determined by entering a series of calibration constants into the ECM AFRecorder 4800R that are provided specific to the SEGO wide range O2 sensor sent by the manufacturer. Furthermore, once a GC sample of the fuel gas composition has been acquired, the fuel Hydrogen, Oxygen, and Nitrogen to Carbon ratios can be entered into the device in order to record accurate AFR and/or equivalence ratio. The Simulated Exhaust Gas Oxygen (SEGO) sensor is mounted in the exhaust stream of the engine pre-catalyst
configuration. A cable is then routed directly from the sensor up into the ECM AFRecorder located in the control room. Figure 3-12 is an image of the device.
42
Figure 3-12: ECM AFRecorder 4800R
The Rosemount 5-gas analyzer rack, Nicolet 6700 FTIR, and Varian CP-4900 Micro GC all went through a calibration process previous to testing and periodically throughout testing to ensure that consistent results were being acquired without concern for instrumentation error. All devices were calibrated using zero and span gases per EPA methods. The sampling probes were developed according to EPA AGA method 1. It is required that the pre catalyst sampling probe be located 2 pipe diameters up stream of any disturbance, which for this project was the catalyst. The post catalyst sampling probe is required to be located 8 pipe diameters
downstream of any disturbance which was the bend directly off the catalyst output. Each emissions probe was plumbed into a stainless steel 3-way valve using stainless steel tubing to reduce the chance of corrosion and leaking. The lines leading up to the 3-way valve were insulated. A heated and insulated emissions filter was attached directly to the 3-way valve. The filter assembly, which has a separate temperature control module, is connected to a heated sample line that goes to the control room exhaust analyzers. The temperature of the sample line is maintained at a constant 100 °C.
43
Table 3-4 describes the instrumentation, the corresponding components that were characterized, and the methods used.
Table 3-4: Exhaust gas species characterized, methods, and devices used
Measurement
Method
Device
NOx concentration CM Siemens NOXMAT 600
CO concentration IR Siemens ULTRAMAT 6
THC concentration FID Siemens FIDAMAT 6
CO2 concentration IR Siemens ULTRAMAT 6
O2 concentration PD Rosemount NGA 2000
NH3 concentration ILA Nicolet 6700 FTIR
Other gaseous HAP’s
concentration ILA Nicolet 6700 FTIR
Fuel composition Carbon Varian CP-4900 Micro GC
Air Fuel Ratio O2% ECM AFRecorder 4800R with SEGO O2 Sensor
Additional images and technical information on test setup and hardware can be seen in Appendix I.
44
4.
Baseline NSCR Control Results
One of the primary tasks for this work was to perform thorough baseline testing in order to accurately compare latter data using NOx sensor minimization control algorithm feedback. The 5 tests performed over the course of 3 days yielded a generous amount of data with ample opportunity for improvement utilizing NOx sensor feedback control.
4.1 Gas Chromatograph Analysis
During each steady state test that was performed, a fuel sample was acquired via the Varian CP-4900 Micro GC. For transient tests, a sample was taken before and after the transient test procedure. The species concentration is reported in percentages and includes: Methane (CH4), Ethane (C2H6), Propane (C3H8), Iso-butane and n-butane (C4H10), Hydrogen (H2), Nitrogen (N2), Oxygen (O2), and Carbon Dioxide (CO2).
Using these concentration fractions of the fuel gas composition, properties of the fuel can be acquired including the molecular weight (ṁf), stoichiometric AFR, gas fuel molar quantities (α, β, ϒ, ᵹ), and hydrogen, oxygen, nitrogen to carbon ratios. Gas fuel molar quantities
represent the following: CαHβOϒNᵹ. These values were quantified using methods described by Urban and Sharp (1994). The gas analysis was performed using Microsoft Excel and a screen shot example of a single processed GC sample is shown in Appendix II. In between each individual test, the ECM AFRecorder 4800R was reprogrammed using the hydrogen, oxygen,
45
nitrogen to carbon ratios calculated by the previous gas analysis. This ensured that the AFR being reported to LabVIEW for recording was consistent. With a stoichiometric AFR value and gas fuel molecular weight determined for each individual steady state and transient test, averaging for that specific test was performed.
For the equivalence ratio sweep test, an overall average stoichiometric AFR was
determined from all tested points across the sweep. The molecular weight of the fuel was also averaged and found to be 17.212 g/mol. Brake specific emissions (g/bhp*hr) required the use of the calculated fuel carbon number (α) which was an average value of 1.019 moles. Detail on why this value was needed will be discussed further in Section 4.2. For the test procedures following the equivalence ratio sweep, the averaged stoichiometric AFR, gas fuel molecular weight, and fuel carbon number remained nearly constant.
Acquiring gas fuel composition samples for the propane blending tests at each target flow rate (SCFH) was also of high priority. Knowing the molar percentage of propane in the fuel composition was important to acquire rather than just knowing the target propane blending flow rate. To be certain the samples were correct and that proper mixing was occurring, 2 samples at each target flow rate were performed, and then averaged during post processing. Table 4-3 displays the relationship between target flow rates and averaged GC calculated propane (C3H8) molar %.
4.2 Brake Specific Emissions
Exhaust gas species concentrations recorded by the Rosemount 5-gas analyzer rack and