Technical Report TR04-07 December 2004
ricultural
Ag
Experiment Station
College ofAgricultural Sciences and Landscape Architecture Department of Horticulture Arkansas Valley Research Center Cooperative Extension
Frank C. Schweissing, Superintendent, Arkansas Valley Research Center Michael E. Bartolo, Vegetable Crops Specialist, Arkansas Valley Research Center
Funding Provided by the Colorado Agricultural Experiment Station
**Mention of a trademark or proprietary product does not constitute endorsement by the Colorado Agricultural Experiment Station.**
Colorado State University is an equal opportunity/affirmative action institution and complies with all Federal and Colorado State laws, regulations, and executive orders regarding affirmative action requirements in all programs. The Office of Equal
Opportunity is located in 101 Student Services. In order to assist Colorado State University in meeting its affirmative action responsibilities, ethnic minorities, women, and other protected class members are encouraged to apply and to so identify themselves.
Acknowledgements:
This report is dedicated to the two men pictured on the cover, Frank Schweissing (top photos) and Marvin Wallace (bottom photos). Frank served as both entomologist (1961-2004) and superintendent (1980-2004) of the AVRC. Frank retired in January of 2004 leaving an unparalleled legacy to the Research Center’s facilities and programs. Marvin Wallace served as Farm Technician starting part-time in the summer of 1953 and becoming full-time in 1967. Marvin faithfully served the AVRC with a sense of humor and modesty until his sudden passing in May 2003. Words cannot describe the level of dedication shown to the Arkansas Valley and the AVRC by these two men.
Arkansas Valley Research Center Rocky Ford, Colorado
Staff
(719) 254-6312
Frank C. Schweissing Superintendent- Entomologist Michael E. Bartolo Vegetable Crops Scientist
Marvin A. Wallace Farm Technician Kevin J. Tanabe Research Associate
Cooperators
David Gent, Graduate Research Assistant, C.S.U., Dept. of Bioagricultural Sciences and Pest Management
Jim Hain, Res. Associate, C.S.U., Department of Soil and Crop Sciences Ardell Halvorson, Soil Scientist, USDA-ARS
Jerry Johnson, Crop Scientist, C.S.U., Department of Soil and Crop Sciences
Jillian Lang, Graduate Research Assistant, C.S.U., Dept. of Bioagricultural Sciences and Pest Management
Kevin Larson, Crop Scientist, C.S.U., Plainsman Research Center and Dept. of Soil and Crop Sciences Scott Nissen, Weed Scientist, C.S.U., Department of Bioagricultural Sciences and Pest Management Cutis Reule, Soil Scientist, USDA-ARS
Colorado State University Fort Collins, Colorado Agricultural Experiment Station
Administration
Lee E. Sommers
Director, Agricultural Experiment Station 491-5371
S. Lee Gray, Head
Department of Agricultural and Resource Economics 491-6325
J. Daryl Tatum, Head
Department of Animal Sciences 491-6672
Thomas O. Holtzer, Head
Department of Bioagricultural Sciences and Pest Management 491-5261
Stephen J. Wallner, Head
Department of Horticulture and Landscape Architecture 491-7019
James S. Quick, Head
Department of Soil and Crop Sciences 491-6517
2004 Advisory Council Members
ARKANSAS VALLEY RESEARCH CENTER Rocky Ford, Colorado
County Term Expires Name and Address
Bent 2004 Ed Blackburn, 6619 Hwy. 194, Las Animas, CO 81054 2005 Bill Elder, 13500 Hwy. 50, Las Animas, CO 81054 2006 Chrm. *Kim Siefkas, 32470 CO Rd 10, Las Animas, CO 81054 Crowley 2004 Dean Rusher, 7995 Co. Ln. 10, Olney Springs, CO 81062
2005 *John Tomky, 4413 Lane 8.5, Olney Springs, CO 81062 2006 Matt Heimerich, 5325 Ln. 9 ½ , Olney Springs, CO 81062 El Paso 2004 Vice Chrm. *Toby Wells, 11120 Old Pueblo Road, Fountain, CO 80817
2005 Jay Frost, 18350 Hanover Rd., Pueblo, CO 81008 2006 Glen Ermel, 10465 REA Road, Fountain, CO 80817 Huerfano
Las Animas 2004 *Paul E. Philpott, Box 3, Hoehne, CO 81046
2005
2006 Allen Nicol, Box 63, Hoehne, CO 81046
Otero 2004 *Dennis Caldwell, 25026 Road 19, Rocky Ford, CO 81067 2005 Robert Gerler, 25320 Road BB, La Junta, CO 81050 2006 Hans Hansen, 36606 Road JJ, La Junta, CO 81050 Prowers 2004 Jim Ellenberger, 36101 Rd 11 ½ , Lamar, CO 81052
2005 *Robert Jensen, PO Box 290, Granada, CO 81041 2006 Leonard Rink, 21971 Hwy. 196, Bristol, CO 81028 Pueblo 2004 Dan Genova, 33200 South Rd, Pueblo, CO 81006
2005 *Robert Wiley, 52699 Olson Rd., Boone, CO 81025 2006 Clay Fitzsimmons, 36038 So. Rd, Pueblo, CO 81006 *Research Committee Members
________________________________________________ Extension Agents Bent Secretary Fair Grounds, Las Animas, CO 81054
Crowley Bill Hancock, Courthouse Annex, Ordway, CO 81063 El Paso Jonathan Vrabec, 305 S. Union, Colorado Springs, CO
80910
Huerfano Jim Conley, 401 Main, Suite 101, Walsenburg, CO 81089 Las Animas Dean Oatman, 200 E. 1st , Rm. 101, Trinidad, CO 81082 Otero Bill Hancock, Box 190, Rocky Ford, CO 81067
Prowers Tim Macklin, 1001 S. Main, Lamar, CO 81052 Pueblo Frank Sobolik, Courthouse, Pueblo, CO 81003
2003 Climatic Conditions
Arkansas Valley Research Center
Colorado State University
Rocky Ford, Colorado
Frank C. Schweissing, Superintendent
The annual precipitation of 9.23" was substantially better than last year but still below the long term average of 11.75". Most of the precipitation (5.83") came during the months of April, May and June. The Rocky Ford Ditch supplied an adequate amount of irrigation water to this Research Center. However, all other Ditches and Canals in the area and to the east of us had very inadequate supplies and crop production was severely limited. Fall harvest was carried out without interruption.
The frost free period of 156 days between May 11 and October 14 was 2 days shorter than average. Based on a nominal growing season of May 1 to September 30, there were 2954 corn growing degree days which is above normal (2857DD).
2003 Frost Dates 2003 Average Frost Dates* Average* Frost Free Frost Free Last Spring First Fall Period Last Spring First Fall Period Frost Frost (days) Frost Frost (days) May 11 - 31°F Oct. 14 - 24°F 156 May 1 October 6 158 ---Month Temperature(F°) Precipitation Snowfall 10 Year Precip. ---
High Low Avg. 2003 Normal* Total Inches inches inches ____________________________________________________________________________________ Jan. 74 10 36.6 T 0.26 1.0 1994 11.42 Feb 76 -7 32.0 0.50 0.29 6.0 1995 11.64 March 83 15 46.3 0.89 0.68 T 1996 13.38 April 90 24 57.3 2.31 1.32 0.5 1997 18.58 May 103 31 64.6 1.24 1.83 1998 14.62 June 100 42 70.0 2.28 1.40 1999 19.96 July 107 54 81.4 0.51 1.97 2000 9.60 Aug. 103 55 77.2 0.54 1.54 2001 11.99 Sept. 96 32 65.3 0.44 0.90 2002 3.52 Oct. 96 19 58.3 0.10 0.78 0.0 2003 9.23 Nov. 74 -3 39.3 0.20 0.46 2.0 Dec. 72 2 52.7 0.22 0.32 4.2 Average 12.39 --- Total 9.23 11.75 12.7 *Average – 103 years iv
TABLE OF CONTENTS
FIELD CROPSAlfalfa-Variety Trials………..1
Bean-Pinto Variety Trial……….3
Corn-Grain & Silage Variety Trial……….6
Corn-Nitrogen Management……….11
Small Grain-Winter Wheat………...17
Sorghum-Forage Variety Trial………..20
Soybean-Variety Trial………...22
VEGETABLE CROPS Onion-Variety Trial.………..24
Onion-Disease Management………..27
Onion-Weed Management……….39
This research is partially supported by the Arkansas Valley Onion Growers Association Seedless Watermelon Establishment……….43
Melon Foliar Fertilizer Trial………..45
Pepper Stand Reduction Trial………47
Pepper Soil Crusting Trial……….49
Compiled by Michael Bartolo
NOTICE
This publication is a compilation of reports dealing with research carried out at the Arkansas Valley Research Center. Trade names have been used to simplify reporting, but mention of a product does not constitute a recommendation not an endorsement by Colorado State University or the Colorado Agricultural Experimental Station. In particular, pesticides mentioned in various reports may not be registered for public use. Pesticides are to be used only in accordance with the manufacturer’s label.
2003 Alfalfa Variety Performance Trial Report
Location: Arkansas Valley Research CenterRocky Ford, Colorado 81067 Stand Established: 2000
Investigator: Frank C. Schweissing, Superintendent
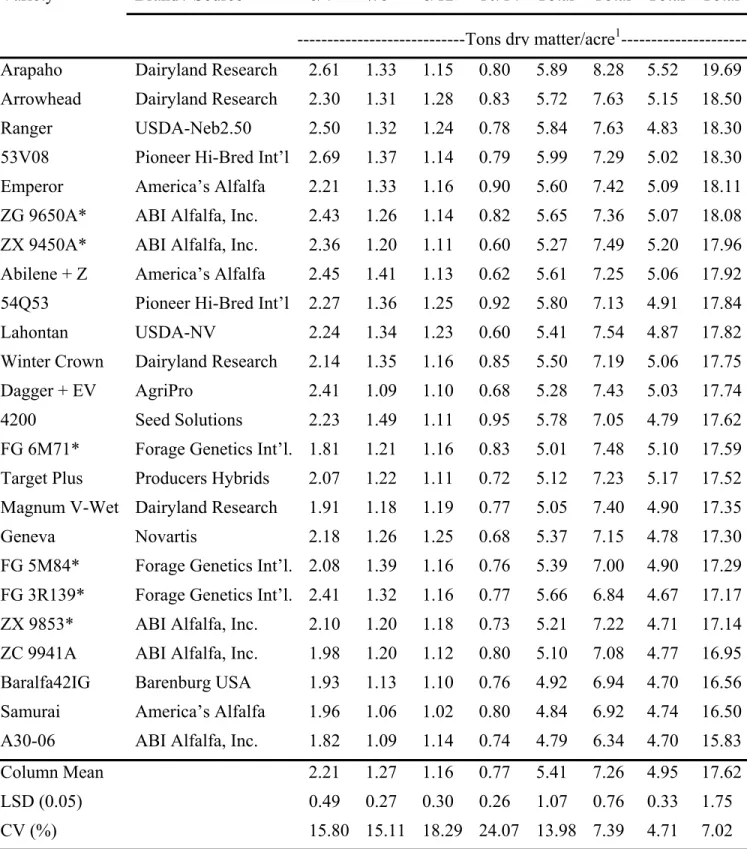
This is a report of the results of an irrigated alfalfa variety trial, planted September 1, 2000, after three years of production. There are 22 commercial and 2 public varieties included in this test.
The trial was set up as a randomized complete block, with four replications (1 plot = 75 sq. ft.). The trial was managed to reduce factors which limit production. The plot area was fertilized with 100 lbs. of P2 O5 + 21 lbs. of N per acre prior to planting and 156 lbs. of P2O5 + 33 lbs. of N per acre on October 28,
2002. Sencor DF .75 lbs. + Gramoxone Extra .47 lbs. Ai/acre were applied on March 12, 2002 and March 13, 2003 to control winter annual weeds. Warrior T .025 lbs. + Lorsban .125 lbs. Ai/acre were applied on May 13, 2002 and May 14, 2003 alfalfa weevil control.
Harvest dates in 2003 were June 4, July 8, August 12 and October 14. Rainfall from April through September was 7.3 inches compared to a long term average of 9 inches. Growing degree days were above normal. The trial was irrigated prior to the first cutting and after each of the four cuttings. All four cuttings were harvested without significant rain damage. The average trial yield was 5.41 tons/acre compared to 7.26 tons in 2002 and 4.95 tons in 2001. Significant differences in yield were observed for all cuttings and total yield, however, variability was very high in the trial.
Yields are reported in oven-dry weights. If you want to determine yields with a particular percent moisture, divide dry yield by 1.00 minus the percent moisture you usually sell your hay. Example: (Yield/1.00-.10) = yield with 10% moisture or 5.41/.90 = 6.01 tons per acre.
Current Contact: Dr. Abdel Berrada
Arkansas Valley Research Center, Colorado State University 27901 Road 21, Rocky Ford, CO 81067
(719)254-6312 FAX(719)254-6312
Table 1.-Forage yields of 24 alfalfa varieties in the irrigated trial at the Arkansas Valley Research Center, Rocky Ford, Colorado. 2001-2003.
1Yields calculated on oven-dry basis. *Indicates experimental entry
1st 2nd 3rd 4th
Cut Cut Cut Cut 2003 2002 2001 3 Yr. Variety Brand / Source 6/4 7/8 8/12 10/14 Total Total Total Total
Arapaho Dairyland Research 2.61 1.33 1.15 0.80 5.89 8.28 5.52 19.69 Arrowhead Dairyland Research 2.30 1.31 1.28 0.83 5.72 7.63 5.15 18.50 Ranger USDA-Neb2.50 2.50 1.32 1.24 0.78 5.84 7.63 4.83 18.30 53V08 Pioneer Hi-Bred Int’l 2.69 1.37 1.14 0.79 5.99 7.29 5.02 18.30 Emperor America’s Alfalfa 2.21 1.33 1.16 0.90 5.60 7.42 5.09 18.11 ZG 9650A* ABI Alfalfa, Inc. 2.43 1.26 1.14 0.82 5.65 7.36 5.07 18.08 ZX 9450A* ABI Alfalfa, Inc. 2.36 1.20 1.11 0.60 5.27 7.49 5.20 17.96 Abilene + Z America’s Alfalfa 2.45 1.41 1.13 0.62 5.61 7.25 5.06 17.92 54Q53 Pioneer Hi-Bred Int’l 2.27 1.36 1.25 0.92 5.80 7.13 4.91 17.84 Lahontan USDA-NV 2.24 1.34 1.23 0.60 5.41 7.54 4.87 17.82 Winter Crown Dairyland Research 2.14 1.35 1.16 0.85 5.50 7.19 5.06 17.75 Dagger + EV AgriPro 2.41 1.09 1.10 0.68 5.28 7.43 5.03 17.74 4200 Seed Solutions 2.23 1.49 1.11 0.95 5.78 7.05 4.79 17.62 FG 6M71* Forage Genetics Int’l. 1.81 1.21 1.16 0.83 5.01 7.48 5.10 17.59 Target Plus Producers Hybrids 2.07 1.22 1.11 0.72 5.12 7.23 5.17 17.52 Magnum V-Wet Dairyland Research 1.91 1.18 1.19 0.77 5.05 7.40 4.90 17.35 Geneva Novartis 2.18 1.26 1.25 0.68 5.37 7.15 4.78 17.30 FG 5M84* Forage Genetics Int’l. 2.08 1.39 1.16 0.76 5.39 7.00 4.90 17.29 FG 3R139* Forage Genetics Int’l. 2.41 1.32 1.16 0.77 5.66 6.84 4.67 17.17 ZX 9853* ABI Alfalfa, Inc. 2.10 1.20 1.18 0.73 5.21 7.22 4.71 17.14 ZC 9941A ABI Alfalfa, Inc. 1.98 1.20 1.12 0.80 5.10 7.08 4.77 16.95 Baralfa42IG Barenburg USA 1.93 1.13 1.10 0.76 4.92 6.94 4.70 16.56 Samurai America’s Alfalfa 1.96 1.06 1.02 0.80 4.84 6.92 4.74 16.50 A30-06 ABI Alfalfa, Inc. 1.82 1.09 1.14 0.74 4.79 6.34 4.70 15.83 Column Mean 2.21 1.27 1.16 0.77 5.41 7.26 4.95 17.62 LSD (0.05) 0.49 0.27 0.30 0.26 1.07 0.76 0.33 1.75 CV (%) 15.80 15.11 18.29 24.07 13.98 7.39 4.71 7.02
---2003 Pinto Bean Trials
Arkansas Valley Research Center
This is the fourteenth year a variety trial has been carried out at this Center in recent times. The overall trial yield average was very good. The irrigation water supply was adequate but temperatures were very high during July. This years trial average was 3322 lbs./acre compared to 2407 lbs./acre in 2002, 3020 lbs./acre in 2001, 3664 lbs./acre in 2000, 2749 lbs./acre in 1999, 2134 lbs./acre in 1998, 2461 lbs./acre in 1997, 3419 lbs./acre in 1996, 1599 lbs./acre in 1995, 3129 lbs./acre in 1994, 3760 lbs./acre in 1993, 2541 lbs./acre in 1992, 2361 lbs./acre in 1991 and 2848 lbs./acre in 1990.
Precipitation for the year was 9.23 ", which is below normal but above last year..
Test Plot Information
Purpose - To evaluate the inherent genetic ability of selected pinto bean varieties to yield under irrigated conditions of the Arkansas Valley.
Data - 1. Yields 2. Test Weight
3. Seeds/ lb. Plot - 32' X 10'(4 rows)
Design - Randomized complete blocks (3 replications) Varieties - 18 entries
Fertilizer - 75 lbs. P2O5 + 16 lbs. N/acre as 11-52-0 - 11/7/01
Herbicide - Eptam 3 lbs. + Treflan .75 lbs. AI/Acre - incorporated 6/10/03
Insecticide - none Fungicide - none Plant - June 12, 2003
Irrigate - 6/13, 7/1, 7/21, 8/4, 8/26.
Harvest - Cut - 9/25; Lift-9/29; Thresh - 9/29 - 4 rows, 32' long Self propelled plot combine.
Jerry J. Johnson James P. Hain
Frank C. Schweissing
Average pinto bean performance over six Colorado locations in 2003.
Location
Rocky Yellow
Variety* Haxtun Idalia Montrose Proctor Ford Jacket Average ---Yield (lb/ac)---Montrose 3662 2931 2640 2909 3853 1740 2956 99195 3108 2536 3709 2112 3862 2018 2891 Poncho 3070 2969 2450 2810 3987 1670 2826 CO12650 2892 2710 2934 1707 3712 1936 2648 99236 2710 2587 3181 2216 3120 2056 2645 99211 3155 2521 2872 2295 3464 1497 2634 00167 2324 2372 3477 2342 3153 2011 2613 00195 3117 2510 3248 1914 2808 1862 2576 CO96731 3163 2439 2995 1609 3176 1601 2497 CO96737 3239 2726 2711 1637 3139 1515 2494 CO83783 3118 2269 2756 1889 3173 1717 2487 CO83778 3233 2421 2733 1562 3185 1769 2484 Bill Z 3087 2323 2465 2083 3355 1466 2463 99204 2474 2029 3230 2343 2807 1594 2413 Buckskin 2873 2217 2327 2464 3038 1376 2382 99218 1946 2082 2732 1837 3239 1883 2287 Grand 2346 2317 2361 1854 3387 1436 2283 CO96753 2257 2152 2978 1179 3337 1613 2253 Average 2876 2450 2878 2042 3322 1680 2542
*Varieties ranked by the average yield over six locations in 2003.
Pinto Bean Variety Performance Trial at Rocky Ford1 in 2003.
Test
Variety Yield Moisture Weight Seed/lb
lb/ac % lb/bu No.
Poncho 3987 8.6 59.0 1112 99195 3862 10.8 59.1 1226 Montrose 3853 9.1 59.3 1161 CO12650 3712 12.6 59.8 1244 99211 3464 10.9 57.1 1137 Grand Mesa 3387 8.7 57.2 1326 Bill Z 3355 8.5 57.3 1249 CO96753 3337 17.1 54.9 1028 99218 3239 8.9 59.7 1159 CO83778 3185 10.3 58.0 1076 CO96731 3176 11.2 57.7 1068 CO83783 3173 11.5 57.6 1064 00167 3153 9.7 56.5 1215 CO96737 3139 10.8 57.4 1088 99236 3120 13.6 57.8 1165 Buckskin 3038 8.3 58.0 1168 00195 2808 10.8 57.4 1324 99204 2807 8.3 58.3 1224
Pinto Bean Varietal Descriptions
Bill Z A medium maturity (95 d) variety release by Colorado State University in 1985. It has a vine
Type II growth habit with resistance to bean common mosaic virus and moderate tolerance to bacterial brown spot. It is a very productive variety with excellent seed quality, however it is susceptible to white mold, common bacterial blight and rust.
Buckskin A variety from released by Syngenta Seeds, Inc. (RNK101). It is a vine Type III growth habit
with resistance to bean common mosaic virus but is susceptible to white mold, rust, and bacterial brown spot with early to medium maturity (92 d).
CO Experimental lines from Colorado State University.
Grand Mesa A medium maturity (96 d) from Colorado State University released in 2001. Grand Mesa
combines resistance to rust, bean common mosaic virus and semi-upright Type II plant architecture and field tolerance to white mold, but is susceptible to common bacterial blight and bacterial brown spot. It has moderate yield potential and good seed quality.
Montrose A medium maturity (97 d) released from Colorado State University in 1999.It has resistance to
rust and bean common mosaic virus. It has high yield potential and excellent seed quality. Because it has very prostrate Type III growth habit, it is highly susceptible to white mold.
Poncho A medium maturity (96 d) from Syngenta Seed, Inc. with resistance to bean common mosaic and
has high yield potential and excellent seed quality. It has semi upright Type III growth habit. It is susceptible to rust and bacterial brown spot.
00167, 00195, Experimental lines from ProVita, Inc. (Relatively new bean seed company in Washington State). 99195, 99204,
99211, 99218, 99236
2003 Corn Grain and Silage Variety Trial
Arkansas Valley Research Center
The average grain yield in this trial was 231 bushels per acre compared to 2002-184 bu., 2001-206 bu., 2000-233 bu., 1999-206 bu., 1998-200 bu., 1997-206 bu., 1996-219 bu., 1995-197 bu., 1994-230 bu., 1993-178 bu., 1991-209 bu. and 1990-183 bu. The average silage yield was 36 tons per acre compared to 2002-31T., 2001-34T., 2000-39T., 1999-33T., 1998-40T., 1997-32T., 1996-36T., 1995-35T., 1994-33T., 1993-27T., 1992-41T., 1991-37T., and 1990-31T. The average silking date for the grain trial was 2 days later and for the forage trial 3 days later than in 2002. Grain yields were adjusted to 15.5% moisture and 56 pound bushels while silage yields were adjusted to 70% moisture. This allows direct comparison between varieties, but actual harvest moistures and silking dates indicate maturity and should be considered when choosing a variety.
Test Plot Information
Purpose - To evaluate the inherent genetic ability of selected corn varieties to yield grain and silage under irrigated conditions in the Arkansas Valley.
Data - 1. Grain yields 2. Forage yields
3. Growth factors
Plots - Grain - 32' X 10' (4rows) Harvest 2 rows Silage - 32' X 5' (2 rows)
Design - Randomized complete blocks (3 replications) Varieties - Grain-36 entries Silage-14 entries Fertilizer - 52 lbs. P2O5 + 11 lbs. N/Acre - 10/28/02
100 lbs. N as urea - 3/17/03
Herbicide - Dual II Magnum 1.43 lbs. AI/Acre - 4/25/03 Clarity .50 lbs. AI/Acre - 5/28/03
Insecticide - Capture .08 lbs. AI/Acre - 8/1/03
Soil - Silty, clay loam, 1-1.5% o.m., pH ca. 7.8 Plant - May 5, 2003
Irrigate - 5/6, 6/19, 7/4, 7/14, 7/26, 8/8, 8/19 silage, 9/1 grain Harvest - Silage - September 17, 2003 - Forage harvester
Grain - October 16, 2003 - Self-propelled two row plot combine Jerry J. Johnson
Irrigated corn variety performance trial at Rocky Ford1 in 2003.
Grain Test Plant
Hybrid YieldMoistureWeightHeight Density Silking2
Bu/ac % lb/bu in plants/ac date Producers Hybrids 7371 (BT) 257 16.1 57.7 78 30220 197 NK Brand N70-T9 (BT/LL/CL) 255 16.1 57.7 77 31445 197
ASGROW RX752 (YGCB) 255 15.7 58.5 76 30628 197
Grand Valley SX1395 (YGCB) (BT) 253 16.3 57.7 81 30220 196
HYTEST HT7806 (BT) 248 17.1 59.0 82 31309 198
HYTEST HT7710 (BT/LL) 246 16.0 57.7 79 31173 197
Mycogen 2E705 (YG/BT) 246 15.9 57.7 77 30628 197
Foundation Pilot HCS0112 245 16.0 58.2 78 31173 197 DEKALB DKC63-50 (YGCB) 245 15.3 58.2 79 31445 197 Foundation Pilot HCS0112 (YGCB) 245 16.1 57.7 79 31037 198 Grand Valley GVX0178 (YGCB) (BT/RR) 245 16.0 56.1 80 30492 198 Foundation Pilot HCS0113 (YGCB) 243 15.8 57.7 77 28722 197 NK Brand N70-F1 (BT/LL) 240 15.7 57.7 73 30764 198 Grand Valley GVX8978 (YGCB) (BT) 239 15.8 58.5 78 30492 198
DEKALB DKC60-17 (RR) 238 15.4 58.1 70 29948 196 DEKALB DKC64-10 (RR) 238 14.9 58.7 80 31445 197 Mycogen 2A812 (HX/BT) 237 16.7 57.2 87 32942 196 Mycogen 2R773 (YG/BT) 237 16.0 59.8 80 31853 197 NK Brand N65-M7 236 15.7 58.2 80 31445 196 Producers Hybrids 7290 (BT) 232 16.0 58.7 80 30084 196 Triumph 1120 (BT) (RR) 230 14.8 59.1 80 31989 196 DEKALB DKC63-79 (YGCB) 230 16.2 59.3 76 30356 198 DEKALB DKC64-11 (RR/YGCB) 230 15.5 59.3 83 32398 198 Foundation Pilot HCS0113 227 15.1 57.8 74 28450 197 Grand Valley SX1298 (YGCB) (BT/RR) 226 14.5 58.7 78 31037 198 DEKALB DKC60-19 (RR/YGCB) 224 15.6 58.8 72 31173 197 NK Brand N67-T4 (BT/LL) 222 15.7 58.5 77 30900 197 Foundation Pilot HCS0111 (RR) 219 15.8 61.2 81 31309 197 Foundation Pilot HCS0111 (RR/YGCB) 218 15.6 60.8 80 30220 197
NK Brand N72-J5 217 15.7 57.9 79 30084 198
Grand Valley SX1300 (YGCB) 214 15.2 59.7 77 29539 197
Triumph 1302Rw (YGRW) 211 15.2 58.1 73 31445 198
HYTEST HT7778 (BT) 210 15.4 58.3 79 31037 198
DEKALB DKC53-34 (RR/YGCB) 193 13.5 58.8 65 32534 195
DEKALB DKC53-33 (RR) 186 13.2 58.6 76 31309 195
Grand Valley GVX3378 (YGCB) (BT) 183 11.5 58.1 75 31853 196
Average 231 15.4 58.4 78 30919 197
LSD(0.30) 13
1Trial conducted at the Arkansas Valley Research Center; seeded 5/5 and harvested 10/16. 2Julian date.
*No significant ear drop or lodging.
2-Yr irrigated corn variety performance at Rocky Ford in 2002-03.
Grain Test Hybrid Yield Moistur Weight
lb/ac % lb/bu HYTEST HT7806 (BT) 224 16.2 59.1 Producers Hybrids 7290 (BT) 221 14.6 56.8 DEKALB DKC60-19 211 14.7 59.1 NK Brand N72-J5 204 15.3 58.4 Triumph 1120 (BT) (RR) 199 13.4 58.6 NK Brand N67-T4 (BT/LL) 196 14.5 58.8 Average 209 14.8 58.5
Irrigated Corn Variety Performance Trial at Rocky Ford
175 185 195 205 215 225 235 245 255
Producers Hybrids 7371 (BT) NK Brand N70-T9 (BT/LL/CL) ASGROW RX752 (YGCB) Grand Valley SX1395 (YGCB) (BT) HYTEST HT7806 (BT) HYTEST HT7710 (BT/LL) Mycogen 2E705 (YG/BT) Foundation Pilot HCS0112 DEKALB DKC63-50 (YGCB) Foundation Pilot HCS0112 (YGCB) Grand Valley GVX0178 (YGCB) (BT/RR) Foundation Pilot HCS0113 (YGCB) NK Brand N70-F1 (BT/LL) Grand Valley GVX8978 (YGCB) (BT) DEKALB DKC60-17 (RR) DEKALB DKC64-10 (RR) Mycogen 2A812 (HX/BT) Mycogen 2R773 (YG/BT) NK Brand N65-M7 Producers Hybrids 7290 (BT) Triumph 1120 (BT) (RR) DEKALB DKC63-79 (YGCB) DEKALB DKC64-11 (RR/YGCB) Foundation Pilot HCS0113 Grand Valley SX1298 (YGCB) (BT/RR) DEKALB DKC60-19 (RR/YGCB) NK Brand N67-T4 (BT/LL) Foundation Pilot HCS0111 (RR) Foundation Pilot HCS0111 (RR/YGCB) NK Brand N72-J5 Grand Valley SX1300 (YGCB) Triumph 1302Rw (YGRW) HYTEST HT7778 (BT) DEKALB DKC53-34 (RR/YGCB) DEKALB DKC53-33 (RR) Grand Valley GVX3378 (YGCB) (BT)
Hy
br
id
Yield (bu/ac)
Corn silage variety performance trial at Rocky Ford1 in 2003.
1Trial conducted at the Arkansas Valley Research Center; seeded 5/5 and harvested 9/17.
2Julian date.
2-Yr average corn silage variety performance at Rocky Ford in 2002-03.
Hybrid Yield Moisture
t/ac % HYTEST HT7815 (RR) 37.7 58.3 Grand Valley SX1610 35.7 57.4 ASGROW RX897 (RR) 35.4 55.6 Grand Valley SX1606 35.3 55.6 AgriPro 9646 34.7 54.6 Grand Valley SX1602 34.4 54.3 Mycogen 2888IMI 33.1 54.8 Garst 8315 IT 31.4 56.1 FX419 30.4 52.5 Average 34.2 55.5 Plant
Hybrid Yield Moisture Density Height Silking2 t/ac % plants/ac in date HYTEST HT7815 (RR) 40.8 60.1 30855 87 203 Grand Valley SX1610 39.2 56.7 27970 89 202 Grand Valley SX1602 38.0 55.0 31218 87 201 AgriPro 9646 37.9 57.1 30129 93 202 DEKALB DKC69-72 (RR) 37.4 55.9 32126 88 204 Grand Valley SX1606 36.2 56.5 30085 86 201 HYTEST HT7930 (BT) 35.6 56.2 30855 90 199 ASGROW RX897 (RR) 35.0 58.7 30946 89 202 HYTEST TNT-119 34.9 54.4 31309 86 198 NK Brand N83-N5 34.6 56.7 29913 86 202 FX419 33.3 53.7 30304 92 199 Mycogen 2888IMI 31.7 56.1 31309 89 202 Triumph 1866 (BT) 31.6 53.2 31763 85 201 Garst 8315 IT 31.2 59.8 30401 85 202 Average 35.5 56.4 30656 88 201 LSD(0.30) 2.9
Nitrogen Requirements of Irrigated Corn In Colorado Arkansas Valley
Ardell D. Halvorson1, Frank C. Schweissing2, Michael E. Bartolo2, and Curtis A. Reule1
1USDA-ARS, Fort Collins, CO and 2AVRC, Rocky Ford, CO
email: Ardell.Halvorson@ars.usda.gov; phone: (970) 492-7230
The U.S. Department of Agriculture, Agricultural Research Service, Northern Plains Area is an equal opportunity/affirmative action employer and all agency services are available without discrimination.
SUMMARY
This study evaluated the effects of N fertilizer rate and N source (urea and Polyon®3) on corn yields for 4 years following 5 years of alfalfa and one year of watermelon production. Corn grain yields were not significantly increased by N fertilization the 1st year following watermelon, but increased with increasing residual soil NO3-N levels the 2nd year without additional N fertilization, and increased by N
fertilization in the 3rd and 4th years. Averaged over years, N source did not significantly affect corn yields. Averaged over years, corn grain yields were near maximum with an average application of 75 to 100 lb N/a per year. Silage yields increased with increasing N rate each year, except for the 2nd yr. Residual soil NO3-N levels declined with each additional corn crop in the check (no N added) treatment.
Soil residual NO3-N levels were increased with increasing N rate the 1st year. Residual soil NO3-N
levels declined following the 2nd corn crop with no additional N fertilizer applied. Irrigation water was limited and became unavailable due to drought conditions the first week of August for the 3rd crop. Therefore, the 3rd corn crop suffered from severe drought stress and reduced yields. The 4-year average N fertilizer use efficiency was 82% at the lowest fertilizer N rate and 47% at the highest N rate. Nitrogen application to corn in Arkansas River Valley produced in rotation with vegetable crops and alfalfa may need to be reduced to prevent NO3-N contamination of groundwater in this area. Based on
this study, it appears that a minimal amount (75 to 100 lb N/a) of N fertilizer may be needed to maintain high grain and silage corn yields in the Valley in rotation with vegetable crops and alfalfa. Fertilizer N appears to be moving out of the root zone with downward movement of irrigation water. Residual soil NO3-N levels declined with each additional corn crop in the check (no N added) treatment.
PROBLEM
High nitrate-N (NO3-N) levels have been reported in groundwater in the Arkansas River Valley
in Colorado, which is a major producer of melons, onions, and other vegetable crops grown in rotation with alfalfa, corn, sorghum, winter wheat, and soybeans. Relatively high rates of N fertilizer are used to optimize crop yields and quality, generally without regard to soil testing. Vegetable crops generally have shallow rooting depths and require frequent irrigation to maintain
___________________________
®Registered Trade Mark of Pursell Technologies Inc., Sylacauga, AL.
3Trade names and company names are included for the benefit of the reader and do not imply any
endorsement or preferential treatment of the product by the authors or the USDA, Agricultural Research Service.
market quality. High residual soil NO3-N levels, high N fertilization rates to shallow-rooted crops,
shallow water tables, and excess water application to control soil salinity all contribute to a high NO3-N
leaching potential.
Application of controlled-release N fertilizers to crops in the Arkansas Valley could potentially increase nitrogen use efficiency (NUE) and reduce NO3-N leaching potential. Nitrogen management
research is needed to develop improved NUE and N management practices for furrow irrigated crops in this area. Improved N management practices for crops in the Arkansas River Valley should optimize crop yields while minimizing N fertilizer impacts on ground water quality.
Objectives of this research were to determine N fertilizer needs for optimizing furrow-irrigated
corn yields in a high residual soil N environment in Arkansas River Valley, evaluate the effects of a slow-release N fertilizer on N fertilizer use efficiency by corn, and evaluate the influence of N fertilizer application rate on residual soil NO3-N and potential for groundwater contamination.
Study Details. A N source and rate study was initiated under conventional till, furrow irrigated
corn on a calcareous Rocky Ford silty clay loam soil at the Arkansas Valley Research Center (AVRC) in 2000. The plot area had previously been in alfalfa for 5 years, before being plowed up on 20 October 98. Two applications of 150 lb P2O5/a as 11-52-0 added 64 lb N/a during the five years of alfalfa
production. Watermelon was produced on the plot area in 1999 with 21 lb N/a added with the P fertilizer (Halvorson et al., 2001). Six N rates (0, 50, 100, 150, 200, and 250 lb N/a or N1, N2, N3, N4, N5, N6, respectively) were established in 2000. Due to only a minimal response to N fertilization in 2000, no additional N was applied to the 2001 crop. In 2002, N rates of 0, 25, 50, 75, 100, and 125 lb N/a were applied to the original 2000 N treatments, respectively. In 2003, the N rates were increased slightly to 0, 30, 60, 90, 120, and 150 lb N/a, respectively. Two N sources, urea and Polyon® (a controlled-release urea fertilizer), were applied at each N rate. The N fertilizer was broadcast and incorporated with a harrow before corn planting. In the fall of 2000, 2001, and 2002, 11 lb N/a was applied with the P fertilizer (11-52-0) just prior to plowing, and no P was applied to the 2003 crop. A split-plot, randomized complete block design with 4 replications was used.
Corn (Pioneer 33A14 hybrid) was planted on April 27, 2000 at a seeding rate of about 28,400 seeds per acre. The 2001 corn (DeKalb 642RR hybrid) crop was planted on April 24 at a seeding rate of about 40,000 seeds per acre. Corn (Garst 8559 Bt/RR) was planted on April 23, 2002 and April 29, 2003 at a seeding rate of about 39,000 seeds/acre. Herbicides were applied for weed control, with the plots being essentially weed free during the study period. Soil NO3-N levels in the 0-6 ft profile have
been monitored since the spring of 1999, and were measured before fertilization and after harvest of each crop.
Due to severe drought conditions and lack of irrigation water in 2002, the last irrigation occurred on August 2nd, shortly after pollination was completed. Therefore, the 2002 crop suffered from water
stress during grain fill which reduced yield potential. The N level in the irrigation water was monitored by AVRC throughout each growing season. The irrigation water contained an average of 2.5 ppm NO3
-N in 2000, 2.8 ppm -NO3-N in 2001, and 2.4 ppm NO3-N in 2002. The N contribution from the
irrigation water to the plot area would have amounted to about 6 lb N/a in 1999 while irrigating the watermelon, about 15 lb N/a in 2000, about 14 lb N/a in
2001, and about 14 lb N/a in 2002 while irrigating the corn crops. In 2003, N level in the water was not monitored, but was assumed to be similar to previous years. Assuming a 50% irrigation efficiency, about 7 to 8 lbs of N may have entered the soil each year.
RESULTS
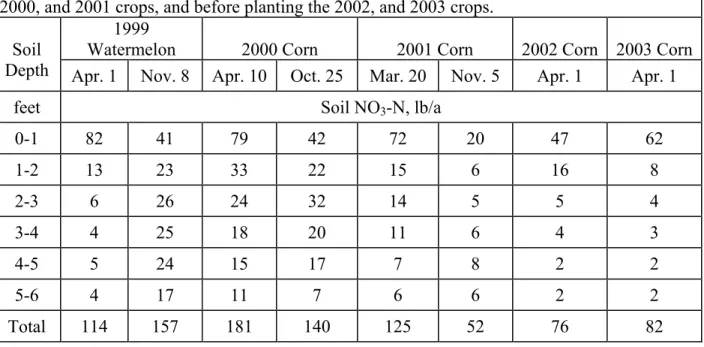
In April 1999, the soil NO3-N in the profile was concentrated in the 0-2 ft soil depth, with low
levels of NO3-N at deeper depths (Table 1). The total amount of NO3-N in the 6-ft profile was 114 lb
N/a. Following the watermelon crop, soil NO3-N levels in November 1999 had decreased in the top 2 ft
but increased in the deeper soil depths. The total amount of NO3-N in the 6-ft profile was 157 lb N/a in
November of 1999. In April 2000, soil NO3-N levels in upper part of the soil profile had increased, with
a total level of 181 lb N/a in the 6-ft profile. Thus soil NO3-N levels just prior to N fertilization and
corn planting was relatively high, despite the fact that little N fertilizer had been applied during the previous 6 years. The amount of N in the watermelon tops and unharvested melons in 1999, with a C/N ratio of about 12, potentially contributed up to 184 lb N/a to the 2000 corn crop (Halvorson et al., 2001). This might explain the unexpected high level of soil NO3-N (181 lb N/a) at corn planting in 2000. In
2001, soil NO3-N levels had declined following the second corn crop. At corn planting in 2002, soil
NO3-N levels had increased slightly compared with levels after harvest in 2001. Planting soil NO3-N
levels in 2003 were similar to those in 2002. The check plot (no N fertilizer applied) has had sufficient residual soil N to produce 718 bu of corn per acre in 4 years. The mineralization of available N from the soil organic matter in this soil appears to be quite high, as evidenced from the corn yields obtained from the check plots and removal of 377 lb N/a in the grain in 4 years.
Residual soil NO3-N levels after corn harvest for each N rate in 2001 and 2003 are reported in
Table 2. Residual soil NO3-N levels were approaching more normal levels after
Table 1. Average soil NO3-N levels in the non-fertilized check plots before and after the 1999,
2000, and 2001 crops, and before planting the 2002, and 2003 crops. 1999
Watermelon 2000 Corn 2001 Corn 2002 Corn 2003 Corn Soil
Depth Apr. 1 Nov. 8 Apr. 10 Oct. 25 Mar. 20 Nov. 5 Apr. 1 Apr. 1
feet Soil NO3-N, lb/a
0-1 82 41 79 42 72 20 47 62 1-2 13 23 33 22 15 6 16 8 2-3 6 26 24 32 14 5 5 4 3-4 4 25 18 20 11 6 4 3 4-5 5 24 15 17 7 8 2 2 5-6 4 17 11 7 6 6 2 2 Total 114 157 181 140 125 52 76 82 13
harvest of the 2001 corn crop which was not fertilized. Residual NO3-N levels in the 6 ft soil profile on
7 October 2003 still increased with increasing rates of N fertilization.
Corn grain yields were increased significantly (α = 0.05) by N fertilization each year, except in 2000 (Figure 1). The lower yields in 2001 than in 2000 were partially caused by insect damage to the corn ear during ear development. The low yields in 2002 were the result of water stress due to lack of irrigation water during grain fill. Drought stress in 2003, although not as severe as in 2002, resulted in a
severe ear smut problem, which may have reduced yield potential.
Averaged over years, the Polyon® N source (207 bu/a) did not have a significant yield advantage over urea (205 bu/a). However, if a controlled-release fertilizer becomes available at a competitive cost with urea, its use may improve NFUE and reduce NO3-N leaching potential
in the Arkansas Valley in Colorado.
Grain yields averaged 254 bu/a in 2000, 198 bu/a in 2001, 177 bu/a in 2002, and 195 bu/a in 2003 when
averaged over all N rates and N sources. The higher grain yields in 2000 compared to the other years may reflect the rotational benefits of corn following watermelon
Table 2. Soil NO3-N levels with soil depth on 5 November 2001 and 7 October 2003 for each N
rate treatment.
2000 Fertilizer N Rate (lb N/a) 2003 Fertilizer N Rate (lb N/a)
0 50 100 150 200 250 0 30 60 90 120 150 N1 N2 N3 N4 N5 N6 N1 N2 N3 N4 N5 N6 Soil
Depth 5 November 2001 7 October 2003
Ft Soil NO3-N, lb N/a 0-1 20 22 20 18 21 45 9 8 11 21 20 19 1-2 6 7 8 7 13 20 3 2 4 14 6 21 2-3 5 6 9 10 20 40 3 1 3 3 5 25 3-4 6 6 5 14 16 14 3 2 3 3 4 28 4-5 8 6 5 14 20 16 2 1 3 6 3 16 5-6 6 9 7 12 17 14 2 1 4 4 5 8 Total 52 55 54 76 107 149 22 15 28 50 42 116 (@ 15.5% moisture)
N Fertilizer Rate Each Year (lb N/a)
C o rn G ra in Y ie ld ( b u /a ) 0 50 100 150 200 250 300 2000 2001 2002 2003 2000 0 50 100 150 200 250 2001 0 0 0 0 0 0 2002 0 25 50 75 100 125 2003 0 30 60 90 120 150 Y e a r N1 N2 N3 N4 N5 N6
rather than corn following corn. The average 4-yr grain yield increased with increasing N rate
(Figure 2), with N rate expressed as a 4-yr average for the N1, N2, N3, N4, N5, and N6 treatments.
Corn silage yields (70% moisture) in 2000 increased significantly (α = 0.05) with increasing N rate up to 150 lb N/a (Figure 3). Silage yields in 2001 did not increase significantly (α = 0.05) with increasing residual soil NO3-N levels. Silage
yields in 2002 and 2003 increased significantly (α = 0.05) with increasing N rate, but did not vary with N source.
Crop N fertilizer use efficiency (NFUE) based on total biomass N uptake in 2000 decreased with increasing N rate with NFUE of 41, 21, 15, 2, and 7% for the 50, 100, 150, 200, and 250 lb N/a treatments, respectively. The two year NFUE’s based on total biomass N uptake for the combined 2000 and 2001 crops were 71, 39, 34, 25, and 25 % for these same respective N treatments. The four-year (2000-2003) NFUE was 82, 65, 56, 46, and 47 % for the N2, N3, N4, N5, and N6 fertilizer N treatments, respectively. Based on total N
removal by grain in 4 years, the NFUE was 55, 36, 34, 31, and 30 % for the N2, N3, N4, N5, and N6 fertilizer N treatments respectively.
Based on the corn N uptake data, an average of 0.7 lb N/bu was removed in the corn grain in 2000, 0.68 lb N/bu in 2001, 0.63 lb N/bu in 2002, and 0.68 lb N/bu in 2003. Nitrogen removal in the grain increased with increasing N rate when averaged over 4 years. An average total N requirement of
1.09 lb N/bu was required to produce the 2000 corn crop, 1.19 lb N/bu in 2001, 0.87 lb N/bu in 2002, and 1.01 lb N/bu in 2003 with a 4 year average of 1.04 lb N/bu with N requirements increasing with yield level. There was no influence N source on the amount of N required to produce a bushel of corn. These total N requirement values from AVRC are in agreement with total N needs of irrigated corn of 1.1 to 1.2 lb N/bu reported in the literature and used by the fertilizer industry to estimate N fertilizer needs.
Although the irrigation water contributed some N to the cropping system, it does not appear to be a major contributor to the high levels of NO3-N found in
the soils at AVRC. Based on corn yields and N uptake of the check plots (no N fertilizer applied), soil N mineralization potential was very high in this soil.
15 Total for 4 Years (2000 - 2003)
Total N Fertilizer Added (lb N/a)
0 100 200 300 400 500 T o ta l C o rn Y ie ld ( b u /a ) 700 720 740 760 780 800 820 840 860 880 900 Y = 723.9 + 0.625X - 0.000640X2 r2 = 0.98
Figure 2 1. Four-year average corn yield as a
function of average annual N rate.
Corn Silage (70 % moisture)
N Fertilizer Rate Each Year (lb N/a)
C o rn S il a g e Y ie ld ( t/ a ) 0 10 20 30 40 50 2000 2001 2002 2003 2000 0 50 100 150 200 250 2001 0 0 0 0 0 0 2002 0 25 50 75 100 125 2003 0 30 60 90 120 150 Y e a r N1 N2 N3 N4 N5 N6
Figure 2. Corn silage yield each year as a
The plot (Figure 2) of average corn grain yield as a function of the average (annual) N fertilizer application rate for the 4 years shows a curvilinear increase in grain yield with increasing rate of N fertilizer application. Grain yields start to level off above an annual rate of 75 lb N/a and are near maximum at 100 lb N/a. This would indicate that N fertilizer rates applied to corn could potentially be reduced in the Arkansas Valley while maintaining high yield potential when rotating with vegetable crops and alfalfa, which would reduce NO3-N leaching potential.
Based on the soil NO3-N data in Table 2, the addition of N fertilizer increased the level of soil
NO3-N throughout the 6 ft profile. Assuming an effective rooting depth of 3 to 4 ft, some of the
fertilizer N appears to have been leached beyond the corn root zone in this study. This observation is supported by an adjacent 15N fertilizer study with onion and corn by Halvorson et al. (2002a), who found fertilizer N leached to a 6-ft depth the year of application to an onion crop and was still present after harvest of the following corn crop with no additional fertilizer N applied.
This N study will be continued on the same plots in 2004 with chile pepper as the crop. Nitrogen fertilizer will be applied at the same rates as used in 2003. Nitrogen fertilization effects on residual soil NO3-N levels will continue to be monitored.
REFERENCES
Halvorson, A.D., R.F. Follett, M.E. Bartolo, and F.C. Schweissing. 2002a. Nitrogen fertilizer use efficiency of furrow-irrigated onion and corn. Agron. J. 94:442-449.
Halvorson, A., C. Reule, F. Schweissing, and M. Bartolo. 2001. Nitrogen management projects on corn and onion at AVRC. p. 11-14. In 2000 Research Reports, Arkansas Valley Research Center, Colorado State Univ. Agric. Exp. Sta. Technical Report TR01-9.
Halvorson, A.D., F. Schweissing, and C. Reule. 2002b. Nitrogen fertilization of irrigated corn in a high residual soil N environment in the Arkansas River Valley. In Proc. of 2002 Great Plains Soil Fertility Conference. Kansas State University, Manhattan and Potash and Phosphate Institute, Brookings, SD. 9:138-142.
Halvorson, Ardell, Frank Schweissing, and Curtis Reule. 2002c. Nitrogen fertilization of irrigated corn at AVRC. In Colorado Agric. Exp. Sta. Technical Report TR02-8, Colorado State University, Fort Collins, CO. Pages 14-18.
ACKNOWLEDGMENT
The authors wish to thank Patti Norris, Brad Floyd, Catherine Cannon, Kevin Tanabe, and Marvin Wallace for their field assistance and analytical support in collecting the data reported herein.
Winter Wheat Variety Trial - 2002-2003 Arkansas Valley Research Center
Thirty cultivars, including twelve experimental lines, from the Colorado State University Wheat Breeding Project were entered in this years trial. The average yield of 105.3 bushels per acre is substantially higher than the last couple of years. The range in yield was 69.9 bu. to 121.8 bu. per acre. The rainfall during April, May and June was better than average and the irrigation supply was adequate.
Test Plot Information
Data - 1. Grain yields 2. Growth factors
Plots - 30' X 5' (4 rows), Harvest 5' X 24'
Design - Randomized complete block (3 replications) Variety - 30 cultivars, including 12 experimental lines Fertilizer - 75 lbs. P2O5 + 16 lbs. N - 11/7/01
102 lbs. N as urea in irrigation water - 5/7/03 Herbicide - Bronate 1 lb. AI/Acre - 3/13/03
Insecticide - 0 Plant - September 16, 2002 1,000,000 seeds/acre
Irrigate - 9/17/02, 10/12/02, 4/2/03, 5/7/03 Harvest - June 2, 2003 - small plot combine
Jerry J. Johnson James P. Hain
Frank C. Schweissing
Please see http://www.colostate.edu/Depts/SoilCrop/extension/CropVar/index.html for more information including variety descriptions.
Colorado winter wheat Irrigated Variety Performance Trial summary for 2003.
1Varieties in table ranked by the average yield over three locations in 2003. 2Rating scale 1-9, with 1 = no lodging and 9 = completely lodged.
3Grain moisture was only taken at Ovid and Rocky Ford.
Location 2003
Fort Collins Ovid Rocky Ford Averages Variety1 Yield Test Wt Yield Test Wt Yield Test Wt
Yield % of Trial Average Test Wt Plant
Ht Lodging2 MoistureGrain 3
bu/ac lb/bu bu/ac lb/bu bu/ac Lb/bu bu/ac % lb/bu in 1-9 % CO99W254 129.4 61.2 102.7 59.2 116.3 61.3 116.2 116 60.6 37 3 10.3 Jagalene 128.0 60.4 100.6 57.6 116.8 59.3 115.1 115 59.1 37 4 9.8 CO99141 109.9 58.8 108.3 56.3 108.9 60.1 109.0 109 58.4 37 5 9.3 Prairie Red 124.7 59.1 81.7 53.2 119.1 58.4 108.5 108 56.9 38 2 8.9 CO99W183 112.0 56.7 96.5 53.3 116.6 59.5 108.4 108 56.5 38 5 8.6 CO99W329 118.3 59.3 94.2 55.3 111.8 60.2 108.1 108 58.3 37 3 9.4 Wesley 113.1 57.6 91.7 58.2 116.6 60.0 107.1 107 58.6 35 1 10.2 Yuma 120.2 58.2 97.5 58.3 103.5 59.4 107.1 107 58.6 38 2 9.6 G980091-1 116.8 58.4 92.4 56.0 106.7 61.6 105.3 105 58.7 35 3 9.9 Cisco 119.9 60.6 88.3 57.9 101.0 58.4 103.1 103 59.0 38 3 9.7 CO970547-7 105.0 58.6 93.4 56.4 108.9 59.3 102.5 102 58.1 38 6 9.3 Antelope 107.1 58.0 90.8 56.8 106.5 61.5 101.5 101 58.7 39 4 10.2 CO980607 107.3 58.2 88.3 55.7 108.5 61.3 101.4 101 58.4 39 5 9.8 Ok101 115.2 58.9 79.8 53.1 107.7 59.4 100.9 101 57.1 39 3 9.1 CO980630 111.8 58.2 80.9 54.6 109.3 59.0 100.7 100 57.3 39 4 10.5 G980122 117.4 58.9 78.3 54.4 105.6 60.5 100.4 100 57.9 38 2 9.7 Dumas 126.4 60.7 78.5 53.2 96.1 61.3 100.3 100 58.4 37 2 9.5 Platte 121.5 61.5 53.2 47.5 121.8 60.6 98.8 99 56.5 37 2 9.1 CO99314 116.7 58.4 69.7 54.6 110.2 61.3 98.8 99 58.1 37 3 9.7 Kalvesta 116.8 59.3 74.7 52.9 101.3 60.7 97.6 97 57.6 39 2 9.4 2137 121.4 59.1 76.0 54.3 94.9 60.1 97.4 97 57.8 39 1 9.8 CO99W192 101.5 57.1 80.5 51.9 108.4 58.5 96.8 97 55.8 39 5 9.1 Ok102 113.8 58.9 73.9 54.0 101.0 60.4 96.2 96 57.8 38 1 9.2 Ankor 109.0 57.5 65.5 53.4 108.5 61.1 94.3 94 57.3 40 2 9.9 CO970547-2 109.2 57.4 72.9 53.7 97.1 60.7 93.1 93 57.3 40 5 9.5 CO99W188 99.6 56.9 87.8 56.4 86.0 60.6 91.1 91 58.0 40 7 9.8 CO99W277 89.8 58.9 79.6 59.2 103.1 61.2 90.8 91 59.8 39 7 10.2 Venango 116.1 59.3 82.1 58.2 69.9 62.2 89.4 89 59.9 38 2 10.6 Arrowsmith 86.4 54.1 81.9 55.6 98.6 61.5 89.0 89 57.1 43 4 10.7 Nuplains 92.7 60.0 51.6 52.8 98.6 60.8 81.0 81 57.9 37 2 9.5 Average 112.6 58.7 83.1 55.1 105.3 60.3 100.3 100 58.0 38 3 9.7 LSD(0.30) 7.6 9.4 6.8
Winter wheat Irrigated Variety Performance Trial at Rocky Ford in 20031.
Grain Test Plant
Variety Yield Moisture Weight Height Lodging2 bu/ac % lb/bu in 1-9 Platte 121.8 10.2 60.6 37 3 Prairie Red 119.1 8.8 58.4 38 2 Jagalene 116.8 9.5 59.3 37 2 Wesley 116.6 10.0 60.0 36 1 CO99W183 116.6 9.0 59.5 37 5 CO99W254 116.3 10.4 61.3 38 3 CO99W329 111.8 9.7 60.2 36 3 CO99314 110.2 10.3 61.3 36 3 CO980630 109.3 9.9 59.0 38 4 CO970547-7 108.9 9.4 59.3 36 5 CO99141 108.9 9.6 60.1 37 4 CO980607 108.5 10.4 61.3 38 6 Ankor 108.5 10.6 61.1 40 2 CO99W192 108.4 9.0 58.5 37 3 Ok101 107.7 9.3 59.4 37 4 G980091-1 106.7 10.4 61.6 36 3 Antelope 106.5 10.5 61.5 38 5 G980122 105.6 10.2 60.5 38 2 Yuma 103.5 9.4 59.4 36 3 CO99W277 103.1 10.4 61.2 37 8 Kalvesta 101.3 10.2 60.7 37 3 Cisco 101.0 9.3 58.4 38 2 Ok102 101.0 9.8 60.4 33 1 Nuplains 98.6 10.5 60.8 38 2 Arrowsmith 98.6 11.3 61.5 41 5 CO970547-2 97.1 10.1 60.7 38 3 Dumas 96.1 10.4 61.3 37 2 2137 94.9 9.9 60.1 38 1 CO99W188 86.0 10.1 60.6 37 6 Venango 69.9 11.4 62.2 36 3 Average 105.3 10.0 60.3 37 3 LSD(0.30) 6.8
1Trial conducted at the Arkansas Valley Research Center; seeded 9/16/02 and harvested 7/02/03. 2Rating scale 1-9, with 1 = no lodging and 9 = completely lodged.
Notes: Plots looked very nice and uniform. No significant disease or insect problems. Significant lodging noted early June. Great trial.
Irrigated Forage Sorghum Hybrid Performance Test at Rocky Ford, 2003.
INVESTIGATOR: Frank C. Schweissing, Superintendent, Arkansas Valley Research Center, Rocky Ford, Colorado.
PURPOSE: To identify high yielding hybrids under irrigated conditions. PLOT: Two rows with 30" spacing,
32' long. SEEDING DENSITY: 96,800 Seed/A. PLANTED: June 12.
HARVESTED: September 17.
EMERGENCE DATE: ca. 10-14 days
after planting. SOIL TEMP: 610 F. IRRIGATION: Five furrow irrigations:
June 14, July 1, July 26, August 8, August 25, total applied ca. 18 acre-in/A. PEST CONTROL: Preemergence
Herbicide: glyphosate 1 lb. AI/A.
Postemergence Herbicide: dicamba .25 lbs. AI/A. Insecticide: none.
CULTURAL PRACTICES: Previous crop: corn.
Field Preparation: chisel, disc, roll, level, furrow out, rodweed. Cultivation: 2X.
SOIL: silty-clay loam, 1-1.5% O.M., pH-ca. 7.8. FERTILIZER: 52 lbs. P2O5 and 111 lbs. N/Acre.
COMMENTS: Irrigation water adequate, very hot July, stand-fair, weed control-fair, forage yields below average.
Summary: Growing Season Precipitation and Temperature/1
Arkansas Valley Research Center, Rocky Ford, Otero County.
_______________________________________________ _____
Month Rainfall GDD/2 >90F >100F DAP/3
_______________________________________________ ___ in. ---no. of days--- ---June 2.28 374 12 2 18 July 0.51 829 29 22 49 August 0.54 770 28 6 80 September 0.44 256 4 0 97 Total 3.77 2229 73 30 97 _______________________________________________ ___
/1 Growing season from June 12 (planting) to September 17 (harvest).
/2 GDD: Growing Degree Days for sorghum. /3 DAP: Days After Planting.
Table 1.-Irrigated Forage Sorghum Hybrid Performance Test at Rocky Ford, 20031
1 - Planted June 12, 2003; Harvest September 17, 2003
2 - Forage Type: FS, Forage Sorghum; SS, Sorghum Sudan grass
3 - Seed Maturation: PM, premilk; EM, early milk; MM, midmilk; LM, late milk; ED, early dough; SD, soft dough; HD, hard dough; MT, mature.
4 - Forage Yield adjusted to 70% moisture content based on oven-dried samples. 21
Days Plant Stage Yield
%
Brand Hybrid Forage To
50%
Density Plant At Stem Dry Forage of Test
Type2 Bloom 7/1/03 Ht. Harvest3 Sugar Matter Yield4 Avg.
(No.) Plants/A (1000 X) (Ins.) (%) (%) (T/A) (%) SORGHUM PARTNERS Sordan 79 SS 74 78.1 105 ED 2 26 24.54 119 SORGHUM PARTNERS SS 405 FS 96 62.9 108 EM 7 21 24.12 117 SORGHUM PARTNERS 1990 FS ---- 68.3 103 VEG 7 20 21.89 106 (Check) NB 305F FS 79 62.1 97 MM 15 25 21.70 105 SORGHUM PARTNERS Sordan Headless SS ---- 70.2 102 VEG 8 20 21.69 105 SORGHUM PARTNERS NK 300 FS 82 55.5 70 LM 12 24 21.04 102 CAL/WEST SEEDS CW 1-63-1 SS 76 66.2 91 LM 11 26 20.69 100 CAL/WEST SEEDS CW 1-63-4 SS 77 68.9 88 MM 11 27 20.65 100 CAL/WEST SEEDS CW 1-61-4 SS 76 55.5 92 LM 12 26 20.55 100 CAL/WEST SEEDS CW 1-61-1 SS 76 55.5 88 LM 11 26 20.30 100 CAL/WEST SEEDS CW 1-61-10 SS 76 67.2 88 LM 11 26 18.92 92 SORGHUM PARTNERS Trudan 8 SS 74 59.9 99 ED 8 31 18.83 91 CAL/WEST SEEDS CW 1-61-9 SS 78 52.8 88 MM 11 26 17.94 87 DEKALB DK 642 corn 67 34.0 72 MM 12 27 15.44 75 Average 78 61.2 92 10 25 20.59 LSD (0.20) 1.81 CV% 9.52
Soybean Variety Trial - 2003
Arkansas Valley Research Center
This is the fifth soybean trial at this Center in recent years. Trials were initiated in 1999 due to a renewed interest in oil crops. Precipitation for the year (9.23") was substantially better than last year, but still below normal. Irrigation water was adequate throughout the season. Trial yields averaged 62.0 bushels per acre for the trial compared to 75.9 bu. per acre in 2002, 68.8 bu. per acre in 2001, 66.0 bu. per acre in 2000 and 53.7 bu. per acre in 1999. Yields ranged from 57.0 to 66.0 bu. per acre.
Test Plot Information
Purpose - To evaluate the inherent genetic ability of selected soybean varieties to yield under irrigated conditions in the Arkansas Valley.
Data - 1. Yields
2. Growth factors
Plots - 32' X 10' (4 rows) Harvest-3 rows
Design - Randomized complete blocks (3 replications) Variety - 6 entries
Fertilizer - 52 lbs. P2O5 + 11 lbs. N/acre as 11-52-0 - 10/28/02
Equivalent of 15 oz. of soybean innoculant/300 lbs. of seed
Herbicide - Dual II Magnum 1.43 lbs. + Gramoxone Extra .625 lbs. AI/Acre - 5/12/03 Basagran .75 lbs. + Blazer .25 lbs. + Poast .28 lbs. AI/Acre - 6/9/03
Insecticide - none
Soil - Silty, clay loam, 1-1.5 o.m., pH - ca. 7.8 Plant - May 13, 2003
Irrigate - 6/26, 7/8, 7/21, 8/4, 8/21
Harvest - September 29, 2003 Self-propelled plot combine Jerry Johnson
Jim Hain
Soybean variety performance trial at Rocky Ford1
in 2003.
Test Plant Leaf Variety Yield Moisture Weight Height Dropping2
bu/ac % lb/bu in date
DG 37R39 66 7.1 55.7 33 259 DG 34P38 63 7.0 56.1 31 258 Triumph TR3752 (RR) 62 7.0 56.0 36 257 Garst 3824 RR/N 61 7.0 55.6 35 258 DG 3399 + RR 61 6.9 55.2 34 260 Garst 3135 (RR) 57 7.0 55.8 30 252 Average 62 7.0 55.7 33 257 LSD(0.30) 4
1Trial conducted at the Arkansas Valley Research Center; seeded 5/13 and harvested 9/29.
2Julian Date - 50% leaf drop.
2-Yr average soybean variety performance at Rocky Ford in 2002-03.
Test
Variety Yield Moisture Weight
bu/ac % lb/bu DG 3399 + RR 75 7.7 54.8 Triumph TR3752 (RR) 71 7.9 55.8 Garst 3135 (RR) 70 7.7 55.7 Average 72 7.8 55.4 23
2003 VEGETABLE CROP REPORTS
Onion Variety Trial
Mike Bartolo Frank Schweissing
Arkansas Valley Research Center
Colorado State University
PRODUCTION INFORMATION
Plots - planted 20' long X 2 rows (3.3')
wide. 16" X 24" - 2.5" spacing. Harvest 16' of row. Each plot was replicated four times in the trial.
Planted - March 7th , 2003
Fertilizer - 104 lbs. P2O5/A and 22 lbs N/A
as 11-52-0 - preplant. ~ 100 lbs. N/A residual.
Weed Control - Prowl 3.3E (1.0 AI/A) +
Roundup Ultra (0.75 lbs AI/A) on March 31st -Goal 2 (0.25 lbs. AI/A) on May 9th
-Goal 2 (0.25 lbs. AI/A) + Dual II (0.96 lbs AI/A) on June 25th ( All ground applications) -Hand weeded 2 times
Insect Control - None Applied (low thrips
populations were detected)
Disease Control - Mancocide (1.5 AI/A) on
July 3rd .
Irrigation - 11 times (approximately 2"
Harvest - September 2nd
Grade - November 10th - 12th
Comments
The 2003 season was one of the hottest ever recorded in the Rocky Ford area. There were 22 days in July that registered 100 oF or above. Three days registered 107 oF during that period. High temperatures during the bulbing period contributed to lower yields and smaller bulb sizes. Although there was not a shortage of irrigation water, the hot and dry conditions made it difficult to keep the crop from experiencing moisture stress. On a positive note, onions thrips populations were low
throughout the season and as a result, the trial did not require any insecticide applications. Disease pressure was low until the end of the season and did not have an influence on bulb quality.
In general, the longer season Spanish varieties like X-202 (Tequilla), X-201 (Mesquite) and SR7009N and SR7008N performed well under the stressful conditions.
25
ONION VARIETY TRIAL
Arkansas Valley Research Center
Colorado State University, Rocky Ford, Colorado, 2003
Variety Source Maturity (% tops down) 8-19 Colossals $ 4" % Jumbos 3"-4" % Medium 2¼"-3" % C J M CWT/A Pre-Pack 1¾"-2¼" % Total Market. CWT/A Culls % Total Weight CWT/A X-202 Waldow 28 0.0 73.2 22.5 461.4 1.5 468.8 2.6 482.6 SR7009N Sunseeds 30 0.0 55.6 38.0 437.3 5.1 460.6 1.1 465.9 SR7008N Sunseeds 30 0.0 63.8 32.5 434.5 3.6 451.2 0.0 451.2 Mesquite D. Palmer 18 0.0 71.8 24.4 432.4 2.2 442.6 1.3 448.8 Torero Sunseeds 20 0.0 70.2 25.7 430.6 1.7 437.7 2.2 446.7 X-201 Waldow 23 0.0 67.2 26.3 418.5 2.8 431.6 3.5 447.9 Cannonball Seminis 30 0.0 53.3 40.6 414.0 3.6 430.4 2.3 440.6 Colorado 6 Burrell 10 1.4 68.9 24.5 408.7 3.5 423.8 1.6 430.4 Harmony Cookham 30 0.0 41.9 52.7 408.7 3.2 423.0 2.0 432.0 Ranchero Sunseeds 28 0.0 57.7 36.7 402.2 3.6 417.3 1.9 426.3 Santa Fe Seminis 30 0.0 64.8 29.9 403.4 3.1 416.1 2.0 423.8 SR7004ON Sunseeds 43 0.0 36.0 60.2 398.1 3.7 414.0 0.0 414.0 Cometa (W) Sunseeds 40 0.0 49.6 45.6 392.0 4.6 410.8 0.0 410.8 Colorado 6 Waldow 10 0.0 65.9 24.2 387.9 3.9 404.6 5.8 430.4
Sweet Perfection Crookham 40 0.0 55.2 38.9 384.6 3.9 401.0 1.8 407.9
T-433 Takii 18 0.0 59.8 35.6 383.4 3.3 399.7 0.0 399.7
Granero Sunseeds 63 0.0 37.1 58.0 382.2 3.9 397.7 0.8 401.8
DPSX 1171 D. Palmer 40 0.0 41.9 50.0 367.9 4.9 387.5 3.0 399.3
26 Variety Source Maturity (% tops down) 9-12 Colossals $ 4" % Jumbos 3"-4" % Medium 2¼"-3" % C J M CWT/A Pre-Pack 1¾"-2¼" % Total Market. CWT/A Culls % Total Weight CWT/A OLYS97-24 Crookham 20 0.0 42.7 47.2 360.5 5.9 383.0 4.0 397.7 Vaquero Sunseeds 55 0.0 37.5 54.1 348.3 6.9 374.4 1.4 380.1 Tequilla D. Palmer 25 0.0 70.3 25.4 358.1 2.4 367.5 1.8 375.2 Tioga Seminis 43 0.0 31.6 62.1 341.8 6.2 363.4 0.0 363.4 Delgado Bejo 23 0.0 27.2 65.8 337.7 5.7 357.3 1.0 361.0 DPSX 1172 D. Palmer 43 1.7 33.5 55.0 320.1 4.1 334.8 5.4 354.8 SR7003ON Sunseeds 30 0.0 30.3 63.0 311.5 6.6 333.6 0.0 333.6 Tamara Bejo 23 0.0 13.1 73.0 289.1 13.0 331.1 0.7 334.0 Daytona Bejo 15 0.0 22.7 67.3 297.7 9.4 329.9 0.4 331.6 OLYX00-23 Crookham 78 0.0 18.7 63.9 256.0 17.2 305.0 0.0 305.0 SR9000ON Sunseeds 28 0.0 18.2 68.7 266.2 12.3 303.8 0.6 305.8 Flare (R) Seminis 40 0.0 25.9 62.9 279.0 7.3 301.7 3.8 313.6 Redwing (R) Bejo 10 0.0 18.7 66.7 274.0 7.5 298.5 6.9 321.3 BGS 167 Bejo 18 0.0 38.5 55.3 274.0 6.0 290.7 0.0 290.7 Gladstone (W) Bejo 38 0.0 25.8 57.1 246.6 14.0 283.0 2.9 293.2
Blanco Duro (W) Burrell 45 0.0 15.7 66.1 235.2 16.9 278.9 1.1 282.5
Gunnison Bejo 43 0.0 7.6 69.6 202.5 20.9 254.4 1.7 258.9 Genesis Crookham 55 0.0 0.0 63.8 136.3 35.0 207.4 1.0 209.9 OLYH99-2900 Crookham 45 0.0 2.2 74.0 157.6 21.6 197.2 1.9 200.9 Flamenco Sunseeds 33 0.0 2.2 67.2 134.7 28.1 191.9 2.2 196.8 Winston Bejo 25 0.0 0.0 71.3 136.8 26.3 187.0 2.2 191.1 DPS 3015 (R) D. Palmer 90 0.0 5.3 50.3 80.0 44.3 146.6 0.0 146.6
2003 Onion – Adjuvant Study
October 10, 2003
Dr. Howard F. Schwartz and David H. Gent, Dept. of Bioagricultural Sciences and Pest Management, Colorado State University, Fort Collins, CO 80523-1177
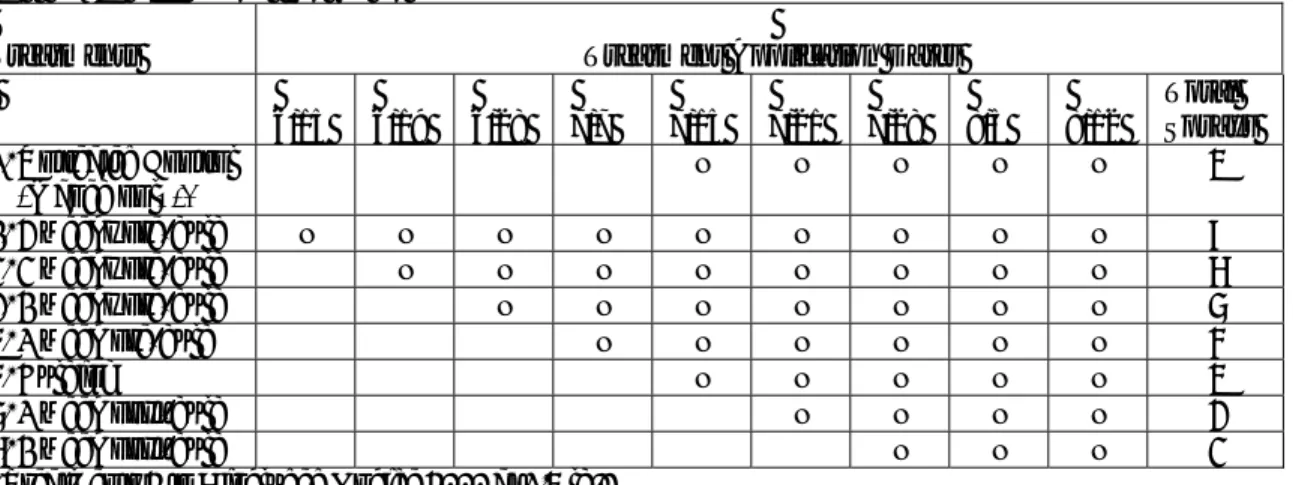
Objective: The objective of this study was to evaluate the effectiveness of various commercially-accepted adjuvants in enhancing the activity of fixed-copper bactericides and EBDC fungicides for management of the onion bacterial disease complex.
Experimental Design: Direct seeded onion plots were established at the Irrigation Research Farm in Yuma with the yellow onion variety ‘Vantage’. All treatments were applied in 25 gallons of water per acre with a CO2 backpack at 32 psi pressure, using Teejet 8002 flat-fan nozzles (2 per bed of 2 onion
lines). Plots were one 30” wide row by 30 feet in length. The experiment was a randomized complete block design with 4 replicates. Irrigation was by center pivot and all plots were watered two to three times per week.
The field was furrow irrigated and grown according to standard production practices. Treatments: Product/Acre (unless otherwise stated):
1. Untreated Control
2. NuCop 50 DF + Maneb 75 DF 2.0 lb/A + 2.0 lb/A
3. NuCop 50 DF + Maneb 75 DF+Latron AG-98 2.0 lb/A + 2.0 lb/A + 0.5% (v/v) 4. NuCop 50 DF + Maneb 75 DF+Bond 2.0 lb/A + 2.0 lb/A + 0.25% (v/v) 5. NuCop 50 DF + Maneb 75 DF + Kinetic 2.0 lb/A + 2.0 lb/A + 0.5% (v/v) 6. NuCop 50 DF + Maneb 75 DF +AeroDynamic 2.0 lb/A + 2.0 lb/A + 2.0% (v/v)
Treatment Application Dates: Plot Inoculations: 108/ml bacterial cell suspension (1) 13 July of Xanthomonas axonopodis pv. allii strain RO177
(2) 20 July (1) 11 August (3) 27 July (2) 18 August (4) 3 August (5) 9 August (6) 20 August (7) 23 August (8) 30 August (9) 5 September
Disease Notes and Evaluations:
7/29/03 Trace Xanthomonas leaf blight observed in plots
8/21/03 First disease evaluation. 5-10% disease intensity in untreated plots
8/29/03 Second disease evaluation. Percent foliage infected or killed from bacterial disease complex and/or phytotoxicity
9/09/03 Third disease evaluation.
9/23/03 Selected plots harvested. Ten bulbs were randomly selected, weighed, and cut open to check for bulb rot.
Results:
Table 1. Yuma Onion Bacterial Complex: Disease and Yield Measurements1
Yield (10 bulb weight)
1 Treatments followed by the same letter are not significantly different at α =0.05.
Discussion:
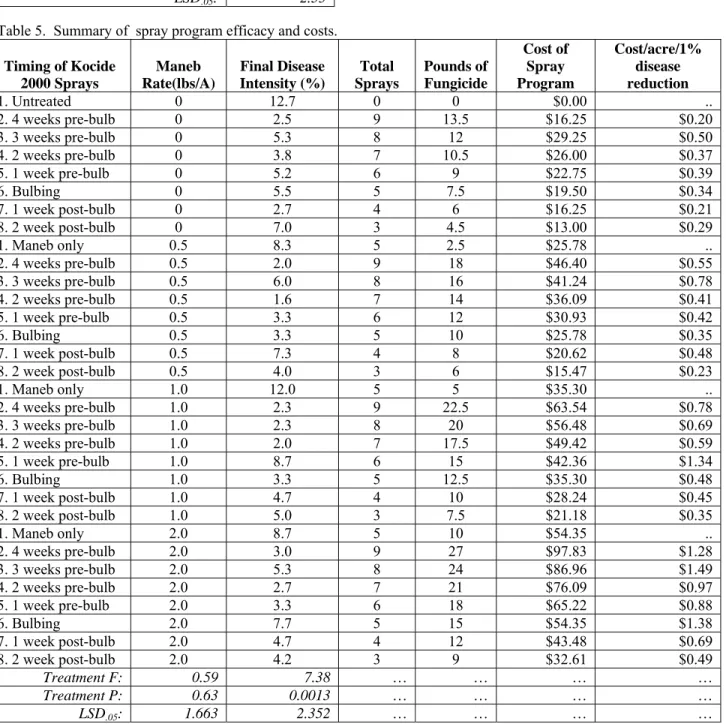
Phytotoxicity was observed with treatments amended with Kinetic or Areo Dyneamic after two weekly applications. Considerable tip death and leaf scalding was found in all replications of treatments including these adjuvants. No yield reduction was observed with Kinetic compared to the untreated or NuCop 50DF + Maneb 75DF alone. NuCop 50 DF + Maneb 75DF without or with Kinetic significantly reduced the severity of disease late in the season, but Bond treatments were not significantly different from the untreated. No treatment significantly reduced the relative area under the disease progress curve, improved yield, or reduced bulb rot compared to the untreated.
Under high disease pressure, the organosilicone surfactant Kinetic and the no adjuvant treatments provided the best suppression of Xanthomonas leaf blight. In previous years we have observed a significant yield reduction with Kinetic in the absence of disease. A benefit may only be observed from copper bactericides amended with Kinetic when disease pressure is high.
ACKNOWLEDGEMENTS: We gratefully acknowledge partial financial assistance from the CSU
Agr. Experiment Station, Arkansas Valley Growers and Shippers Association, and Colorado Onion Association.
Treatment 8/21/03 8/29/03 9/9/03 rAUDPC Yield
(lbs/10 bubls)
Bulb rot (%)
1. Untreated Control 7.33a 40.50a 46.67ab 0.179a 2.33a 61.3a
2. NuCop 50 DF + Maneb 75DF 6.50a 30.00b 40.00ab 0.143a 3.00a 51.5a 3. NuCop 50 DF + Maneb 75DF +
Latron AF-98
5.75a 34.00ab 48.75a 0.162a . . 4. NuCop 50 DF + Maneb 75DF +
Bond
6.00a 40.50a 50.00a 0.179a . . 5. NuCop 50 DF + Maneb 75DF +
Kinetic
8.00a 28.00b 33.75b 0.137a 3.00a 45.0a 6. NuCop 50 DF + Maneb 75DF +
Aero Dyneamic 8.00a 36.00ab 45.50ab 0.167a . .
C.V.%: 52.78 16.94 20.52 18.92 39.30 54.11 Treatment F Value: 0.55 2.05 1.37 1.07 0.77 1.12 Treatment P Value: 0.80 0.11 0.28 0.44 0.61 0.45 LSD: 5.51 8.90 13.49 0.046 2.57 2.57