Tec hni c al Report
TR11-03 April, 2011
Ag
ricultural
Experiment Station
College of Agricultural Sciences Department of Bioagricultural Sciences and PestManagement
2010 Colorado Field Crop
Insect Management Research
and Demonstration Trials
2010 Colorado Field Crop
Insect Management Research
and Demonstration Trials
1Frank B. Peairs2
Jeff Rudolph2
Terri L. Randolph2
Mention of a trademark or proprietary product does not constitute endorsement by the Colorado Agricultural
1
Experiment Station.
Department of Bioagricultural Sciences and Pest Management, Colorado State University
2
Colorado State University is an equal opportunity/affirmative action institution and complies with all Federal and Colorado State laws, regulations, and executive orders regarding affirmative action requirements in all programs. The Office of Equal Opportunity is located in 101 Student Services. In order to assist Colorado State University in meeting its affirmative action responsibilities, ethnic minorities, women, and other protected class members are encouraged to apply and to so identify themselves.
TABLE OF CONTENTS
CONTROL OF BIOTYPE 2 RUSSIAN WHEAT APHID IN WINTER WHEAT WITH HAND-APPLIED INSECTICIDES, ARDEC, FORT COLLINS,
CO, 2010.. . . 2
CONTROL OF APHIDS IN SPRING BARLEY WITH HAND-APPLIED INSECTICIDES, ARDEC, FORT COLLINS, CO, 2010. . . 4
CONTROL OF ALFALFA INSECTS IN ALFALFA WITH HAND-APPLIED INSECTICIDES, ARDEC, FORT COLLINS, CO, 2010. . . 8
CONTROL OF WESTERN CORN ROOTWORM IN FIELD CORN WITH PLANTING-TIME SOIL INSECTICIDES, SEED TREATMENTS, AND PLANT-INCORPORATED PROTECTANTS, ARDEC, FORT COLLINS, CO, 2010. . . 11
TRANSGENIC TRAITS FOR CONTROL OF WESTERN BEAN CUTWORM IN FIELD CORN, ARDEC, FORT COLLINS, CO, 2010.. . . 12
CONTROL OF SPIDER MITES IN CORN WITH HAND-APPLIED INSECTICIDES AND MITICIDES, ARDEC, FORT COLLINS, CO, 2010.. . . 14
2010 PEST SURVEY RESULTS. . . 20
INSECTICIDE PERFORMANCE SUMMARIES. . . 23
ACKNOWLEDGMENTS. . . 27
CONTROL OF BIOTYPE 2 RUSSIAN WHEAT APHID IN WINTER WHEAT WITH HAND-APPLIED INSECTICIDES, ARDEC, FORT COLLINS, CO, 2010
Jeff Rudolph, Terri Randolph, Frank Peairs, Tyler Keck, Jack Mangles, Mariana Chapela, and Sheri Hesler, Department of Bioagricultural Sciences and Pest Management
CONTROL OF RUSSIAN WHEAT APHID IN WINTER WHEAT WITH HAND-APPLIED INSECTICIDES, ARDEC, FORT COLLINS, 2
CO, 2010: Treatments were applied on 17 May 2010 with a 'rickshaw-type' CO powered sprayer calibrated to apply 20
gal/acre at 3 mph and 32 psi through three 8002 (LF2) nozzles mounted on a 4.0 ft boom. Conditions were clear and calm with temperatures of 65EF during the time of treatment. Plots were 6 rows (5.0 ft) by 28.0 ft and were arranged in six replicates of a randomized, complete block design. Crop stage at application was late stem elongation (Zadoks 37). The crop had been infested with greenhouse-reared aphids on 12 March 2010.
Treatments were evaluated for Russian wheat aphid control by collecting 20 symptomatic tillers along the middle four rows of each plot 4, 7, 14 and 21 days after treatment (DAT). Tiller samples were placed in Berlese funnels for 24 hours to extract aphids into alcohol for counting. Symptomatic tiller samples taken the day before treatment averaged 18.3 Russian wheat aphids per tiller.
Aphid counts were transformed by the square root + ½ method (7 and 14 DAT) or the log + 1 method (4 DAT and 21 DAT) to correct for nonadditivity, and transformed counts were used for analysis of variance and mean separation by Tukey’s HSD test (á=0.05). Original means are presented in Table 1. Total aphid days for each treatment were calculated according to the method of Ruppel (Journal of Economic Entomology 76: 375-7, 1983), transformed by the log + 1 method, and analyzed in the same manner, with original means presented in Table 1. Reductions in insect days were calculated by Abbott's (1925) formula: (percent reduction = ((untreated-treated)/untreated) X 100).
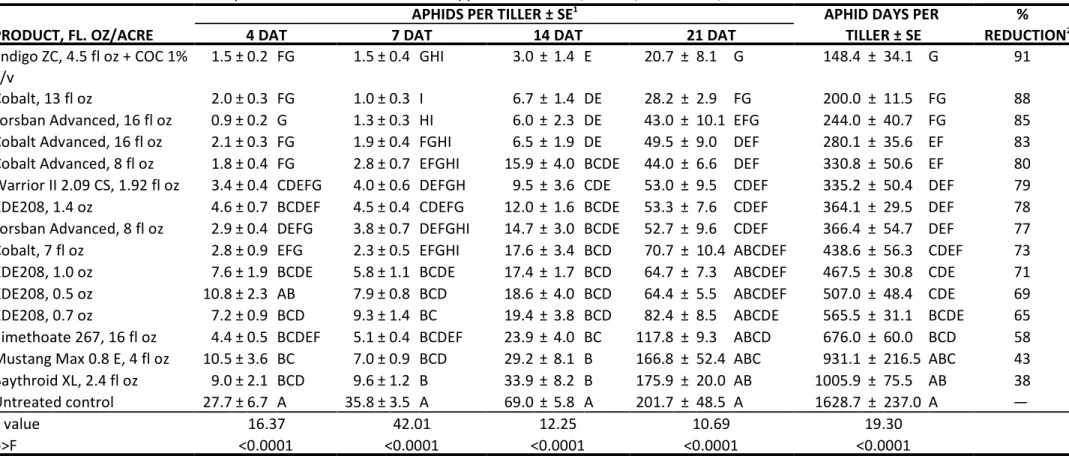
Aphid pressure was much more severe than in 2008 or 2009, with approximately 200 aphids/tiller in the untreated control 21 DAT (Table 1) compared to 32 and 27 in 2009 and 2008, respectively. Crop condition was excellent. All treatments, except Mustang Max, 4 fl oz, and Baythroid XL, 2.4 fl oz, had fewer aphid days than the untreated control. Endigo ZC, 4.5 fl oz + COC 1% v/v, was the only treatment that reduced total aphid days over three weeks by 90% or more, the level of performance observed by the more effective treatments in past experiments. No phytotoxicity was observed with any treatment.
Field History
Pest: Russian wheat aphid, Diuraphis noxia (Kurdjumov)
Cultivar: 'Hatcher'
Planting Date: 11 September 2009
Irrigation: Single irrigation post planting, linear move sprinkler with drop nozzles Crop History: Fallow in 2009
Herbicide: Huskie 11 oz + 6 gal 32-0-0 per acre Insecticide: None prior to experiment
Fertilization: Herbicide application provided 18 lb N/acre Soil Type: Sandy clay loam
Table 1. Control of Russian wheat aphid in winter wheat with hand-applied insecticides, ARDEC, Fort Collins, CO. 2010.
APHIDS PER TILLER ± SE1 APHID DAYS PER % PRODUCT, FL. OZ/ACRE 4 DAT 7 DAT 14 DAT 21 DAT TILLER ± SE REDUCTION2 Endigo ZC, 4.5 fl oz + COC 1%
v/v
1.5 ± 0.2 FG 1.5 ± 0.4 GHI 3.0 ± 1.4 E 20.7 ± 8.1 G 148.4 ± 34.1 G 91
Cobalt, 13 fl oz 2.0 ± 0.3 FG 1.0 ± 0.3 I 6.7 ± 1.4 DE 28.2 ± 2.9 FG 200.0 ± 11.5 FG 88
Lorsban Advanced, 16 fl oz 0.9 ± 0.2 G 1.3 ± 0.3 HI 6.0 ± 2.3 DE 43.0 ± 10.1 EFG 244.0 ± 40.7 FG 85
Cobalt Advanced, 16 fl oz 2.1 ± 0.3 FG 1.9 ± 0.4 FGHI 6.5 ± 1.9 DE 49.5 ± 9.0 DEF 280.1 ± 35.6 EF 83
Cobalt Advanced, 8 fl oz 1.8 ± 0.4 FG 2.8 ± 0.7 EFGHI 15.9 ± 4.0 BCDE 44.0 ± 6.6 DEF 330.8 ± 50.6 EF 80
Warrior II 2.09 CS, 1.92 fl oz 3.4 ± 0.4 CDEFG 4.0 ± 0.6 DEFGH 9.5 ± 3.6 CDE 53.0 ± 9.5 CDEF 335.2 ± 50.4 DEF 79
XDE208, 1.4 oz 4.6 ± 0.7 BCDEF 4.5 ± 0.4 CDEFG 12.0 ± 1.6 BCDE 53.3 ± 7.6 CDEF 364.1 ± 29.5 DEF 78
Lorsban Advanced, 8 fl oz 2.9 ± 0.4 DEFG 3.8 ± 0.7 DEFGHI 14.7 ± 3.0 BCDE 52.7 ± 9.6 CDEF 366.4 ± 54.7 DEF 77
Cobalt, 7 fl oz 2.8 ± 0.9 EFG 2.3 ± 0.5 EFGHI 17.6 ± 3.4 BCD 70.7 ± 10.4 ABCDEF 438.6 ± 56.3 CDEF 73
XDE208, 1.0 oz 7.6 ± 1.9 BCDE 5.8 ± 1.1 BCDE 17.4 ± 1.7 BCD 64.7 ± 7.3 ABCDEF 467.5 ± 30.8 CDE 71
XDE208, 0.5 oz 10.8 ± 2.3 AB 7.9 ± 0.8 BCD 18.6 ± 4.0 BCD 64.4 ± 5.5 ABCDEF 507.0 ± 48.4 CDE 69
XDE208, 0.7 oz 7.2 ± 0.9 BCD 9.3 ± 1.4 BC 19.4 ± 3.8 BCD 82.4 ± 8.5 ABCDE 565.5 ± 31.1 BCDE 65
dimethoate 267, 16 fl oz 4.4 ± 0.5 BCDEF 5.1 ± 0.4 BCDEF 23.9 ± 4.0 BC 117.8 ± 9.3 ABCD 676.0 ± 60.0 BCD 58
Mustang Max 0.8 E, 4 fl oz 10.5 ± 3.6 BC 7.0 ± 0.9 BCD 29.2 ± 8.1 B 166.8 ± 52.4 ABC 931.1 ± 216.5 ABC 43
Baythroid XL, 2.4 fl oz 9.0 ± 2.1 BCD 9.6 ± 1.2 B 33.9 ± 8.2 B 175.9 ± 20.0 AB 1005.9 ± 75.5 AB 38
Untreated control 27.7 ± 6.7 A 35.8 ± 3.5 A 69.0 ± 5.8 A 201.7 ± 48.5 A 1628.7 ± 237.0 A —
F value 16.37 42.01 12.25 10.69 19.30
p>F <0.0001 <0.0001 <0.0001 <0.0001 <0.0001
SE, standard error of the mean. Means in the same column followed by the same letter(s) are not statistically different, Tukey’s HSD (á=0.05).
1
% reduction in total aphid days per tiller, calculated by the Ruppel method.
CONTROL OF APHIDS IN SPRING BARLEY WITH HAND-APPLIED INSECTICIDES, ARDEC, FORT COLLINS, CO, 2010
Jeff Rudolph, Terri Randolph, Frank Peairs, Tyler Keck, Jack Mangles, Mariana Chapela, and Sheri Hessler, Department of Bioagricultural Sciences and Pest Management
CONTROL OF RUSSIAN WHEAT APHID BIOTYPE 2 IN SPRING BARLEY WITH HAND-APPLIED INSECTICIDES, ARDEC, FORT COLLINS, CO, 2010: Treatments were applied on 9 June 2010 with a ‘rickshaw-type' CO2 powered sprayer
calibrated to apply 20 gal/acre at 3 mph 32 psi through three 8004 (LF4) nozzles mounted on a 5.0 ft boom. Conditions were mostly cloudy with E wind at <2 mph and air temperature of 65EF (start) to 68EF (finish) at the time of treatment. Plots were 6 rows (5.0 ft) by (30 ft) and were arranged in six replicates of a randomized, complete block design. Crop stage at application was late jointing (Zadoks 31). The crop had been infested with greenhouse-reared aphids on 28 May 2010.
Treatments were evaluated for Russian wheat aphid abundance by collecting 20 symptomatic tillers along the middle four rows of each plot 2, 7, 14, and 21 days after treatment (DAT). Tiller samples were placed in Berlese funnels for 24 hours to extract aphids into alcohol for counting. Symptomatic tiller samples taken on 7 June 2010 averaged 11.0 Russian wheat aphids per tiller. Russian wheat aphid counts were transformed by the square root + ½ method (14 DAT) or the log + 1 method (2, 7 and 21 DAT) to correct for nonadditivity, and transformed counts were used for analysis of variance and mean separation by Tukey’s HSD test (á=0.05). Original means are presented in Table 1. Total aphid days for each treatment, starting at the precount, were calculated according the method of Ruppel (Journal of Economic Entomology 76: 375-7, 1983), transformed by the log + 1 method, and analyzed in the same manner, with original means presented in Table 1. Reductions in insect days were calculated by Abbott's (1925) formula: (percent reduction = ((untreated-treated)/untreated) X 100).
The experiment also was affected by a naturally occurring bird cherry-oat aphid infestation. Abundance of this aphid was evaluated by counting individuals extracted from the Russian wheat aphid samples. Bird cherry-oat aphid counts were transformed by the square root + ½ method (21 DAT) or the log + 1 method (2, 7 and 14 DAT) to correct for nonadditivity, and transformed counts were used for analysis of variance and mean separation by Tukey’s HSD test (á=0.05). Original means are presented in Table 2. Total aphid days for each treatment, starting at 2 DAT, were
calculated according the method of Ruppel (Journal of Economic Entomology 76: 375-7, 1983), transformed by the log + 1 method, and analyzed in the same manner, with original means presented in Table 3. Reductions in aphid days were calculated by Abbott's (1925) formula: (percent reduction = ((untreated-treated)/untreated) X 100).
Russian wheat aphid pressure was less severe than in the artificially-infested winter wheat experiments conducted this season, with about 119 aphids/tiller in the untreated control 21 DAT compared to 200 aphids per tiller in the winter wheat trial. However, this infestation was much more severe than in previous barley experiments with 2 and 7 aphids per tiller 21 DAT in 2008 and 2009, respectively. All treatments had fewer aphids than the untreated control 2, 7 and 14 DAT. All treatments except the Baythroid XL, 2.4 fl oz, had fewer aphids per tiller 21 DAT, and all treatments had fewer total aphid days than the untreated control. All treatments except Baythroid XL, 2.4 fl oz, and Warrior II 2.09 CS, 1.92 fl oz, provided 90% reduction in aphid days, which is considered good control of Russian wheat aphid in winter wheat. No phytotoxicity was observed with any treatment.
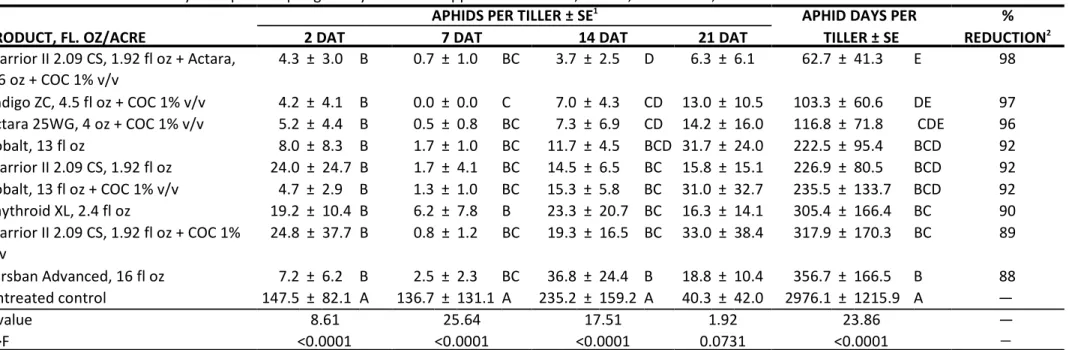
Bird cherry-oat aphid infestations had not been observed in previous barley experiments. All treatments had fewer bird cherry-oat aphids than the untreated control 14 DAT. However, by 21 DAT the infestation had declined to 40 aphids per tiller in the untreated control from 235 14 DAT, and no differences were observed among treatments. All treatments except Warrior II 2.09 CS, 1.92 fl oz + COC 1% v/v, and Lorsban Advanced, 16 fl oz, reduced total aphid days per tiller by 90%, which is considered good control of Russian wheat aphid in winter wheat.
Field History:
Pest: Russian wheat aphid, Diuraphis noxia (Kurdjumov) Bird cherry-oat aphid, Rhopalosiphum padi (L.)
Cultivar: ‘Baroness’
Planting Date: 12 April 2010
Irrigation: Post planting, linear move sprinkler with drop nozzles Crop History: Field corn in 2009
Herbicide: None
Insecticide: None prior to experiment Fertilization: None
Soil Type: Sandy clay loam
Table 2. Control of Russian wheat aphid in spring barley with hand-applied insecticides, ARDEC, Fort Collins, CO. 2010.
APHIDS PER TILLER ± SE1 APHID DAYS PER % PRODUCT, FL. OZ/ACRE 2 DAT 7 DAT 14 DAT 21 DAT TILLER ± SE REDUCTION2
Lorsban Advanced, 16 fl oz 0.9 ± 0.4 E 0.5 ± 0.2 D 0.4 ± 0.3 C 1.9 ± 1.9 D 47.7 ± 15.0 F 98
Cobalt, 13 fl oz + COC 1% v/v 1.1 ± 0.4 DE 0.4 ± 0.3 D 1.4 ± 1.7 C 4.3 ± 7.0 D 84.0 ± 49.2 F 97
Endigo ZC, 4.5 fl oz + COC 1% v/v 1.5 ± 0.6 CDE 0.7 ± 0.3 CD 1.6 ± 1.7 C 3.7 ± 2.0 CD 89.4 ± 33.2 EF 97
Cobalt, 13 fl oz 1.3 ± 1.4 DE 0.5 ± 0.2 CD 1.0 ± 1.0 C 7.3 ± 8.3 CD 102.1 ± 47.1 DEF 96
Warrior II 2.09 CS, 1.92 fl oz + Actara, 2.6 oz + COC 1% v/v
2.7 ± 1.5 BCDE 0.7 ± 0.4 CD 1.3 ± 1.4 C 5.2 ± 3.2 CD 104.1 ± 42.8 DEF 96
Actara 25WG, 4 oz + COC 1% v/v 2.4 ± 1.2 BCDE 1.9 ± 1.0 C 4.8 ± 2.9 C 13.8 ± 7.1 BC 224.7 ± 58.1 CDE 92
Warrior II 2.09 CS, 1.92 fl oz + COC 1% v/v 4.1 ± 2.7 BCD 1.2 ± 1.0 CD 7.1 ± 3.4 C 15.4 ± 8.3 BC 271.9 ± 105.9 C 90 Warrior II 2.09 CS, 1.92 fl oz 4.5 ± 2.4 BC 1.4 ± 1.6 CD 12.3 ± 13.9 BC 8.3 ± 4.5 CD 301.1 ± 230.6 CD 89 Baythroid XL, 2.4 fl oz 6.2 ± 3.6 B 4.9 ± 1.9 B 32.0 ± 26.5 B 49.5 ± 33.0 AB 919.0 ± 542.6 B 66 Untreated control 21.9 ± 13.5 A 29.8 ± 16.5 A 98.1 ± 46.1 A 118.7 ± 61.4 A 2737.8 ± 1281.3 A — F value 18.32 48.87 29.43 15.00 35.73 p>F <0.0001 <0.0001 <0.0001 <0.0001 <0.0001
SE, standard error of the mean. Means in the same column followed by the same letter(s) are not statistically different, Tukey’s HSD (á=0.05).
1
% reduction in total aphid days per tiller, calculated by the Ruppel method.
Table 3. Control of bird cherry-oat aphid in spring barley with hand-applied insecticides, ARDEC, Fort Collins, CO. 2010.
APHIDS PER TILLER ± SE1 APHID DAYS PER % PRODUCT, FL. OZ/ACRE 2 DAT 7 DAT 14 DAT 21 DAT TILLER ± SE REDUCTION2 Warrior II 2.09 CS, 1.92 fl oz + Actara,
2.6 oz + COC 1% v/v
4.3 ± 3.0 B 0.7 ± 1.0 BC 3.7 ± 2.5 D 6.3 ± 6.1 62.7 ± 41.3 E 98
Endigo ZC, 4.5 fl oz + COC 1% v/v 4.2 ± 4.1 B 0.0 ± 0.0 C 7.0 ± 4.3 CD 13.0 ± 10.5 103.3 ± 60.6 DE 97
Actara 25WG, 4 oz + COC 1% v/v 5.2 ± 4.4 B 0.5 ± 0.8 BC 7.3 ± 6.9 CD 14.2 ± 16.0 116.8 ± 71.8 CDE 96
Cobalt, 13 fl oz 8.0 ± 8.3 B 1.7 ± 1.0 BC 11.7 ± 4.5 BCD 31.7 ± 24.0 222.5 ± 95.4 BCD 92 Warrior II 2.09 CS, 1.92 fl oz 24.0 ± 24.7 B 1.7 ± 4.1 BC 14.5 ± 6.5 BC 15.8 ± 15.1 226.9 ± 80.5 BCD 92 Cobalt, 13 fl oz + COC 1% v/v 4.7 ± 2.9 B 1.3 ± 1.0 BC 15.3 ± 5.8 BC 31.0 ± 32.7 235.5 ± 133.7 BCD 92 Baythroid XL, 2.4 fl oz 19.2 ± 10.4 B 6.2 ± 7.8 B 23.3 ± 20.7 BC 16.3 ± 14.1 305.4 ± 166.4 BC 90 Warrior II 2.09 CS, 1.92 fl oz + COC 1% v/v 24.8 ± 37.7 B 0.8 ± 1.2 BC 19.3 ± 16.5 BC 33.0 ± 38.4 317.9 ± 170.3 BC 89 Lorsban Advanced, 16 fl oz 7.2 ± 6.2 B 2.5 ± 2.3 BC 36.8 ± 24.4 B 18.8 ± 10.4 356.7 ± 166.5 B 88 Untreated control 147.5 ± 82.1 A 136.7 ± 131.1 A 235.2 ± 159.2 A 40.3 ± 42.0 2976.1 ± 1215.9 A — F value 8.61 25.64 17.51 1.92 23.86 — p>F <0.0001 <0.0001 <0.0001 0.0731 <0.0001 —
SE, standard error of the mean. Means in the same column followed by the same letter(s) are not statistically different, Tukey’s HSD (á=0.05).
1
% reduction in total aphid days per tiller, calculated by the Ruppel method.
CONTROL OF ALFALFA INSECTS IN ALFALFA WITH HAND-APPLIED INSECTICIDES, ARDEC, FORT COLLINS, CO, 2010
Jeff Rudolph, Terri Randolph, Frank Peairs, Tyler Keck, Jack Mangles, Roberta Armenta, Mariana Chapela, and Sheri Hessler, Department of Bioagricultural Sciences and Pest Management
CONTROL OF ALFALFA INSECTS IN ALFALFA WITH HAND-APPLIED INSECTICIDES, ARDEC, FORT COLLINS, CO, 2010: 2
Early treatments were applied on 10 May 2010 with a ‘rickshaw-type’ CO powered sprayer calibrated to apply 20 gal/acre at 3 mph and 30 psi through six XR8002VS nozzles mounted on a 10.0 ft boom. Early treatments were made approximately when army cutworm treatments are applied in the region. This was done to determine the effect of army cutworm treatment in alfalfa on subsequent alfalfa weevil larval densities. All other treatments were applied in the same manner on 20 May 2010. Conditions were clear, with temperatures of 51EF at the time of early treatments. Conditions were cloudy and temperatures of 68EF at the time of the later treatments. Plots were 10.0 ft by 25.0 ft and arranged in six replicates of a randomized, complete block design. Untreated control and Warrior II, 1.92 fl oz/acre, plots were replicated 12 times for a more accurate comparison of treatment effects on yield (insect counts from six reps of each treatment were included in the analyses described below). The crop was nine inches in height at the time of early treatments, 12 inches in height at the time of the later treatments.
Treatments were evaluated by taking ten 180 sweeps per plot with a standard 15 inch diameter insect net 4, 7, 14N
and 21 days after the later treatments (DAT). Alfalfa weevil larvae, alfalfa weevil adults and pea aphids were counted. A pretreatment sample was taken three days prior to the later treatments by taking 100, 180 sweepsN
across the experimental area. This sample averaged 0.3 and 1.0 alfalfa weevil larvae and pea aphids per sweep, respectively. Insect counts transformed by the square root + 0.5 method were used for analysis of variance and mean separation by Tukey’s HSD procedure (á=0.05). Original means are presented in the tables. Total insect days for each treatment were calculated according to the method of Ruppel (Journal of Economic Entomology 76: 375-7, 1983), transformed by the log + 1 method, and analyzed in the same manner, with original means presented in the tables. Yields were measured on 17 June 2010 by hand harvesting a 0.1 m area per plot. Samples were weighed2
wet and dry and converted to lbs of dry hay per acre prior to comparing yields of treated plots to those of untreated plots using a paired t-test.
Pea aphid and alfalfa weevil larval densities were greater than those observed in 2009. Alfalfa weevil abundance averaged 32.3 and 0.2 larvae per sweep in the untreated control 21 DAT in 2010 and 2009, respectively. Pea aphid abundance averaged 92.9 and 36.2 aphids per sweep in the untreated control 21 DAT in 2010 and 2009,
respectively. Adult alfalfa weevil were rare and counts were not analyzed. All treatments had fewer alfalfa weevil larvae at 4, 7, 14 and 21 DAT and fewer weevil days than the untreated control (Table 4). Only treatments
containing chlorpyrifos and the early Warrior treatment had fewer pea aphid days than the untreated control (Table 5). No phytotoxicity was observed with any treatment. The plots treated with Warrior II, 1.92 fl oz/acre, yielded 10% less than the untreated control. This difference was not significant (T=1.09, df=11; p=0.2980). Yield reduction measured since 1995 has averaged 6.9%, with a range of 0.0% to 20.9%.
Field History
Pests: Alfalfa weevil, Hypera postica (Gyllenhal); Pea aphid, Acyrthosiphon pisum (Harris)
Cultivar: Dekalb DKA41-18RR
Plant Stand: Good
Irrigation: Furrow, not irrigated in 2010
Crop History: Alfalfa since 2006
Herbicide: None
Insecticide: None prior to experiment
Fertilization: None
Soil Type: Sandy clay loam
Table 4. Control of alfalfa weevil larvae with hand-applied insecticides, ARDEC, Fort Collins, CO. 2010.
ALFALFA WEEVIL LARVAE PER 180E SWEEP ± SE1 WEEVIL DAYS
PRODUCT, FL. OZ/ACRE 4 DAT 7 DAT 14 DAT 21 DAT ± SE % REDUCTION2
Warrior II, 1.92 fl oz 0.5 ± 0.2 CD 0.2 ± 0.1 E 0.7 ± 0.1 D 0.4 ± 0.1 G 21.2 ± 2.0 G 95
Warrior II, 1.92 fl oz, early 0.2 ± 0.1 D 0.3 ± 0.1 DE 0.6 ± 0.2 D 1.3 ± 0.3 EFG 23.0 ± 1.6 FG 94
Mustang Max 0.8EC, 4 fl oz 0.5 ± 0.2 CD 0.3 ± 0.0 DE 1.3 ± 0.2 D 0.6 ± 0.2 FG 26.6 ± 1.3 EFG 93
Baythroid XL, 2.8 fl oz 0.5 ± 0.1 CD 0.3 ± 0.1 E 1.4 ± 0.6 D 0.7 ± 0.1 FG 27.1 ± 4.2 EFG 93
Baythroid XL, 2.8 fl oz, early 0.3 ± 0.1 D 0.4 ± 0.1 CDE 1.2 ± 0.4 D 1.7 ± 0.4 EFG 29.3 ± 3.6 EFG 92
Mustang Max 0.8EC, 4 fl oz, early 0.4 ± 0.1 CD 0.5 ± 0.1 CDE 0.9 ± 0.2 D 2.8 ± 0.2 E 31.9 ± 1.7 EF 92
Cobalt Advanced, 17 fl oz 0.5 ± 0.1 CD 0.6 ± 0.1 CDE 1.9 ± 0.2 D 1.9 ± 0.2 EF 36.5 ± 2.5 E 91
Cobalt, 19 fl oz 0.5 ± 0.1 CD 1.0 ± 0.5 CDE 1.3 ± 0.1 D 2.8 ± 0.7 E 37.5 ± 5.0 E 90
Cobalt Advanced, 19 fl oz 1.4 ± 0.4 BC 0.5 ± 0.1 CDE 1.8 ± 0.2 D 1.5 ± 0.2 EFG 38.5 ± 1.4 E 90
Cobalt, 19 fl oz, early 0.4 ± 0.1 CD 0.7 ± 0.1 CDE 1.9 ± 0.4 D 11.8 ± 1.7 CD 72.1 ± 9.2 D 82
Steward EC, 11.3 fl oz 1.5 ± 0.3 BC 1.5 ± 0.4 C 5.2 ± 0.9 C 10.2 ± 1.0 D 98.3 ± 9.0 CD 75 Lorsban Advanced 32 fl oz 0.8 ± 0.2 BCD 1.2 ± 0.2 CD 5.0 ± 0.7 C 15.7 ± 1.4 C 111.4 ± 10.2 C 71 Entrust Naturalyte 800 WP, 1.2 oz 2.1 ± 0.5 B 4.4 ± 0.6 B 12.8 ± 0.8 B 22.8 ± 1.9 B 213.1 ± 11.4 B 45 Untreated control 9.1 ± 0.7 A 12.9 ± 1.0 A 22.3 ± 2.6 A 32.3 ± 1.9 A 390.4 ± 21.8 A — F value 27.96 47.4 75.23 126.78 115.07 p>F <0.0001 <0.0001 <0.0001 <0.0001 <0.0001
SE, standard error of the mean. Means in the same column followed by the same letter(s) are not statistically different, Tukey’s HSD (á=0.05).
1
% reduction in total weevil days, calculated by the Ruppel method.
Table 5. Control of pea aphids in alfalfa with hand-applied insecticides, ARDEC, Fort Collins, CO. 2010.
PEA APHIDS PER 180E SWEEP ± SE1 APHID DAYS % PRODUCT, FL. OZ/ACRE 4 DAT 7 DAT 14 DAT 21 DAT ± SE REDUCTION2
Lorsban Advanced 32 fl oz 0.5 ± 0.1 I 1.8 ± 0.8 E 12.8 ± 3.7 B 40.5 ± 6.2 C 246.5 ± 37.9 D 75
Cobalt, 19 fl oz 0.6 ± 0.2 I 4.1 ± 1.8 E 13.0 ± 1.8 B 55.9 ± 8.0 BC 313.5 ± 33.5 CD 69
Cobalt Advanced, 19 fl oz 0.7 ± 0.1 HI 1.6 ± 0.4 E 14.5 ± 4.2 B 62.8 ± 10.8 BC 335.8 ± 64.0 CD 66
Cobalt Advanced, 17 fl oz 0.7 ± 0.1 HI 2.8 ± 1.4 E 18.5 ± 3.7 B 69.2 ± 9.1 ABC 392.8 ± 62.2 CD 61
Cobalt, 19 fl oz, early 2.4 ± 0.8 GHI 5.4 ± 1.4 DE 24.8 ± 2.8 B 72.9 ± 8.4 ABC 471.3 ± 40.4 BC 53
Warrior II, 1.92 fl oz, early 2.7 ± 0.8 GHI 5.2 ± 1.5 DE 23.6 ± 5.3 B 78.0 ± 15.5 ABC 481.0 ± 97.7 BC 52
Baythroid XL, 2.8 fl oz 3.9 ± 0.7 FGH 12.3 ± 1.1 CD 46.3 ± 6.0 A 99.8 ± 6.1 AB 757.5 ± 61.1 AB 24
Baythroid XL, 2.8 fl oz, early 10.2 ± 2.7 CDE 15.4 ± 2.2 C 48.0 ± 6.7 A 102.2 ± 14.3 AB 824.5 ± 100.4 A 17
Mustang Max 0.8EC, 4 fl oz, early 8.4 ± 1.2 DEF 16.8 ± 1.3 BC 52.4 ± 3.2 A 96.9 ± 8.5 AB 835.7 ± 48.0 A 16
Warrior II, 1.92 fl oz 15.5 ± 1.5 BCD 36.7 ± 5.2 A 46.9 ± 5.7 A 87.5 ± 10.5 AB 898.3 ± 61.9 A 10
Mustang Max 0.8EC, 4 fl oz 4.2 ± 0.6 EFG 14.1 ± 3.2 CD 60.1 ± 10.9 A 114.1 ± 18.2 A 915.2 ± 149.2 A 8
Entrust Naturalyte 800 WP, 1.2 oz 17.3 ± 3.2 BC 26.3 ± 4.9 ABC 51.5 ± 5.1 A 97.1 ± 19.6 AB 921.2 ± 107.3 A 8
Steward EC, 11.3 fl oz 21.6 ± 1.9 AB 30.8 ± 4.3 AB 56.3 ± 7.8 A 89.1 ± 11.1 AB 1019.0 ± 91.1 A -2
Untreated control 26.9 ± 1.8 A 34.9 ± 5.8 A 51.7 ± 9.5 A 92.9 ± 9.1 AB 999.3 ±97.7 A —
F value 48.78 28.04 20.16 4.84 24.75 —
p>F <0.0001 <0.0001 <0.0001 <0.0001 <0.0001
SE, standard error of the mean. Means in the same column followed by the same letter(s) are not statistically different, Tukey’s HSD (á=0.05). % reduction in total weevil days, calculated by the Ruppel method.
CONTROL OF WESTERN CORN ROOTWORM IN FIELD CORN WITH PLANTING-TIME SOIL INSECTICIDES, SEED TREATMENTS, AND PLANT-INCORPORATED PROTECTANTS, ARDEC, FORT COLLINS, CO, 2010
Jeff Rudolph, Terri Randolph, Frank Peairs, Tyler Keck, Jack Mangles, Mariana Chapela, and Sheri Hessler, Department of Bioagricultural Sciences and Pest Management.
CONTROL OF WESTERN CORN ROOTWORM IN FIELD CORN WITH PLANTING-TIME SOIL INSECTICIDES, SEED TREATMENTS, AND PLANT-INCORPORATED PROTECTANTS, ARDEC, FORT COLLINS, CO, 2010: All treatments were
planted on 18 May 2010. Granular insecticides were applied with modified Wintersteiger meters mounted on a two-row John Deere Maxi-Merge planter. T-band granular applications were applied with a 4-inch John Deere spreader located between the disk openers and the press wheel. Plots were one 25-ft row arranged in six replicates of a randomized complete block design.
Treatments were evaluated by digging three plants per plot on 13 July 2010. The roots were washed and the damage rated on the 0-3 node injury scale. Plot means were used for analysis of variance and mean separation by Tukey’s HSD method (á=0.05). Treatment efficiency was determined as the percentage of total plants per
treatment having a root rating of 0.25 or lower.
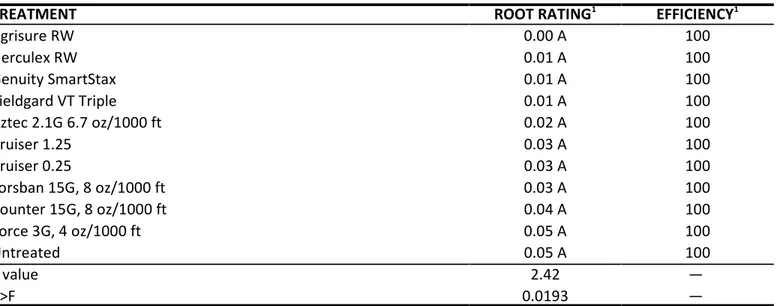
Western corn rootworm pressure was very low, even lower than observed in 2009 (Table 6). Damage rating in the untreated control averaged 0.53 and 0.05 in 2009 and 2010, respectively. No phytotoxicity was observed.
Field History
Pest: Western corn rootworm, Diabrotica virgifera virgifera LeConte
Cultivar: H7143, unless otherwise indicated
Planting Date: 18 May 2010
Plant Population: 29,500
Irrigation: Furrow
Crop History: Corn in 2009
Insecticide: None prior to experiment
Fertilization: 160 N, 40 P
Soil Type: Clay loam
Location: ARDEC, 4616 North Frontage Road, Fort Collins, CO 80524 (Block 3100)
Table 6. Commercial and experimental treatments for control of western corn rootworm, ARDEC, Fort Collins, CO.
2010.
TREATMENT ROOT RATING1 EFFICIENCY1
Agrisure RW 0.00 A 100 Herculex RW 0.01 A 100 Genuity SmartStax 0.01 A 100 Yieldgard VT Triple 0.01 A 100 Aztec 2.1G 6.7 oz/1000 ft 0.02 A 100 Cruiser 1.25 0.03 A 100 Cruiser 0.25 0.03 A 100 Lorsban 15G, 8 oz/1000 ft 0.03 A 100 Counter 15G, 8 oz/1000 ft 0.04 A 100 Force 3G, 4 oz/1000 ft 0.05 A 100 Untreated 0.05 A 100 F value 2.42 — p>F 0.0193 —
Means in the same column followed by the same letter(s) are not statistically different, Tukey’s HSD (á=0.05).
TRANSGENIC TRAITS FOR CONTROL OF WESTERN BEAN CUTWORM IN FIELD CORN, ARDEC, FORT COLLINS, CO, 2010
Frank Peairs, Terri Randolph, Jeff Rudolph, Tyler Keck, Jack Mangles, and Mariana Chapela, Department of Bioagricultural Sciences and Pest Management
TRANSGENIC TRAITS FOR CONTROL OF WESTERN BEAN CUTWORM IN FIELD CORN, ARDEC, FORT COLLINS, CO, 2010: The experiment was planted on 18 May 2010. Plants were infested during the green silk stage by using a
Davis insect inoculator (Davis, F. M. and T. G. Oswalt. 1979. Hand inoculator for dispensing lepidopterous insects. Agricultural Research [Southern Region], Science and Education Administration, USDA, New Orleans, LA. Southern Series 9) to place neonate western bean cutworm larvae mixed with corn cob grits on the silks. Larvae were hatched from field-collected egg masses purchased from Haarburg Consulting and Appel Crop Consulting. Plants were infested twice during the period 29 July - August 4 with an average of 41 larvae per primary ear. Plots in Experiment 1 consisted of three 20-ft rows and plots in Experiment 2 consisted of four 25-ft rows, arranged in six and four replicates, respectively, of a randomized complete block design. Ten plants were infested in the middle row of each plot in Experiment 1, and ten plants were infested in the two middle rows of each plot in Experiment 2. Treatments were evaluated on 16 September 2010 by opening the husks of the primary ear of each of the infested plants and counting damaged ears and larvae. The damaged area on each ear then was estimated by covering the tip of the ear with a grid printed on a sheet of transparent plastic and counting the grid squares subtended by feeding damage. Plot means were transformed by the square root + 0.5 method and then subjected to analysis of variance and mean separation by Tukey’s HSD method (á=0.05). Original means are presented in the tables. There was significant bird predation in both experiments, resulting in low and variable larval counts and damage estimates. In Experiment 1, the Genuity SmartStax trait had fewer infested ears than the susceptible control (Table 7). In Experiment 2, the Smartstax and Herculex XTRA traits had fewer larvae per ear than the Yieldgard VT Triple, and the Genuity Smartstax trait had fewer damaged ears and less damage per ear than the Yieldgard VT Triple and the susceptible control (Table 8). No larvae or damage were observed on Smartstax plants in either experiment.
Field History
Pest: Western bean cutworm, Striacosta albicosta (Smith)
Cultivar: Several
Planting Date: 18 May 2010
Plant Population: 29,500
Irrigation: Furrow
Crop History: Corn in 2009
Insecticide: None
Herbicide: Harness Extra 64 oz + 2,4-D 20.8 oz per acre Fertilization: 160 N, 40 P
Soil Type: Clay loam
Table 7. Western bean cutworm infestation and damage in transgenic field corn, Experiment 1, ARDEC, 2010. Trait Total WBC larvae1 Total damaged ears1 Total damage (cm )2 1
Genuity SmartStax 0.0 0.0 A 0.0
Herculex XTRA 0.0 0.8 AB 1.9
No trait 0.8 2.0 A 7.4
F value 1.62 4.82 3.76
p>F 0.2452 0.0342 0.0605
Total in 10 ears. Means in the same column followed by the same letter(s) are not statistically different, Tukey’s HSD (á=0.05).
1
Table 8. Western bean cutworm infestation and damage in transgenic field corn, Experiment 2, ARDEC, 2010. Trait Total WBC larvae1 Total damaged ears1 Total damage (cm )2 1
Genuity SmartStax 0.0 B 0.0 B 0.0 B Herculex XTRA 0.0 B 3.0 AB 8.2 AB YieldGard VT Triple 1.2 A 9.0 A 29.5 A No trait 0.2 AB 10.0 A 38.4 A F value 5.71 9.00 7.84 p>F 0.0181 0.0045 0.0070
Total in 20 ears. Means in the same column followed by the same letter(s) are not statistically different, Tukey’s HSD (á=0.05).
CONTROL OF SPIDER MITES IN CORN WITH HAND-APPLIED INSECTICIDES AND MITICIDES, ARDEC, FORT COLLINS, CO, 2010
Terri Randolph, Jeff Rudolph, Frank Peairs, Tyler Keck, Jack Mangles, Roberta Armenta, and Mariana Chapela, Department of Bioagricultural Sciences and Pest Management
CONTROL OF SPIDER MITES IN CORN WITH HAND-APPLIED INSECTICIDES AND MITICIDES, ARDEC, FORT COLLINS, CO, 2010: Early treatments were applied on 20 July 2010 using a 2 row boom sprayer mounted on a backpack
calibrated to deliver 17.8 gal/acre at 32 psi with three XR8002VS nozzles. All other treatments were applied in the same manner on 3 August 2010. Conditions were partly cloudy, calm winds and 68EF temperature at the time of early treatments. Conditions were clear, calm winds and 70EF temperature at the time of late treatments. Early treatments were applied at tassel emergence and late treatments were applied at brown silk. Plots were 25 ft by two rows (30 inch centers) and were arranged in six replicates of a randomized complete block design. Plots were separated from neighboring plots by a single buffer row. Plots were infested on 5 July 2010 by laying mite infested corn leaves, collected earlier that day in Prowers County, CO, across the corn plants on which mites were to be counted. On 12 July 2010, the experimental area was treated with permethrin 3.2E, 0.2 lb (AI)/acre to control beneficial insects and promote spider mite abundance.
Treatments were evaluated by collecting three leaves (ear leaf, 2nd leaf above the ear, 2nd leaf below the ear) from two plants per plot 1 day prior and 7, 14 and 21 days after the later treatments (DAT). Corn leaves were placed in Berlese funnels for 48 hours to extract mites into alcohol for counting. Extracted mites were identified as Banks grass mite or twospotted spider mite and counted. Grain yields were estimated for the Oberon 4SC, 4 fl oz + dimethoate 400 EC, 16 fl oz, treatment, the Portal, 32 fl oz, and the untreated control by harvesting the ears from 0.001 acre per plot, drying and shelling the ears, weighing the dried grain, and converting yields to bu/acre at 15.5% moisture. Mite counts were transformed by the square root + 0.5 to address nonadditivity issues. Total mite days were calculated by the method of Ruppel (J. Econ. Entomol. 76: 375-377). Counts and total mite days were subjected to analysis of variance and mean separation by Tukey's HSD method (á=0.05). Reductions in mite days were calculated by Abbott's (1925) formula: (percent reduction = ((untreated-treated)/untreated) X 100) using the average accumulated mite days of the untreated control. Grain yields were compared with ANOVA.
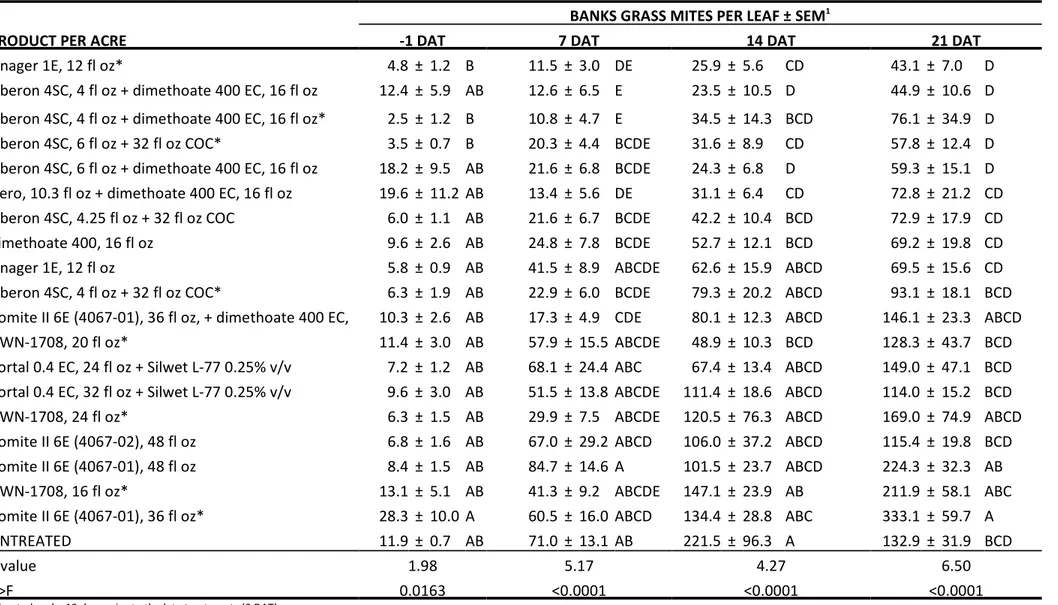
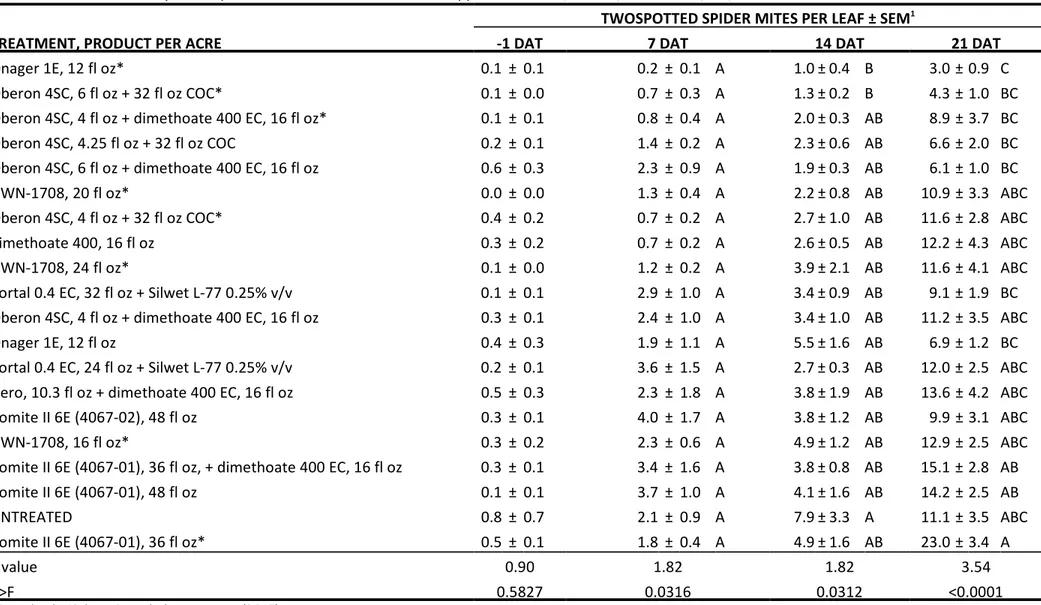
Untransformed counts for Banks grass mite, twospotted spider mite and total mites at -1, 7, 14 and 21 DAT are presented in Tables 1-3. Mite days accumulated at 21 DAT and reductions in mite days are presented in Table 4. Mite densities were high and substantially higher than 2008 and 2009, with approximately twice as many mites than in 2007, the most recent severe infestation. Banks grass mite was the predominant species for most counts. Onager 1E, 12 fl oz (applied early), Oberon 4SC, 4 fl oz + dimethoate 400 EC, 16 fl oz (applied early), Oberon 4SC, 4 fl oz + dimethoate 400 EC, 16 fl oz, Oberon 4SC, 6 fl oz + 32 fl oz COC (applied early), Oberon 4SC, 6 fl oz + dimethoate 400 EC, 16 fl oz, Hero, 10.3 fl oz + dimethoate 400 EC, 16 fl oz, Oberon 4SC, 4.25 fl oz + 32 fl oz COC, dimethoate 400, 16 fl oz, Oberon 4SC, 4 fl oz + 32 fl oz COC (applied early), Comite II 6E (4067-01), 36 fl oz, + dimethoate 400 EC, 16 fl oz, Onager 1E, 12 fl oz, GWN-1708, 20 fl oz (applied early) had fewer accumulated mite days than the
untreated control (Table 12). Product performance was similar for the two mite species (Tables 9-11). The Oberon + dimethoate (113 bu/acre) and the Portal treatment (103 bu/acre) outyielded the untreated control (86 bu/acre) by 24 and 16%, respectively. However, these differences were not significant (df=2, 10; F=3.13, p>F=0.0879). There was no phytotoxicity observed for any treatment.
Field History:
Pest: Banks grass mite, Oligonychus pratensis (Banks);
Twospotted spider mite, Tetranychus urticae Koch Cultivar: Golden Harvest H-7143
Planting Date: 17 May 2010 Plant Population: 28,000
Irrigation: Linear move sprinkler Crop History: Continuous corn
Herbicide: Harness 28 oz + Roundup WeatherMax, 23 oz + 1% ammonium sulphate per acre Fertilization: 160 N, 40 P
Soil Type: Clay loam
Table 9. Control of Banks grass mite in field corn with hand-applied miticides, ARDEC, Fort Collins, CO, 2010.
BANKS GRASS MITES PER LEAF ± SEM1
PRODUCT PER ACRE -1 DAT 7 DAT 14 DAT 21 DAT
Onager 1E, 12 fl oz* 4.8 ± 1.2 B 11.5 ± 3.0 DE 25.9 ± 5.6 CD 43.1 ± 7.0 D
Oberon 4SC, 4 fl oz + dimethoate 400 EC, 16 fl oz 12.4 ± 5.9 AB 12.6 ± 6.5 E 23.5 ± 10.5 D 44.9 ± 10.6 D
Oberon 4SC, 4 fl oz + dimethoate 400 EC, 16 fl oz* 2.5 ± 1.2 B 10.8 ± 4.7 E 34.5 ± 14.3 BCD 76.1 ± 34.9 D
Oberon 4SC, 6 fl oz + 32 fl oz COC* 3.5 ± 0.7 B 20.3 ± 4.4 BCDE 31.6 ± 8.9 CD 57.8 ± 12.4 D
Oberon 4SC, 6 fl oz + dimethoate 400 EC, 16 fl oz 18.2 ± 9.5 AB 21.6 ± 6.8 BCDE 24.3 ± 6.8 D 59.3 ± 15.1 D
Hero, 10.3 fl oz + dimethoate 400 EC, 16 fl oz 19.6 ± 11.2 AB 13.4 ± 5.6 DE 31.1 ± 6.4 CD 72.8 ± 21.2 CD
Oberon 4SC, 4.25 fl oz + 32 fl oz COC 6.0 ± 1.1 AB 21.6 ± 6.7 BCDE 42.2 ± 10.4 BCD 72.9 ± 17.9 CD
dimethoate 400, 16 fl oz 9.6 ± 2.6 AB 24.8 ± 7.8 BCDE 52.7 ± 12.1 BCD 69.2 ± 19.8 CD
Onager 1E, 12 fl oz 5.8 ± 0.9 AB 41.5 ± 8.9 ABCDE 62.6 ± 15.9 ABCD 69.5 ± 15.6 CD
Oberon 4SC, 4 fl oz + 32 fl oz COC* 6.3 ± 1.9 AB 22.9 ± 6.0 BCDE 79.3 ± 20.2 ABCD 93.1 ± 18.1 BCD
Comite II 6E (4067-01), 36 fl oz, + dimethoate 400 EC, 10.3 ± 2.6 AB 17.3 ± 4.9 CDE 80.1 ± 12.3 ABCD 146.1 ± 23.3 ABCD
GWN-1708, 20 fl oz* 11.4 ± 3.0 AB 57.9 ± 15.5 ABCDE 48.9 ± 10.3 BCD 128.3 ± 43.7 BCD
Portal 0.4 EC, 24 fl oz + Silwet L-77 0.25% v/v 7.2 ± 1.2 AB 68.1 ± 24.4 ABC 67.4 ± 13.4 ABCD 149.0 ± 47.1 BCD
Portal 0.4 EC, 32 fl oz + Silwet L-77 0.25% v/v 9.6 ± 3.0 AB 51.5 ± 13.8 ABCDE 111.4 ± 18.6 ABCD 114.0 ± 15.2 BCD
GWN-1708, 24 fl oz* 6.3 ± 1.5 AB 29.9 ± 7.5 ABCDE 120.5 ± 76.3 ABCD 169.0 ± 74.9 ABCD
Comite II 6E (4067-02), 48 fl oz 6.8 ± 1.6 AB 67.0 ± 29.2 ABCD 106.0 ± 37.2 ABCD 115.4 ± 19.8 BCD
Comite II 6E (4067-01), 48 fl oz 8.4 ± 1.5 AB 84.7 ± 14.6 A 101.5 ± 23.7 ABCD 224.3 ± 32.3 AB
GWN-1708, 16 fl oz* 13.1 ± 5.1 AB 41.3 ± 9.2 ABCDE 147.1 ± 23.9 AB 211.9 ± 58.1 ABC
Comite II 6E (4067-01), 36 fl oz* 28.3 ± 10.0 A 60.5 ± 16.0 ABCD 134.4 ± 28.8 ABC 333.1 ± 59.7 A
UNTREATED 11.9 ± 0.7 AB 71.0 ± 13.1 AB 221.5 ± 96.3 A 132.9 ± 31.9 BCD
F value 1.98 5.17 4.27 6.50
p>F 0.0163 <0.0001 <0.0001 <0.0001
*Treated early, 13 days prior to the late treatments (0 DAT).
SEM, standard error of the mean. Means in the same column followed by the same letter(s) are not statistically different, Tukey’s HSD (á=0.05).
Table 10. Control of twospotted spider mite in field corn with hand-applied miticides, ARDEC, Fort Collins, CO, 2010.
TWOSPOTTED SPIDER MITES PER LEAF ± SEM1
TREATMENT, PRODUCT PER ACRE -1 DAT 7 DAT 14 DAT 21 DAT
Onager 1E, 12 fl oz* 0.1 ± 0.1 0.2 ± 0.1 A 1.0 ± 0.4 B 3.0 ± 0.9 C
Oberon 4SC, 6 fl oz + 32 fl oz COC* 0.1 ± 0.0 0.7 ± 0.3 A 1.3 ± 0.2 B 4.3 ± 1.0 BC
Oberon 4SC, 4 fl oz + dimethoate 400 EC, 16 fl oz* 0.1 ± 0.1 0.8 ± 0.4 A 2.0 ± 0.3 AB 8.9 ± 3.7 BC
Oberon 4SC, 4.25 fl oz + 32 fl oz COC 0.2 ± 0.1 1.4 ± 0.2 A 2.3 ± 0.6 AB 6.6 ± 2.0 BC
Oberon 4SC, 6 fl oz + dimethoate 400 EC, 16 fl oz 0.6 ± 0.3 2.3 ± 0.9 A 1.9 ± 0.3 AB 6.1 ± 1.0 BC
GWN-1708, 20 fl oz* 0.0 ± 0.0 1.3 ± 0.4 A 2.2 ± 0.8 AB 10.9 ± 3.3 ABC
Oberon 4SC, 4 fl oz + 32 fl oz COC* 0.4 ± 0.2 0.7 ± 0.2 A 2.7 ± 1.0 AB 11.6 ± 2.8 ABC
dimethoate 400, 16 fl oz 0.3 ± 0.2 0.7 ± 0.2 A 2.6 ± 0.5 AB 12.2 ± 4.3 ABC
GWN-1708, 24 fl oz* 0.1 ± 0.0 1.2 ± 0.2 A 3.9 ± 2.1 AB 11.6 ± 4.1 ABC
Portal 0.4 EC, 32 fl oz + Silwet L-77 0.25% v/v 0.1 ± 0.1 2.9 ± 1.0 A 3.4 ± 0.9 AB 9.1 ± 1.9 BC
Oberon 4SC, 4 fl oz + dimethoate 400 EC, 16 fl oz 0.3 ± 0.1 2.4 ± 1.0 A 3.4 ± 1.0 AB 11.2 ± 3.5 ABC
Onager 1E, 12 fl oz 0.4 ± 0.3 1.9 ± 1.1 A 5.5 ± 1.6 AB 6.9 ± 1.2 BC
Portal 0.4 EC, 24 fl oz + Silwet L-77 0.25% v/v 0.2 ± 0.1 3.6 ± 1.5 A 2.7 ± 0.3 AB 12.0 ± 2.5 ABC
Hero, 10.3 fl oz + dimethoate 400 EC, 16 fl oz 0.5 ± 0.3 2.3 ± 1.8 A 3.8 ± 1.9 AB 13.6 ± 4.2 ABC
Comite II 6E (4067-02), 48 fl oz 0.3 ± 0.1 4.0 ± 1.7 A 3.8 ± 1.2 AB 9.9 ± 3.1 ABC
GWN-1708, 16 fl oz* 0.3 ± 0.2 2.3 ± 0.6 A 4.9 ± 1.2 AB 12.9 ± 2.5 ABC
Comite II 6E (4067-01), 36 fl oz, + dimethoate 400 EC, 16 fl oz 0.3 ± 0.1 3.4 ± 1.6 A 3.8 ± 0.8 AB 15.1 ± 2.8 AB
Comite II 6E (4067-01), 48 fl oz 0.1 ± 0.1 3.7 ± 1.0 A 4.1 ± 1.6 AB 14.2 ± 2.5 AB
UNTREATED 0.8 ± 0.7 2.1 ± 0.9 A 7.9 ± 3.3 A 11.1 ± 3.5 ABC
Comite II 6E (4067-01), 36 fl oz* 0.5 ± 0.1 1.8 ± 0.4 A 4.9 ± 1.6 AB 23.0 ± 3.4 A
F value 0.90 1.82 1.82 3.54
p>F 0.5827 0.0316 0.0312 <0.0001
*Treated early, 13 days prior to the late treatments (0 DAT).
SEM, standard error of the mean. Means in the same column followed by the same letter(s) are not statistically different, Tukey’s HSD (á=0.05).
Table 11. Control of spider mites in field corn with hand-applied miticides, ARDEC, Fort Collins, CO, 2010.
TOTAL MITES PER LEAF ± SEM1
PRODUCT PER ACRE -1 DAT 7 DAT 14 DAT 21 DAT
Onager 1E, 12 fl oz* 4.9 ± 1.2 B 11.6 ± 3.1 D 26.9 ± 5.8 CD 46.1 ± 7.6 D
Oberon 4SC, 4 fl oz + dimethoate 400 EC, 16 fl oz* 2.6 ± 1.2 B 11.6 ± 5.1 D 36.5 ± 14.7 BCD 85.0 ± 38.6 CD
Oberon 4SC, 4 fl oz + dimethoate 400 EC, 16 fl oz 12.7 ± 6.0 AB 15.1 ± 6.6 CD 26.9 ± 9.9 D 56.1 ± 11.1 D
Oberon 4SC, 6 fl oz + 32 fl oz COC* 3.6 ± 0.7 B 21.0 ± 4.5 BCD 32.9 ± 9.2 CD 62.0 ± 12.6 D
Oberon 4SC, 6 fl oz + dimethoate 400 EC, 16 fl oz 18.7 ± 9.7 AB 23.9 ± 6.4 BCD 26.2 ± 6.6 D 65.5 ± 15.0 D
Hero, 10.3 fl oz + dimethoate 400 EC, 16 fl oz 20.1 ± 11.4 AB 15.7 ± 5.9 CD 34.8 ± 6.3 BCD 86.4 ± 23.6 CD
Oberon 4SC, 4.25 fl oz + 32 fl oz COC 6.2 ± 1.2 AB 23.1 ± 6.8 BCD 44.5 ± 10.7 BCD 79.6 ± 18.0 CD
dimethoate 400, 16 fl oz 9.9 ± 2.7 AB 25.4 ± 7.9 BCD 55.3 ± 12.1 BCD 81.3 ± 20.1 CD
Oberon 4SC, 4 fl oz + 32 fl oz COC* 6.7 ± 2.0 AB 23.5 ± 6.0 BCD 82.0 ± 20.8 ABCD 104.7 ± 20.4 BCD
Comite II 6E (4067-01), 36 fl oz, + dimethoate 400 EC, 16 fl oz 10.6 ± 2.6 AB 20.7 ± 6.4 BCD 83.9 ± 12.5 ABCD 161.3 ± 24.6 ABCD
Onager 1E, 12 fl oz 6.1 ± 1.2 AB 43.4 ± 9.6 ABCD 68.1 ± 16.9 ABCD 76.4 ± 16.5 CD
GWN-1708, 20 fl oz* 11.4 ± 3.0 AB 59.2 ± 15.8 ABCD 51.0 ± 10.5 BCD 139.3 ± 46.5 BCD
Portal 0.4 EC, 24 fl oz + Silwet L-77 0.25% v/v 7.4 ± 1.2 AB 71.7 ± 25.2 AB 70.0 ± 13.5 ABCD 161.0 ± 47.6 BCD
GWN-1708, 24 fl oz* 6.3 ± 1.5 AB 31.0 ± 7.5 ABCD 124.4 ± 78.3 ABCD 180.6 ± 78.8 BCD
Portal 0.4 EC, 32 fl oz + Silwet L-77 0.25% v/v 9.7 ± 3.0 AB 54.4 ± 13.7 ABCD 114.8 ± 19.2 ABCD 123.1 ± 17.0 BCD
Comite II 6E (4067-02), 48 fl oz 7.1 ± 1.6 AB 71.0 ± 30.1 ABC 109.8 ± 37.9 ABCD 125.3 ± 19.9 BCD
Comite II 6E (4067-01), 48 fl oz 8.5 ± 1.5 AB 88.4 ± 15.2 A 105.5 ± 24.7 ABCD 238.4 ± 33.6 AB
GWN-1708, 16 fl oz* 13.3 ± 5.3 AB 43.6 ± 9.2 ABCD 152.0 ± 24.2 AB 224.8 ± 57.7 ABC
Comite II 6E (4067-01), 36 fl oz* 28.8 ± 10.1 A 62.3 ± 16.1 ABC 139.3 ± 29.9 ABC 356.1 ± 60.3 A
UNTREATED 12.8 ± 0.9 AB 73.1 ± 13.7 AB 229.4 ± 99.6 A 144.0 ± 32.0 BCD
F value 2.00 5.15 4.18 6.37
P>F 0.0153 <0.0001 <0.0001 <0.0001
*Treated early, 13 days days prior to the late treatments (0 DAT).
SEM, standard error of the mean. Means in the same column followed by the same letter(s) are not statistically different, Tukey’s HSD (á=0.05).
Table 12. Reduction in total spider mite days in field corn with hand-applied miticides, ARDEC, Fort Collins, CO, 2010.
PRODUCT, AMOUNT PER ACRE TOTAL MITE DAYS ± SEM1 % REDUCTION IN TOTAL MITE DAYS
Onager 1E, 12 fl oz* 436.3 ± 86.0 B 86
Oberon 4SC, 4 fl oz + dimethoate 400 EC, 16 fl oz* 520.0 ± 211.7 B 84
Oberon 4SC, 4 fl oz + dimethoate 400 EC, 16 fl oz 520.6 ± 155.6 B 84
Oberon 4SC, 6 fl oz + 32 fl oz COC* 583.3 ± 121.6 B 83
Oberon 4SC, 6 fl oz + dimethoate 400 EC, 16 fl oz 640.8 ± 176.8 B 80
Hero, 10.3 fl oz + dimethoate 400 EC, 16 fl oz 655.9 ± 113.5 B 80
Oberon 4SC, 4.25 fl oz + 32 fl oz COC 743.8 ± 162.0 B 77
dimethoate 400, 16 fl oz 905.6 ± 213.6 B 72
Oberon 4SC, 4 fl oz + 32 fl oz COC* 1145.1 ± 282.5 B 64
Comite II 6E (4067-01), 36 fl oz, + dimethoate 400 EC, 16 fl oz 1162.5 ± 170.3 B 64
Onager 1E, 12 fl oz 1195.6 ± 232.3 B 63
GWN-1708, 20 fl oz* 1207.2 ± 208.4 B 63
Portal 0.4 EC, 24 fl oz + Silwet L-77 0.25% v/v 1506.0 ± 284.9 AB 53
GWN-1708, 24 fl oz* 1663.2 ± 805.7 AB 48
Portal 0.4 EC, 32 fl oz + Silwet L-77 0.25% v/v 1817.7 ± 217.2 AB 44
Comite II 6E (4067-02), 48 fl oz 1915.3 ± 649.9 AB 41 Comite II 6E (4067-01), 48 fl oz 2053.1 ± 311.0 AB 36 GWN-1708, 16 fl oz* 2124.5 ± 276.4 AB 34 Comite II 6E (4067-01), 36 fl oz* 2275.9 ± 477.2 AB 30 UNTREATED 3229.5 ± 1112.4 A — F value 3.72 — p>F <0.0001 —
*Treated early, 13 days days prior to the late treatments (0 DAT).
SEM, standard error of the mean. Means in the same column followed by the same letter(s) are not statistically different, Tukey’s HSD (á=0.05).
2010 PEST SURVEY RESULTS Table 13. 2008 pheromone trap catches at ARDEC.
Species Total Caught2 First Catch - Last Catch
Army cutworm 40 (21) 9/3 - 10/22
Banded sunflower moth 45 (73) 6/2 - 8/27
European corn borer (IA)1 15 (19) 6/11 - 9/10
Fall armyworm 860 (359) 6/11 - 10/22
Pale western cutworm 181 (99) 8/20 - 10/22
Sunflower moth 29 (15) 6/11 - 8/6
Western bean cutworm 20 (10) 6/2 - 8/13
IA, Iowa strain
1
Number in () is 2009 total catch for comparison
2
Table 14. Wheathead armyworm pheromone trap catches, 2010.
Date ARDEC Briggsdale Date Lamar Date Merino
4/9 0 0 4/13 0 4/21 2 4/16 0 0 4/20 0 4/26 0 4/26 0 0 4/29 0 4/29 0 5/10 0 0 5/3 25 5/7 3 5/14 0 0 5/10 6 5/12 0 5/24 0 1 5/17 6 5/17 1 5/27 0 4 5/24 8 5/27 15 6/4 0 6 5/31 5 6/4 10 6/11 2 2 6/7 3 6/14 0 6/18 2 0 6/14 24 6/25 3 6/25 3 1 6/21 3 6/30 2 7/2 1 3 6/28 0 7/7 8 7/9 1 1 - - 7/14 3 7/16 0 1 7/12 20 7/21 11 7/23 0 0 7/19 3 7/29 5 7/30 3 13 7/26 2 8/4 2 8/6 1 7 8/2 0 8/11 0 8/13 1 . 8/9 4 8/17 1 8/20 0 . 8/16 0 8/27 12 8/27 2 . 8/23 0 9/3 3 9/3 1 . 8/31 0 9/9 1 9/10 2 . 9/6 1 9/14 2 9/17 3 . 9/13 1 9/24 0 9/24 0 . 9/20 0 10/1 0
INSECTICIDE PERFORMANCE SUMMARIES
Insecticide performance in a single experiment can be quite misleading. To aid in the interpretation of the tests included in this report, long term performance summaries are presented below for insecticides that are registered for use in Colorado and that have been tested at least three times. These summaries are complete through 2010.
Table 15. Performance of planting-time insecticides against western corn rootworm, 1987-2010, in northern
Colorado
INSECTICIDE IOWA 1-6 ROOT RATING1
AZTEC 2.1G 2.6 (31)
COUNTER 15G 2.6 (33)
CRUISER, 1.25 mg (AI)/seed 2.5 (8)
FORCE 1.5G (8 OZ) or 3G (4 OZ) 2.6 (30)
FORCE 3G (5 OZ) 2.4 (10) FORTRESS 5G 2.8 (14) LORSBAN 15G 3.0 (28) PONCHO 600, 1.25 mg (AI)/seed 2.4 (8) THIMET 20G 3.4 (15) UNTREATED CONTROL 4.1 (37)
Rated on a scale of 1-6, where 1 is least damaged, and 6 is most heavily damaged. Number in parenthesis is number of times tested for average. Planting time
1
treatments averaged over application methods.
Table 16. Performance of cultivation insecticide treatments against western corn rootworm, 1987-2005, in
northern Colorado.
INSECTICIDE IOWA 1-6 ROOT RATING1
COUNTER 15G 2.8 (21)
FORCE 3G 3.3 (8)
LORSBAN 15G 3.1 (17)
THIMET 20G 2.9 (19)
UNTREATED CONTROL 4.2 (24)
Rated on a scale of 1-6, where 1 is least damaged, and 6 is most heavily damaged. Number in () is number of times tested for average. Planting time
1
Table 17. Insecticide performance against first generation European corn borer, 1982-2002, in northeast Colorado. MATERIAL LB/ACRE METHOD1 % CONTROL2
DIPEL ES 1 QT + OIL I 91 (4)
LORSBAN 15G 1.00 (AI) A 77 (5)
LORSBAN 15G 1.00 (AI) C 80 (6)
LORSBAN 4E 1.0 (AI) I 87 (9)
POUNCE 3.2EC 0.15 (AI) I 88 (11)
POUNCE 1.5G 0.15 (AI) C 87 (4)
POUNCE 1.5G 0.15 (AI) A 73 (7)
THIMET 20G 1.00 (AI) C 77 (4)
THIMET 20G 1.00 (AI) A 73 (3)
WARRIOR 1E 0.03 (AI I 85 (4)
A = Aerial, C = Cultivator, I = Center Pivot Injection. CSU does not recommend the use of aerially-applied liquids for control of first generation European corn
1
borer.
Numbers in () indicate that percent control is the average of that many trials.
2
Table 18. Insecticide performance against western bean cutworm, 1982-2002, in northeast Colorado.
MATERIAL LB (AI)/ACRE METHOD1 % CONTROL2
CAPTURE 2E 0.08 A 98 (5) CAPTURE 2E 0.08 I 98 (5) LORSBAN 4E 0.75 A 88 (4) LORSBAN 4E 0.75 I 94 (4) POUNCE 3.2EC 0.05 A 97 (7) POUNCE 3.2EC 0.05 I 99 (5) WARRIOR 1E (T) 0.02 I 96 (2)
A = Aerial, I = Center Pivot Injection
1
Numbers in () indicated that percent control is average of that many trials.
Table 19. Insecticide performance against second generation European corn borer, 1982-2002, in northeast
Colorado.
MATERIAL LB (AI)/ACRE METHOD1 % CONTROL2
DIPEL ES 1 QT PRODUCT I 56 (16) CAPTURE 2EC 0.08 A 85 (8) CAPTURE 2EC 0.08 I 86 (14) LORSBAN 4E 1.00 A 41 (6) LORSBAN 4E 1.00 + OIL I 72 (14) POUNCE 3.2EC 0.15 I 74 (11) WARRIOR 1E 0.03 A 81 (4) WARRIOR 1E 0.03 I 78 (4)
A = Aerial, I = Center Pivot Injection
1
Numbers in () indicate how many trials are averaged.
2
Table 20. Performance of hand-applied insecticides against alfalfa weevil larvae, 1984-2010, in northern Colorado. PRODUCT LB (AI)/ACRE % CONTROL AT 2 WK1
BAYTHROID XL 0.022 97 (16) BAYTHROID XL 0.022 (early)3 96 (7) LORSBAN 4E 0.75 93 (23) LORSBAN 4E 1.00 93 (7) LORSBAN 4E 0.50 83 (10) MUSTANG MAX 0.025 93 (6)
MUSTANG MAX 0.025 (early)3 90 (8)
PERMETHRIN 2 0.10 67 (7)
PERMETHRIN 2 0.20 80 (4)
STEWARD 0.065 80 (7)
STEWARD 0.110 84 (6)
WARRIOR 1E, T, or II 0.02 92 (18)
WARRIOR 1E, T, or II 0.02 (early)3 68 (5)
WARRIOR 1E, T, or II 0.03 94 (9)
Number in () indicates number of years included in average.
1
Includes both Ambush 2E and Pounce 3.2EC.
2
Early treatment timed for control of army cutworm
Table 21. Control of Russian wheat aphid with hand-applied insecticides in winter wheat, 1986-2009 .1 PRODUCT LB (AI)/ACRE
TESTS WITH > 90%
CONTROL 21 DAT TOTAL TESTS % TESTS
LORSBAN 4E 0.50 28 46 61 COBALT 13 FL OZ 2 4 50 DIMETHOATE 4E 0.375 8 40 20 MUSTANG MAX 0.025 2 8 25 LORSBAN 4E 0.25 10 28 36 LORSBAN 4E 0.38 5 6 83 WARRIOR 1E 0.03 4 18 22
Includes data from several states.
1
Table 22. Control of spider mites in artificially-infested corn with hand-applied insecticides, ARDEC, 1993-2008. PRODUCT LB (AI)/ACRE % REDUCTION IN TOTAL MITE DAYS1
CAPTURE 2EC 0.08 52 (14)
CAPTURE 2EC + DIMETHOATE 4E 0.08 + 0.50 65 (14)
COMITE II 1.64 15 (15) COMITE II 2.53 46 (8) COMITE II + DIMETHOATE 4E 1.64 + 0.50 54 (11) DIMETHOATE 4E 0.50 42 (14) OBERON 4SC 0.135 57 (4) ONAGER 1E 0.094 86 (4)
Number in () indicates number of tests represented in average. 2009 data not included.
1
Table 23. Control of sunflower stem weevil with planting and cultivation treatments, USDA Central Great Plains
Research Station, 1998-2002.
PRODUCT LB (AI)/ACRE TIMING % CONTROL1
BAYTHROID 2E 0.02 CULTIVATION 57 (3)
BAYTHROID 2E 0.03 CULTIVATION 52 (3)
WARRIOR 1E 0.02 CULTIVATION 63 (3)
WARRIOR 1E 0.03 CULTIVATION 61 (3)
Number in () indicates number of tests represented in average.
ACKNOWLEDGMENTS
2010 COOPERATORS
PROJECT LOCATION COOPERATORS
Alfalfa insecticides ARDEC, Fort Collins Chris Fryrear, Mark Collins
Barley insecticides ARDEC, Fort Collins Chris Fryrear, Mark Collins
Corn rootworm control ARDEC, Fort Collins Chris Fryrear, Mark Collins
Western bean cutworm control
ARDEC, Fort Collins Chris Fryrear, Mark Collins, Larry Appel,
Randy Haarburg
Corn spider mite control ARDEC, Fort Collins Chris Fryrear, Mark Collins,
Brad Walker, Thia Walker
Russian wheat aphid control ARDEC, Fort Collins Chris Fryrear, Mark Collins
Pheromone trap Merino Bruce Bosley
Pheromone traps ARDEC, Fort Collins Chris Fryrear, Mark Collins
Suction trap ARDEC Chris Fryrear, Mark Collins
Suction trap Akron (Central Great Plains
Research Station)
Dave Poss, Merle Vigil
Suction trap Lamar Jeremy Stulp, Thia Walker
PRODUCT INDEX
Actara
Manufacturer: Syngenta
EPA Registration Number: 100-938
Active ingredient(s) (common name): thiamethoxam. . . 6, 7 Agrisure RW
Manufacturer: Syngenta Genetic insertion event MIR604
Active ingredient(s) (common name): mCry3Aa. . . 11 Ambush 2E
AMVAC
EPA Registration Number: 5481-502
Active ingredient(s) (common name): cypermethrin. . . 25 Aztec 2.1G
Manufacturer: Bayer
EPA Registration Number: 264-813
Active ingredient(s) (common name): 2% BAY NAT 7484, 0.1% cyfluthrin. . . 11, 23 Baythroid 2E
Manufacturer: Bayer
EPA Registration Number: 264-745
Active ingredient(s) (common name): cyfluthrin.. . . 26 Baythroid XL
Manufacturer: Bayer
EPA Registration Number: 264-840
Active ingredient(s) (common name): beta-cyfluthrin. . . 2-4, 6, 7, 9, 10, 25 Capture 2EC
Manufacturer: FMC
EPA Registration Number: 279-3069
Active ingredient(s) (common name): bifenthrin. . . 24-26 Cobalt
Manufacturer: Dow Agrosciences EPA Registration Number: 62719-575
Active ingredient(s) (common name): chlorpyrifos + gamma cyhalothrin. . . 3, 6, 7, 9, 10, 26 Cobalt Advanced
Manufacturer: Dow Agrosciences EPA Registration Number: 62719-615
Comite II
Manufacturer: Chemtura
EPA Registration Number: 400-154
Active ingredient(s) (common name): propargite. . . 14, 16-19, 26 Counter 15G
Manufacturer: AMVAC
EPA Registration Number: 5481-545
Active ingredient(s) (common name): terbufos.. . . 11, 23 Cruiser
Manufacturer: Syngenta
EPA Registration Number: 100-941
Active ingredient(s) (common name): thiamethoxam. . . 11, 23 dimethoate
Manufacturer: generic
EPA Registration Number: various
Active ingredient(s) (common name): dimethoate. . . 3, 14, 16-19, 26 Dipel ES
Manufacturer: Valent
EPA Registration Number: 73049-17
Active ingredient(s) (common name): Bacillus thuringiensis. . . 24, 25 Endigo ZC ZC
Manufacturer: Syngenta
EPA Registration Number: 100-1276
Active ingredient(s) (common name): lambda cyhalothrin + thiamethoxam. . . 2, 3, 6, 7 Force 3G
Manufacturer: Syngenta
EPA Registration Number: 100-1025
Active ingredient(s) (common name): tefluthrin. . . 11, 23 Genuity SmartStax
Manufacturer: Dow, Monsanto
Genetic insertion events: MON89034, MON88017, TC1507, DAS59122-7
Active ingredient(s) (common name): Cry1A.105, Cry2Ab, Cry1F, Cry3Bb, Cry34/35Ab1.. . . 11-13 GWN-1708
Manufacturer: Gowan
EPA Registration Number: experimental
Active ingredient(s) (common name): experimental.. . . 14-19 Herculex XTRA
Manufacturer: Dow
Genetic insertion event: TC1507, DAS 59122-7
Hero
Manufacturer: FMC
EPA Registration Number: 279-3315
Active ingredient(s) (common name): bifenthrin + zeta cypermethrin. . . 14, 16-19 Lorsban 15G
Manufacturer: Dow Agrosciences EPA Registration Number: 62719-34
Active ingredient(s) (common name): chlorpyrifos.. . . 11, 23, 24 Lorsban 4E
Manufacturer: Dow Agrosciences EPA Registration Number: 62719-220
Active ingredient(s) (common name): chlorpyrifos.. . . 24-26 Lorsban Advanced
Manufacturer: Dow Agrosciences EPA Registration Number: 62719-591
Active ingredient(s) (common name): chlorpyrifos.. . . 3, 4, 6, 7, 9, 10 Mustang Max
Manufacturer: FMC
EPA Registration Number: 279-3249
Active ingredient(s) (common name): zeta cypermethrin. . . 2, 3, 9, 10, 25, 26 Oberon 4SC
Manufacturer: Bayer
EPA Registration Number: 264-719
Active ingredient(s) (common name): spiromesifen. . . 14, 16-19, 26 Onager 1E
Manufacturer: Gowan
EPA Registration Number: 10163-277
Active ingredient(s) (common name): hexythiazox.. . . 14, 16-19, 26 Poncho 600
Manufacturer: Bayer
EPA Registration Number: 264-789-7501
Active ingredient(s) (common name) : clothianidin. . . 23 Pounce 1.5G
Manufacturer: FMC
EPA Registration Number: 279-3059
Active ingredient(s) (common name) : permethrin.. . . 24 Pounce 3.2EC
Manufacturer: FMC
EPA Registration Number: 279-3014
Steward
Manufacturer: du Pont
EPA Registration Number: 352-598
Active ingredient(s) (common name): indoxacarb. . . 9, 10, 25 Thimet 20G
Manufacturer: Amvac and Micro-Flo
EPA Registration Number: 5481-530 and 241-257-51036
Active ingredient(s) (common name): phorate. . . 23, 24 Warrior II
Manufacturer: Syngenta
EPA Registration Number: 100-1295
Active ingredient(s) (common name): lambda-cyhalothrin. . . 3, 4, 6-10, 24-26 XDE208
Manufacturer: Dow
EPA Registration Number: experimental
Active ingredient(s) (common name): sulfoxaflor . . . 3 YieldGard VT Triple
Manufacturer: Monsanto
Genetic insertion event MON810, MON88017