HVDC Feeder Solution for Electric Railways
L. Abrahamsson, T. Kjellqvist, S. ¨
Ostlund
Abstract—For AC railway power supply systems with a dif-ferent frequency than the public grid, high-voltage AC (HVAC) transmission lines are common, connected to the catenary by transformers. This paper suggests an alternative design based on an HVDC (High Voltage DC) feeder, which is connected to the catenary by converters. Such an HVDC line would also be appropriate for DC-fed railways and AC-fed railways working at public-grid frequency.
The converter stations between the public grid and the HVDC feeder can be sparsely distributed, not denser than on 100 km distances, whereas the converters connecting the HVDC feeder to the catenary are distributed denser. Their ratings can be lower than present-day substation transformers or converters, since the power flows can be fully controlled.
Despite a relatively low power rating, the proposed converters can be highly efficient due to the use of medium frequency technology. The proposed feeding system results in lower material usage, lower losses and higher controllability compared to present solutions.
Simulations of the proposed solution show clear advantages regarding transmission losses and voltages compared to conven-tional systems, especially for cases with weak feeding, and when there are substantial amounts of regeneration from the trains.
I. INTRODUCTION
A. General Problem and Paper Background
R
AIL transportation in the World has in recent years risen considerably and due to needs for energy-efficiency and to the climate changes, this increase can be expected to continue. The increase in train services also poses larger demands on energy supply both regarding installed power and power and voltage quality. In general, the power demand is critical in areas of heavy traffic, such as in metropolitan areas, while maintaining the voltage is the main problem on the rural parts of the main lines as well as on some industrial freight lines. Problems with voltage drops occur in most DC-fed railway power supply systems and in most AC-DC-fed railway power supply systems where the traffic is not dense enough to justify very strong catenary feeders or a very dense placement of converters/substations. There is also a strong focus on energy efficiency.This paper presents and suggests a new way of feeding railway power supply systems that would improve primarily voltage quality and reduce total power losses. The numerical example in Section V is adapted to Swedish conditions, but the idea in itself is applicable to any kind of railway power supply system – therefore the comparisons throughout the paper with the three main types of electric feeding for railways; DC-feeding, low-frequency AC DC-feeding, and public grid frequency AC-feeding.
In this paper a feeder concept comprising a multi-terminal HVDC supply line is investigated. Multi-terminal HVDC will
from here on be denoted MTDC. Using HVDC would lead to less land use for the power lines compared to the AC transmission lines since they can be designed as cables and thus placed alongside the railway line. The land use for HVAC transformer stations and HVDC-to-catenary substations are on the other hand of comparable size, whereas the material usage is less for the suggested HVDC equipment.
B. Present Railway Power Supply System Technologies Prob-lem Background
For thorough descriptions of railway power supply systems and their dimensioning, please c.f. [1], [2].
1) General Railway Power Supply System Problem Back-ground: Railway power supply systems are by practical rea-sons either single phase AC or DC systems. The AC systems are either operated at the same frequency as the public power grid or at a different frequency, normally lower frequency.
DC railway power supplies and AC power supplies with different frequency are similar in topologies, e.g. electric power has to be converted to be able to flow between the public grid and the railway grid.
The denotation Connecting Equipment (CE) is here used as a general name for a component that is either a converter station or a transformer connected to the three-phase public grid. AC railway grids with public frequency typically have transformers instead of converter stations, using two of the public grid’s three phases. To reduce asymmetrical loading, the public-grid phases connected to the railway grid, are altered for each consecutive transformer station. Because of the 120◦ phase angle difference, the public-grid-frequency railway with transformers as CEs is never fed from more than one CE per section.
This paper focuses on loss-reduction. There are various ways of reducing the transmission losses. Classical solutions are:
• Reduce the distance between CEs. This reduces the rail-way power supply system losses by the voltage control at the taps of the CE. Reducing the distance between feeding points is associated with substantial cost and land usage. Besides, classical converter stations and transformer sub-stations can only be placed at locations where there is access to a national grid with sufficient strength. Modern converter stations can be programmed such that the flow of active power is limited to what the public grid tolerates, and such that it uses the rest of its capacity for producing or consuming reactive power in order to keep the voltage levels at desired levels [3]–[7].
• The physical impedance of the catenary system can be de-creased by connecting additional conductors in parallel to
the catenary and track, i.e. increasing the total conducting cross section.
• The transmission voltage can be increased; either by adding a negative feeder to the catenary system or by an additional transmission line.
– The negative feeders are for AC railways normally called either AT (Auto Transformer) or dual-voltage systems [2], [8]–[10] and similar technology also exist for DC railways [11].
– The additional transmission line solution may vary in voltage from country to country (these are often referred to as centralized systems), but it is not uncommon to have 132 kV which is the standard in Sweden. The 132 kV feeder line has proven cost efficient in some parts of Sweden. It is however diffi-cult to get permissions for new overhead power lines that require approximately 32 m broad transmission line clearing [12].
2) DC Centralized Railway Power Supply System Remark: Technically, using converter technology, centralized systems would be applicable for any DC railway power supply system. DC railways have normally low voltages, so a transmission line with distributed active converters would be beneficial, shown in [13]. From a modeling point-of-view, a DC feeder line would not differ much from a ”DC-AT”-solution [11].
3) Public Grid Frequency Railway Power Supply System Problem Specifics: For public-frequency railway power supply systems, there is normally no such thing as a centralized feeding. This is because it is rare that converter stations are being used for feeding them [6]. Without converters, the loads are asymmetrical on the three-phase-grid.
Today, AC railways with public frequency are normally fed from just one substation per section of catenary. Using a trans-mission line with distributed active converters would allow double fed catenaries reducing voltage drops and reducing the required capacities of each individual substation [6].
4) Low Frequency Railway Power Supply System Problem Specifics: The current solution for the Swedish railway power supply system is illustrated in Figure 1 showing both the decentralized and centralized solution. Similar but not equal topologies are valid in other 15 kV, 1623 Hz railway power supply systems. In the decentralized solution, the national grid and the catenary are interconnected by means of converter stations located with a distance of approximately 100 km. The converter stations were originally rotating converters, but have been gradually replaced by static converters. In the centralized system, the overhead contact line is interconnected to a 130 kV transmission line. The overhead contact line is fed by step-down transformers approximately 30–50 km apart. The converter stations might then be located as far as 200 km from each other.
Typical loss figures, estimated by experience and sim-ulations, for a 4 MW load in the Swedish system from public grid into the train are 5.2 % for the transmission of power, 1.1 % transformer losses (in converter station), 1.3 % inverter losses (in converter station), 0.4 % rectifier losses (in converter station), 1.2 % on-board line converter module losses (on train), and 3.1 % on-board transformer losses (on
train). Naturally, these figures varies depending on train type, and track topography. Thus, there is a great energy-saving potential in reducing transmission losses and conversion losses in the railway power supply system. This paper focus on the transmission losses, but also the power conversion is more efficient using the suggested converter technology. Loss figures are typically bigger for low-voltage DC systems; and slightly smaller for transformation/conversion, but roughly the same in catenary system, for public-frequency systems.
II. THESUGGESTEDHVDC FEEDERSOLUTION
A. General Presentation
The power transmission capability is improved by introduc-ing a DC based supply line [14]. The concept is illustrated in Figure 2. Instead of connecting the rectifier and inverter back-to-back as in a conventional static converter station, rectifiers and inverters are interconnected through a distributed DC-bus – the HVDC feeder line. Typically, rectifiers are placed at a fairly large distance, possibly replacing some existing CE. The inverters are placed with a shorter distance depending on the expected load on the line. Determining the optimum rating and distance is outside the scope of this paper but the distance will likely be in the range from 10 km, which is similar to the distance in Sweden between the transformers in an AT (Auto Transformer) system, to 50 km, which is similar to the distance between substations in the Swedish 132 kV-system. Models for determining the optimal location of railway power supply system feeders, applied on classical converter stations are presented in [15].
In uncontrolled systems, the rating of the CE must always be kept high to take care of high loads. As a consequence, the installed power and, hence, the internal no-load losses of the transformer would increase for reduced feeding-point distances. If a conversion stage is added, so that the power flow can be controlled, it is possible to reduce the distance between feeding points without increasing the installed power. B. Suggested Feeder Lines
1) General: The feeder line may be implemented as a ground cable. The cable could be a ±60 kV dipole with 240 mm2 aluminium conductors which yields a power han-dling capability of approximately 50 MW. Such a cable have the impedance
Zline= 0.1175 Ω/km (1)
which is also used in the models presented in Section IV. 2) Sweden-specific: There are today in Sweden 9683 km of electrified railway lines [16] and a total installed power of 1.2 GVA [17]. Thus, the average installed power is ap-proximately 130 kVA/km. It is reasonable to assume that the installed power must be increased in the future to avoid power shortage due to increased traffic. Today’s system contains a significant amount of rotary converter units which can be heavily overloaded for extended periods of time. Thus, the installed power will have to be increased as the rotating converters are replaced with static converters. It is reasonable to assume that the installed power in the future will increase
Public grid 50 Hz 25 MVA 90 tonnes 25 MVA 90 tonnes 16 MVA 70 tonnes 100 km 50 km 132 kV 1623 Hz 15 kV 1623 Hz
Figure 1: Current Swedish railway power supply system solution. Both the decentralized and the centralized solutions are visualized. Public grid 50 Hz +60 kV DC - 60 kV DC 2–5 MVA 4–5 tonnes 10–25 km 15 kV 1623 Hz
to 200 kVA/km or more – a traffic density increase of about 54 %. Thus, the rating of the converter at the feeding point will be in the range of 2 MVA to 10 MVA which is in the same range as the line-side conversion stages in locomotives. Reducing the weight and increasing the efficiency of the line-side conversion stage in locomotives and electrical multiple units have been studied extensively in the past [18]–[23], and the similar converter requirements, such as power rating and AC voltage level, makes these converter types interesting candidates for the HVDC-feeder.
C. Suggested Intermediate Frequency Transformer
The efficiency of a transformer is strongly coupled to its ratings. It is a well established rule in transformer design that the relative losses of a transformer is equal to its apparent power to the power of −14. Thus, a substation transformer is in-herently more efficient compared to the step-down transformer in a locomotive or Electric Multiple Unit (EMU). Therefore, increasing the number of transformers in the system inherently leads to higher losses if all other conditions, such as current loading, magnetic flux etc, are kept the same.
A way of maintaining high efficiency when decreasing the rating of the transformer is to increase its frequency. The per unit weight of the transformer, if all other operating conditions are the same, varies with frequency to the power of −34. Per unit losses will vary with the same exponent as long as the losses are dominated by ohmic losses. The flux density has to be reduced when the frequency exceeds above a certain threshold. For a 5 MVA converter, a 400 Hz transformer is a good choice.
The specific core losses will increase with increased trans-former frequency, causing additional no-load losses. This increase can partly be counteracted by using higher grade mag-netic materials such as high silicon steel or nano-crystalline materials. However, reducing the transformer rating, and thereby its weight, is the most effective way of decreasing no-load losses.
D. Suggested Converter Realization Design
A possible realization of the HVDC converter consists of several converter cells that are series connected both on the AC and DC side. Each cell comprise a VSC (Voltage Source Con-verter) connected to a cycloconverter via a medium frequency transformer. Cascading a high number of converter cells has several attractive advantages. A high number of cascaded cells allows synthesis of a high number of voltage levels at the AC terminals which allows smaller line filter, reduced volt-age stress on magnetic components and less electromagnetic emissions. Series connection of components can be completely avoided with a sufficiently high number of converter cells. However, the cascaded approach inevitably results in high component count and complex insulation systems. Increasing the number of converter cells leads to increased transformer losses. Doubling the number of cascaded cells increase the transformer losses by 68 % according to the scaling rules mentioned previously. A good compromise is to use two cascaded cells. Good harmonic and EMI (Electro-Magnetic
Table I: Summary of component weights for a 3 MVA system
Component Weight DC-link 200 kg 33 Hz filter 1500 kg VSC 25-50 kg MF Transformers (400 Hz) 1500 kg Cycloconverter 50-100 kg Line filter (15%) 900 kg Circuit breaker 110 kg Container 1030 kg Total ca 5-6 tonnes
Interference) properties are achieved due to 5-level switching while keeping the structure of the converter relatively simple and keeping the transformer losses at an acceptable level. The approach requires series connection of silicon devices both in the cycloconverter and the VSC. Soft switching of all semiconductor devices is a good condition for commutation of several devices in series without excessive losses [24]. E. Physical Properties of Suggested Solution
The estimated weights for a 3 MVA system are shown in Table I. The investigated system is anticipated to fit in a standard 8 ft. container and weigh about 6 tonnes. This should be compared to the conventional step-down transformer used in the centralized 132 kV system. Such a transformer is normally rated around 16 MVA and weigh 70 tonnes.
III. COMPARATIVECASESTUDIES
To both show the feasibility and to analyze the potential of the suggested high voltage DC fed railway power supply system technology, a comparison has been made between ex-isting railway power supply system solutions and the proposed one. Since the loads vary in distribution, sign, and size; and the strength of the railway power supply system also varies, four different test cases, c.f. Sections III-0a–III-0d, have been simulated and compared, c.f. Sections V-1–V-4, for proposed and present solutions. The test cases were chosen to illustrate the properties of the system rather than to give accurate predictions of real traffic.
The numerical examples are inspired by the 15 kV 1623 Hz railway power supply system network of Sweden; when present converters and transformer substations are replaced with high voltage DC feeding and controlling it optimally rather than following the classical control schemes. For details of how the Swedish railway power supply system is constituted and can be simulated, please refer to [8], [25]–[27].
For given loads, signs, and locations, the converters can be controlled in such a way that the minimum total losses are determined. This is done by formulating and solving a numerical optimization problem. The solution will only be valid in the specific time instance studied, since power consumption and location of the trains/loads will vary over time.
In real-life however, it is not possible to exactly know all momentary load levels, load positions and levels of power conversion in the system. Therefore, a truly optimal solution is
not achievable in a future application. The benefit of determin-ing the optimal solution is however that is sets a theoretical upper limit on how small the losses possibly can be with a smart control strategy. That is, the minimum losses shows the potential of the technology – but not how to implement the solution.
a) Case A: single motoring train and 100 km between CEs: This case was chosen to be representative for a decen-tralized system layout where the CEs are directly connected to the public grid. The train is located in the middle between two CEs representing the worst case in terms of losses and voltage quality. The power consumed by the train is 8 MW at unity power factor. See Figure 3.
b) Case B: single motoring train and 25 km between CEs. When using classic converter control, the illustrated converters should be regarded as 132 kV to 15 kV transformers.: This case was chosen in order to be able to compare two kinds of centralized railway power supply system solutions. The classical one with passive transformers between the transmis-sion line and the contact line, and the proposed one where both converters and transformers are replaced by HVDC con-verter stations. The conditions are otherwise equal to Case A, c.f. Figure 4.
c) Case C: one motoring train and one braking train and 100 km between feeding points: This case illustrates power flow during regenerative braking on a typical line with CEs located 100 km from each other. Normally, feedback to the national grid is not appreciated by public grid owners. Therefore, in the HVDC-feeder case the impact is studied when it is not allowed to feed back to the public grid from the HVDC grid.
Many grid owners consider regenerative braking to be an energy source which is unpredictable in time and size, heavily fluctuating, and a noisy distortion.
The distance between the trains is 67 km and the distance to the closest converter station is 17 km, for both of the trains. The active and reactive power consumptions of the two locomotives are the same and equal to Case A and Case B, with the exception that one of them regenerates, and the other one consumes, see Figure 5.
d) Case D: One motoring train and one braking train and 25 km between feeding points: The distance between the feeding points is the same as in Case C. Otherwise, conditions are the same as in Case B, c.f. Figure 6.
IV. MODELLING
A. Converter station
1) Proposed Converters: The converter used for the simu-lations is assumed to be of the type described in Section II. In this paper, converter losses for inverter mode are modeled as a second order polynomial according to
PLc= 0.0135I2+ 0.0097I + 0.015 (2) where I is the per-unit current on the AC-side of the converter, and PLc is the per-unit power [28], [29]. The quadratic term represents the resistive losses of the converter, whereas the linear term represents constant voltage drops, and the constant
term corresponds to idling losses. The polynomial is derived assuming inverter operation at unity power factor, which is when the losses are the highest. This model is used for inverter mode of the converter, regardless of cos φ. Operating the converter as a rectifier will yield slightly lower losses, in this paper modeled as 0.9 times the inverter losses, also here regardless of cos φ. The per-unit losses are assumed to be independent of the converter ratings – this means that no economies of scale are assumed for the converters. The converter losses are discussed in more detail in [23]. The exact numbers of loss functions like equation (2) are naturally design-dependent, but the particular numbers in equation (2) corresponds to the converter described in [23].
All harmonics, that can be substantial depending on the type of vehicles on the line, are neglected.
2) Classic Converters: If static converters are used, the terminal voltage and phase shift can be controlled freely. However, for easy replacement and inter-operability, the static converter is generally made to mimic the behavior of a rotating converter. The characteristics of rotary and rotary-mimicking converters are given in e.g. [30], [31]. The voltage is controlled so that it is constant or slightly decreasing with increasing reactive load.
In this paper, a lossless model of the converters is used. 3) Generally: For Cases A and C, the number of converters per station is 2 whereas for Cases B and D where the number of converter stations are doubled, only one converter per station is present. This means that in all of the studied cases, there are four converters present with installed apparent power of 5 MVA each. Only their distribution is varied.
B. Catenary
The catenary assumed in this work is a typical arrange-ment in Sweden with a cross section of the contact wire of 120 mm2and two aluminum return conductors, each with 212 mm2 cross section area, parallel connected to the track. The impedance of such an arrangement is [32]:
Zline= 0.20 + j0.20 Ω/km (3)
This arrangement is relatively weak and an extra feeder line is often connected in parallel to the contact line to decrease the impedance of the line.
C. Load
In this work, the vehicles are assumed to be equipped with modern self-commutated converters capable to operate at unity power factor at the contact line and negligible harmonic currents. This is not representative for the current situation in Sweden where most locomotives used for freight are equipped with thyristor rectifiers and DC-motors. These thyristor based locomotives will remain in traffic for the foreseeable time.
It is anticipated that the HVDC feeder will have a positive influence on the performance of such locomotives as the converter station may act as a PFC (power factor controller) and effectively short circuit the reactive current close to the locomotive, reducing losses and improving voltage quality. In this case it should be noted, that the PFC would only affect
100 km OPF: node 7 OPF: node 5 OPF: PD;5d = 1.034 OPF: Pa G;3= 0.989 OPF: QaG;3= 0.182 CCC: PG;1a = 0.986 CCC: Qa G;1= 0.186 OPF: node 3 OPF: Pd D;6= 1.025 OPF: PG;4a = 0.980 OPF: QaG;4= 0.188 CCC: Pa G,3= 0.986 CCC: Qa G,3= 0.186 OPF: node 4 OPF: node 8 OPF: node 6 ALL: PD;9/2a = 1.600 OPF: U9a= 0.878 CCC: U2a= 0.875
OPF: node 9; CCC: node 2
OPF: U1a= 1.100,U3a= 1.100 CCC: U1a= 1.097
OPF: node 1; CCC: node 1
OPF: U2a= 1.100,U4a= 1.100 CCC: U3a= 1.097
OPF: node 2 CCC: node 3
Figure 3: Case A: Single motoring train and 100 km between feeding points. OPF stands for Optimal Power Flow, whereas CCC stands for Classical Converter Control.
25 km OPF: node 13 CCC: node 2 OPF: node 9 OPF: PD;9d = 0.000 OPF: PG;5a = 0.000 OPF: Qa G;5= 0.000 CCC: PG,1a = 0.835 CCC: QaG,1= 0.048 OPF: node 4 CCC: node 9 OPF: node 5 OPF: node 6 OPF: node 1 CCC: node 1 OPF: node 14 CCC: node 4 OPF: node 10 OPF: PD;10d = 0.866 OPF: PG;6a = 0.836 OPF: Qa G;6= 0.029 CCC: P3,4a = −0.709 CCC: Qa3,4= −0.107 OPF: node 7 OPF: node 3 CCC: node 7 OPF: node 15 CCC: node 6 OPF: node 11 OPF: PD;11d = 0.858 OPF: PG;7a = 0.828 OPF: QaG;7= 0.036 CCC: P7,6a = −0.709 CCC: Qa7,6= −0.107 OPF: node 16 CCC: node 8 OPF: node 12 OPF: node 8 OPF: PD;12d = 0.000 OPF: PG;8a = 0.000 OPF: Qa G;8= 0.000 CCC: PG,9a = 0.835 CCC: QaG,9= 0.048 ALL: PD;17/5a = 1.600 OPF: Ua 17= 1.057 CCC: Ua 5 = 1.051 OPF: Ua 1 = 1.100,U5a= 1.100 CCC: Ua 1 = 1.099 OPF: U2a= 1.100,U6a= 1.100 CCC: U3a= 1.094 OPF: node 2 CCC: node 3 OPF: node 17 CCC: node 5 OPF: Ua 4= 1.100,U8a= 1.100 CCC: Ua 9= 1.099 OPF: U3a= 1.100,U7a= 1.100 CCC: U7a= 1.094
Figure 4: Case B: Single motoring train and 25 km between feeding points. When using classic converter control, the illustrated converters should be regarded as 132 kV to 15 kV transformers.
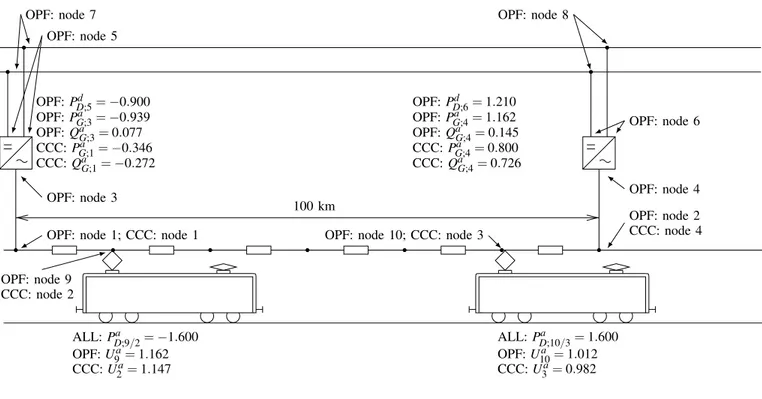
100 km OPF: node 7 OPF: node 5 OPF: PD;5d = −0.900 OPF: PG;3a = −0.939 OPF: QaG;3= 0.077 CCC: PG;1a = −0.346 CCC: QaG;1= −0.272 OPF: node 3 OPF: PD;6d = 1.210 OPF: PG;4a = 1.162 OPF: QaG;4= 0.145 CCC: PG;4a = 0.800 CCC: QaG;4= 0.726 OPF: node 4 OPF: node 8 OPF: node 6 ALL: PD;9/2a = −1.600 OPF: U9a= 1.162 CCC: U2a= 1.147 ALL: PD;10/3a = 1.600 OPF: U10a = 1.012 CCC: U3a= 0.982 OPF: node 2 CCC: node 4 OPF: Ua 1 = 1.100,U3a= 1.100 CCC: U1a= 1.105
OPF: node 1; CCC: node 1
OPF: node 9 CCC: node 2
OPF: Ua
2= 1.099,U4a= 1.100
CCC: U4a= 1.088 OPF: node 10; CCC: node 3
Figure 5: Case C: One motoring train and one braking train and 100 km between feeding points.
25 km OPF: node 13 CCC: node 2 OPF: node 9 OPF: Pd D;9= −0.730 OPF: PG;5a = −0.755 OPF: QaG;5= 0.010 CCC: PG;1a = 0.039 CCC: QaG;1= 0.031 OPF: node 5 OPF: PD;10d = −0.600 OPF: PG;6a = −0.622 OPF: Qa G;6= −0.029 CCC: P5,4a = 0.624 CCC: Qa5,4= 0.060 OPF: node 14 CCC: node 4 OPF: node 10 OPF: node 6 OPF: PD;11d = 0.679 OPF: PG;7a = 0.653 OPF: Qa G;7= 0.066 CCC: P7,6a = −0.669 CCC: Qa7,6= −0.116 OPF: node 7 OPF: node 3 CCC: node 7 OPF: node 11 OPF: node 15 CCC: node 6 OPF: PD;12d = 0.879 OPF: PG;8a = 0.848 OPF: QaG;8= 0.076 CCC: Pa G;10= 0.086 CCC: QaG;10= 0.118 OPF: node 8 OPF: node 4 CCC: node 10 OPF: node 12 OPF: node 16 CCC: node 9 ALL: PD;17/3a = −1.600 OPF: U17a = 1.139 CCC: U3a= 1.138 OPF: node 2 CCC: node 5 OPF: node 18 CCC: node 8 OPF: node 17 CCC: node 3 ALL: PD;18/8a = 1.600 OPF: U18a = 1.051 CCC: U8a= 1.054 OPF: Ua 1 = 1.100,U5a= 1.100 CCC: Ua 1= 1.099 OPF: node 1 CCC: node 1 OPF: Ua 4= 1.097,U8a= 1.097 CCC: Ua 10= 1.098 OPF: U2a= 1.100,Ua 6= 1.100 CCC: Ua 5 = 1.100 OPF: Ua 3 = 1.091,U7a= 1.092 CCC: Ua 7 = 1.095
Figure 6: Case D: One motoring train and one braking train and 25 km between feeding points. When using classic converter control, the illustrated converters should be regarded as 132 kV to 15 kV transformers.
Table II: Summary of results with OPF control
Case A Case B Case C Case D
Base voltage 15 kV
Base power 5 MVA
Min. voltage 0.878 1.057 1.012 1.051 Max. voltage 1.100 1.100 1.162 1.139 Conversion losses 0.089 0.060 0.087 0.104 Transmission losses AC 0.369 0.064 0.223 0.123 Transmission losses DC 0.004 0.004 0.006 0.004 Total losses 0.463 0.128 0.316 0.232
the voltage phase shift, but not focus on filtering out any possible distortion. Reduced reactive currents in the system will increase the power factor if everything else remains constant. In this paper only the fundamental frequency power flow has been studied.
D. Grid Topology
The multi-terminal HVDC (MTDC) grid is mainly radial, with converter stations spread along the DC cable. As can be seen in e.g. Figure 4, the radial DC grid is parallel to the contact line, and they are connected to each other by the use of these converters. The DC grid is connected to the public grid in the left-hand-side end of the DC cable, can be imagined to be located outside the upper left part of Figure 4. This is the explanation for the slightly bigger power inflows in the left-hand-side converter stations in Figures 3 and 4. As a consequence, in order to even out the losses between the converters, this is compensated for by a slightly greater reactive power production in the right-hand-sided converter stations.
In the proposed solution, the impedances between catenaries and converters results in extra nodes, whereas in the classical cases, these small impedances are included in the rotary converter modeling.
V. NUMERICALRESULTS
For all calculations, the computation software GAMS [33] have been used. For the cases where systems of equations were about to be solved, a CNS (Constrained Nonlinear Systems) problem class was defined, and the problem was solved using the CONOPT [34] solver algorithm. For the cases when optimization were about to be done – the OPF (Optimal Power Flow) cases with our suggested solution – the problem was modeled as an MINLP problem using the local solver algorithm BONMIN [34]. Global solvers like COUENNE [34] have been tried for test cases when the respective solutions corresponded very well. Due to extensive computation times, global solving can however not be done for all the studied cases. In all the optimization problems, both the voltage magnitude and the phase of the converters were controllable with regard to installed apparent power. Moreover, the converters could be either online or offline, and rectifying or inverting; giving rise to different loss functions. This all was subject to minimization of the total power losses in the system.
Table III: Summary of results with classical railway feeding
Case A Case B Case C Case D
Base voltage 15 kV
Base power 5 MVA
Min. voltage 0.875 1.051 0.982 1.054 Max. voltage 1.097 1.099 1.147 1.138 Transmission losses 0.372 0.071 0.454 0.124
1) Case A: The optimal point of operation is displayed in Figure 3 with results marked OPF, whereas the classical converter solutions are marked CCC (Classical Converter Control) in the same figure. The voltages at the pantograph are for both railway feeding solutions between 13.1 kV and 13.2 kV, which means that the performance of the locomotive will, depending on type, be slightly reduced [35]. However, the voltage quality is acceptable. The total losses are dominated by AC transmission losses as seen in Table II.
The transmission losses are slightly bigger in the classical feeding solution, whereas the the pantograph voltage levels typically are the same, c.f. Table III and Figure 3.
2) Case B: The solutions for both optimum point of operation and classical control is displayed in Figure 4. The voltage at the pantograph is now above 15.7 kV which means that the performance of the locomotive is unaffected [35]. The losses are still dominated by transmission losses but both transmission losses and conversion losses are of the same magnitude. The total losses in the system are slightly higher than one fourth compared to Case A, c.f. Table II.
The transmission losses are slightly bigger in the classical feeding solution, whereas the the pantograph voltage levels typically are the same. c.f. Table III and Figure 4.
3) Case C: The optimum point of operation is displayed in Figure 5 together with the solutions of the classical study. About 60 % of the power is regenerated to the HVDC line and fed back to the motoring train. The remaining regenerated power is transmitted through the contact line. The AC losses are almost halved in the OPF case compared to the classical one, c.f. Tables III and II. In the OPF case, the converter losses are less than half of the transmission losses. Voltage levels are above 15 kV for the OPF study, and not far from it in the classical feeding study.
4) Case D: The optimum point of operation is displayed in Figure 6 as well as the classical feeding solution. The AC transmission losses are almost as big for the OPF as for the classical case, and the conversion losses are substantial, about 85 % of the transmission losses.
The regenerative energy is fed back to the feeder line by the two leftmost converter stations in Figure 6 and fed to the consuming train by the two rightmost con-verter stations in Figure 6. The HVAC line in the classi-cal centralized solution almost does an equally good job. Only a small amount of power flows through the catenary between the two converters/transformers in the middle of Figure 6, i.e. 0.138- j0.084 p.u. with classical feeding, and 0.167- j0.075 p.u. in the OPF case. This is due to the com-bination of a relatively weak contact line and high efficiency converter. The total losses are 70 % compared to Case C for
OPF and 27 % for classical feeding, keeping in mind the conversion losses are unconsidered for classical feeding in this study.
VI. CONCLUSIONS
In this paper the possibilities of introducing a high voltage DC feeder for railway power supplies have been investigated. The OPF solution shows a theoretical lower limit on losses, the simulated results of the existing system shows a practical upper bound on losses of a future railway power supply system. We propose standardized, small, low-weight, compact, converters to be distributed along the catenaries at proper distances.
The proposed system shows significant advantages in terms of lower raw material usage, lower losses and increased voltage quality compared to conventional feeder solutions. The proposed system handles regenerative braking well also over large distances, and is superior to the state of the art solution in terms of land and material usage. The proposed system is inherently redundant. Thus, a station can easily be taken off-line for maintenance etc. The small size and weight of the converter enclosure means that it can be easily installed and replaced. The medium frequency transformer is a key technology to allow light and high efficiency converters with relatively small rating (in the order of megawatts).
Simulations show that there is a significant difference in the power flow between a system with converter control according to Swedish regulations and the optimal solution. The difference is most pronounced in the case with regenera-tive braking and compararegenera-tively long inter-converter distances, where the AC transmission losses are more than twice the losses of the optimal solution. The difference is caused by a significant power flow through the contact line instead of through the HVDC-feeder. These results indicates that with HVDC-supplied railways, the inter-converter distances can be larger without causing unbearable losses.
It is however not necessary with a top level, centrally managed, power control in order to utilize the HVDC-feeder in a close-to-optimal way. A quest for future studies might be to examine control rules based upon traffic in the power system section being controlled, and power system measurements from the adjacent power sections.
If one converter saturates at very dense traffic conditions there will be a neighboring converter that steps in, which has been confirmed in simulations, but not presented here.
REFERENCES
[1] C. J. Goodman, “Overview of electric railway systems and the cal-culation of train performance,” Electric Traction Systems, 2008 IET Proffessional Development course on, pp. 1–24, Nov. 2008.
[2] R. J. Hill, “Electric railway traction, Part 3 Traction power supplies,” Power Engineering Journal, vol. 8, pp. 275–286, Dec. 1994.
[3] U. Behmann and K. Rieckhoff, “Umrichterwerke bei 50 Hz-Bahnen - Vorteile am Beispiel der Chinese Railways/Converter Stations in 50 Hz Traction - Advantages in Case of Chinese Railways.,” Elektrische Bahnen, vol. 109, no. 1–2, pp. 63–74, 2011.
[4] U. Behmann and K. Rieckhoff, “Converter Stations in 50 or 60 Hz Traction Power Supply,” Rail Technology Review, vol. 51, no. 4, pp. 8 – 14, 2011.
[5] T. Sch¨utte and U. Behmann, “Converters in the railway power supply – worldwide chances (original title in german),” Elektrische Bahnen, vol. 109, no. 4–5, pp. 254–257, 2011.
[6] L. Abrahamsson, T. Sch¨utte, and S. ¨Ostlund, “Use of Converters for Feeding of AC Railways for All Frequencies,” Elsevier Energy for Sustainable Development, vol. 16, pp. 368–378, Sept. 2012.
[7] U. Behmann and T. Sch¨utte, “Static converters – the future of traction power supply,” Rail Technology Review, vol. 1, pp. 9–15, 2012. [8] A. B¨ulund, P. Deutschmann, and B. Lindahl, “Circuitry of overhead
contact line network at swedish railway Banverket (original title in German),” Elektrische Bahnen, vol. 102, no. 4, pp. 184–194, 2004. [9] E. Pilo, L. Ruoco, and A. Fern´andez, “A reduced representation of
2x25kV electrical systems for high-speed railways,” in Proceedings of the 2003 IEEE/ASME Joint Rail Conference, pp. 199–205, Apr. 2003. [10] J. D. Glover, A. Kusko, and S. M. Peeran, “Train Voltage Analysis for
AC Railroad Electrification,” IEEE Transactions on Industry Applica-tions, vol. IA-20, pp. 925–934, July/Aug. 1984.
[11] P. Ladoux, F. Alvarez, G. J. Herv Caron, and J.-P. Perret, “A new structure of power 1500V catenary: the system 2 x 1500 V (original title in French),” Revue Genrale des Chemins de Fer, vol. 21, pp. 21– 31, 2006.
[12] L. Taaveniku and A. Lindmark, “Slutrapport – Kraftf¨ors¨orjning, Bot-niabanan 130 kV matarledning,” F¨orstudie BRNB 2003:14, Banver-ket, Mar. 2004. URL: http://www.trafikverket.se/PageFiles/26518/BB kraftforsorjning Slutrapport 20040323.pdf.
[13] R. Vial, D. Riu, and N. Retiere, “Simulating calculations and optimiza-tion design of a new HVDC supply power for light rail system,” in IECON 2010 - 36th Annual Conference on IEEE Industrial Electronics Society, (Glendale, AZ), pp. 2364 – 2369, 2010.
[14] T. Lejonberg, “Plant for feeding alternating voltage,” May 1998. Patent. URL: http://www.wipo.int/patentscope/search/en/WO1998055339. [15] L. Abrahamsson and L. S¨oder, “Railway power supply investment
decisions considering the voltage drops - assuming the future traffic to be known,” in Intelligent System Applications to Power Systems, 2009. ISAP ’09. 15th International Conference on, pp. 1–6, 2009.
[16] Trafikverket, “Bandata.” http://www.trafikverket.se/Privat/ Vagar-och-jarnvagar/Sveriges-jarnvagsnat/Bandata/.
[17] “Kraftf¨ors¨orjningsanl¨aggningar. Elektriska krav p˚a fordon med avseende p˚a kompatibilitet med infrastrukturen och andra fordon,” Standard BVS 543.19300, Banverket.
[18] S. ¨Ostlund, A Primary Switched Converter System for Traction Appli-cations. No. 9201 in Trita-EMK, 1992.
[19] P. C. Kjaer, S. Norrga, and S. ¨Ostlund, “A primary-switched line-side converter using zero-voltage switching,” IEEE Transactions on Industry Applications, vol. 37, no. 6, pp. 1824–1831, 2001.
[20] M. Glinka and R. Marquardt, “A new AC/AC multilevel converter family,” IEEE Transactions on Industrial Electronics, vol. 52, no. 3, pp. 662–669, 2005.
[21] M. Steiner and H. Reinold, “Medium frequency topology in railway applications,” in Power Electronics and Applications, 2007 European Conference on, p. 110, 2007.
[22] N. Hugo, P. Stefanutti, M. Pellerin, and A. Akdag, “Power electronics traction transformer,” in 2007 European Conference on Power Electron-ics and Applications, (Aalborg, Denmark), pp. 1–10, 2007.
[23] T. Kjellqvist, On Design of a Compact Primary Switched Conversion System for Electric Railway Propulsion. PhD thesis, Royal Institute of Technology (KTH), June 2009. TRITA-EE 2009:029.
[24] T. Kjellqvist, S. ¨Ostlund, and S. Norrga, “Active snubber circuit for source commutated converters utilizing the IGBT in the linear region,” Power Electronics, IEEE Transactions on, vol. 23, no. 5, pp. 2595–2601, 2008.
[25] L. Abrahamsson, “Railway Power Supply Models and Methods for Long-term Investment Analysis,” tech. rep., Royal Institute of Technol-ogy (KTH), Stockholm, Sweden, 2008. Licentiate Thesis.
[26] B. Boullanger, “Modeling and simulation of future railways,” Master’s thesis, Royal Institute of Technology (KTH), Mar. 2009.
[27] M. Olofsson, “Power Flow Analysis of the Swedish Railway Electrical System,” tech. rep., Royal Institute of Technology (KTH), Stockholm, Sweden, 1993. Licentiate Thesis.
[28] J. Beertens, S. Cole, and R. Belmans, “Generalized Steady-State VSC MTDC Model for Sequential AC/DC Power Flow Algorithms,” Power Systems, IEEE Transactions on, vol. 27, pp. 821–829, May 2012. [29] J. Beertens, S. Cole, and R. Belmans, “A sequential AC/DC power flow
algorithm for networks containing Multi-terminal VSC HVDC systems,” in Power and Energy Society General Meeting, 2010 IEEE, pp. 1–7, 2010.
[30] M. Olofsson, Optimal Operation of the Swedish Railway Electrical System-An Application of Optimal Power Flow. Stockholm: KTH, February, 1996.
[31] “Kraftf¨ors¨orjningsanl¨aggningar. omriktare f¨or banmatning,” Standard BVS 1543.17000, Banverket.
[32] E. Friman, “Impedanser fr KTL och 132 kV, 30 kV och 15 kV ML,” Tech. Rep. BKE 02/28, July 2006.
[33] GAMS Development Corporation, “Welcome to the GAMS Home Page!,” Apr. 2008.
[34] GAMS, “Solver descriptions,” July 2011.
[35] Norwegian national railway administration (Jernbaneverket), “Simula-tions Report, Railway Electric Power Supply, Ofotsbanen (original title in Norwegian),” tech. rep., Norwegian national railway administration (Jernbaneverket), 2007.