MASTER’S THESIS
Universitetstryckeriet, Luleå
Christina Ackermann
Bending of High Strength Steel
MASTER OF SCIENCE PROGRAMME Engineering Materials
Luleå University of Technology
Department of Applied Physics and Mechanical Engineering Division of Engineering Materials
Bending
Bending
Of
Of
High Strength Steel
High Strength Steel
Student:
Christina Ackermann
Examinator:
Esa Vuorinen
Advisor-University:
Peter Hedström
Advisor-SSAB:
Erling Sundström
Abstract
The aim of this project, which was done in cooperation with the company SSAB Hard and Special Steels, was to find the minimal bending radius for five different steels with two different bending methods. In order to realise that, the project was divided into two different parts, the material characterisation and the forming operations.
The material characterization was composed of different methods, optical and scanning electron microscopy, hardness and tensile test and x-ray diffraction. During the forming part two different methods were used, the corner bending and the press bending, which were performed respectively in the SSAB laboratory in Borlänge and at the company Svetjänst in Arnemark.
During the material characterisation various findings were made, eg the deformation level varied with depth into the materials, a high deformation and a strong texture was found at the surface layer of the material, which decreases by going deeper into the middle of the material. Also cracks in the surface layer of the materials were found. The high deformation with the cracks caused the failure during the bending operations, as the surface layer was also the most loaded during bending and consequently, cracks can open and be easily formed. The direction of the surface texture in cooperation with the crack orientation can also explain the different behaviour of the samples bended in different directions.
The tensile and hardness test delivered uniform results with a small standard deviation, which would indicate consistency, however this result must be taken with caution, because the tests were made only with material from one position in one roll and therefore may not be representative of a full roll or take into account production variations.
A difference in bending behaviour was seen between the different bending directions in both tests, however the magnitude of this difference was very different between the two test methods. This is difficult to explain because the two tests were made in different places and by different people without providing detailed information about the test procedure and without my direct oversight. Therefore it is difficult to directly compare the two tests and thus isolate the method specific factors that influence the results. Some factors that may have a big influence, for example the forming speed, were not controlled in these tests.
For the press bending a study was also made about the springback in the materials, which is dependent on the strength and the residual stresses in the material. In general one can say that the springback increases with the increasing strength in the material. But there were also exceptions, which can be explained via defects in the material, which were found in the base and also in the cold rolled material. Also the material with the highest deformation degree by cold rolling had the highest springback despite of the lowest strength, but there the main influence has to be the residual stresses which are already introduced during rolling.
The conclusions of this project are the as follows:
• The highly deformed surface layer is responsible for defects during the bending sequence
• The texture is the highest in the surface layer, which causes the different results in different bending directions
with larger testing sequences with samples taken from across the roll and from different production lines.
• The different testing sequences make it difficult to compare the bending methods.
→ These conclusions make it difficult to give a general minimal bending radius for these materials because the radius found is specific to a particular material and a particular test. The results for the tests performed here are given in the body of the report.
Table of contents
1 INTRODUCTION...6
2 THEORETICAL BACKGROUND... 7
2.1 Material ...7
2.1.1 Docol Hiloc Thin Line...7
2.1.2 Docol Hiloc EH...8
2.1.3 Docol Hiloc SH... 9 2.2 Hardening mechanisms...10 2.2.1 Grain refining... 10 2.2.2 Work hardening...10 2.3 Forming...11 2.3.1 Cold rolling... 11 2.3.2 Bending... 12 2.3.2.1 V-bending...12 2.3.3 Springback... 16 2.3.4 Press bending...17
2.4 Scope of this project ... 18
3 EXPERIMENTS AND EQUIPMENT...19
3.1 Material characterization... 19 3.1.1 Sample preparation...19 3.1.2 Optical microscopy... 20 3.1.3 SEM...20 3.1.4 Hardness test...20 3.1.5 Tensile test...21 3.1.6 X-ray diffraction...21 3.1.6.1 Texture measurement... 21 3.1.6.2 Deformation measurement... 22 3.2 Forming...23
3.2.1 Corner Bending in Borlänge...23
3.2.2 Press Bending in Arnemark ... 23
4 RESULTS...24
4.1 Material characterization... 24
4.1.1 Optical Microscopy...24
4.1.2 SEM...30
4.1.2.1 Cracks...30
4.1.2.2 Edge middle difference... 31
4.1.3 Hardness test...33 4.1.4 Tensile test ...34 4.1.5 X-ray Diffraction...36 4.1.5.1 Texture measurements...36 4.1.5.2 Deformation Measurement...39 4.2 Forming...40 4.2.1 Air bending...40 4.2.2 Press bending...41 4.2.2.1 Forming radius... 41 4.2.2.2 Springback...43 5 DISCUSSION...45
6 CONCLUSIONS... 48 7 FUTURE WORK... 49 8 REFERENCES... 50
1 Introduction
This project is about the properties of super high and medium strength steels and their changes when they are plastically deformed. The work is done in cooperation with the enterprise SSAB Tunnplåt AB and the subsidary company SSAB Hard and special Steel, where the steel sheets are rolled and heat treated. After these treatments, which introduce the properties into the material desired by the customers, the sheets are delivered to them. The customers do a further forming of the material.
In this project the bending of five different steel types by using three different bending methods is looked at. It is explained which method is the best one and why, which influence have the material characteristics on the bending, and why the orientation to the rolling direction in which the bending is performed, has a big influence on it.
The project is separated into two parts. First is performed a material characterization. The knowledge of the five different steel types are complemented by studying their mechanical and structural properties hardness tests, tensile tests, microscopy and composition analyses are performed.
Then the bending of several pieces of each material with different angles is performed, centred on the theoretical value. It is concentrated on finding the minimum bending angle which can be used before the material cracks, and which of the methods is the best for the different steels.
The decision on which method is the best one, is explained by analysing the influence of different aspects on this, like thickness of the sheet, the structural and mechanical properties and the direction in which the bending is performed.
2 Theoretical Background
2.1 Material
The material used during the project is super high strength steel with different yield strength and different thicknesses. At SSAB Tunnplåt AB the super high strength steels are separated into different types, after their range of strengths, their dimensions and their use. All of these steels are rerolled and have a martensitic or ferritic structure.
Here we will get a view of three of these steel types:
2.1.1 Docol Hiloc Thin Line
This steel type is produced to replace ordinary steels in applications where thicknesses of about 0.50 to 1.00 mm are needed. With the super steel the costs can be reduced up to 25% and the weight up to 50 %.
The yield strength can vary from 500MPa up to 750 MPa. The steel does combine a
moderate formability, good weldability with the conventional methods because of the low contents of carbon, phosphorus sulphur, and a high impact resistance. Another advantage of these steels is the ability to produce thin gauges, and thus reduce the weight of steel used in the components.
The material is used for furniture, white goods, fridges, shelves and storage furniture as well as for
electrical fittings.
Out of this part there will be worked with:
● Docol Hard 450 Y (Hiloc 50) (0.35mm) ● Docol Hard 550 Y (Hiloc 550 TL) (0.35mm)
Table 1: Mechanical properties of Docol Hiloc Thin Line
Table 2: Dimensions of Docol Hiloc Thin Line
Steel grade Thickness Width
[mm] [mm]
Docol Hard 450 Y 0,28-1,00 12 – 1080 Docol Hard 550 Y 0,35-1,00 13 – 1080
Steel grade Yield strength Tensile strength Elongation Hardness
Re [N/mm²] Rm [N/mm²] A80 [%] [HV]
Docol Hard 450 Y 450 600 10 160
In Table 3 below the chemical compositions are given.
2.1.2 Docol Hiloc EH
These are grain refined, hot and then cold rolled steels which can be used where high strength and hardness combined with good weldability (i.e. low content of carbon, sulphur and phosphorus) and acceptable bendability are needed.
These steel types combine very high yield strength, moderate bendability, and good weldability without preheating, a high impact resistance and a good wear resistance. The thicknesses of the sheets can vary from 1.60 up to 4.00 mm
Table 4: Mechanical properties of Docol Hiloc EH
The common applications for this steel are vehicle parts, supporting constructions, lightweight containers, tubes and ladders.
The steels that are used during this project are:
● Docol Hard 850 Y (Hiloc 850 EHV) (4mm) ● Docol Hard 900 Y (Hiloc 900 EHV) (3mm)
Table 3: Chemical composition of Docol Hiloc Thin Line
CHEMICAL COMPOSITION (typical values)
Steel grade C % Si % Mn % P % S % Al % Nb %
Docol Hard 450 Y 0,05 0,01 0,2 0,01 0,01 0,05
-Docol Hard 550 Y 0,05 0,01 0,4 0,01 0,01 0,4 0,01
Table 5: Dimensions of Docol Hiloc EH
Steel grade Thickness Width
[mm] [mm]
Docol Hard 850 Y 1,60-4,00 Max. 1000 Docol Hard 900 Y 1,60-4,00 Max. 1000
Steel grade Yield strength Tensile strength Elongation Hardness Min. bending radius Re [N/mm²] Rm [N/mm²] A80 [%] [HV] 90° bending
900 1000 5 300 3xt
850 950 6 275-300 2-3xt
Docol Hard 900 Y Docol Hard 850 Y
Chemical composition:
Table 6: Chemical composition of Docol Hiloc EH
2.1.3 Docol Hiloc SH
This steel type is applied in domains where a very hard material is needed. It is hardened, tempered and cold rolled before the further forming.
Docol Hiloc SH has a very high strength and hardness in combination with a moderate formability for simple forming operations as bending, roll forming and tube manufacturing, and a good weldability because of a very lean chemical composition. The bendability is better transverse than parallel to the rolling direction. Also it is characterized by a good resistance to fatigue and impact.
Table 7: Mechanical properties of Docol Hiloc SH
Table 8: Dimensions of Docol Hiloc SH
Common applications are components in cars, light weight containers, tools, knives, saws, spades, mixers, truck platforms, safety shoes and boxes.
The material which is used in this project is called:
● Docol Hard 1500 Y 1,92mm
and has the following chemical composition: Table 9: Chemical composition of Docol Hiloc SH
[1]
CHEMICAL COMPOSITION (typical values)
Steel grade C % Si % Mn % P % S % Al % Nb % V % Ti %
0,120 0,100 2,100 0,025 0,010 0,015 0,090 0,200 0,150 0,120 0,100 2,100 0,025 0,010 0,015 0,090 0,200 0,150 Docol Hard 850 Y
Docol Hard 900 Y
Steel grade Yield strenght Tensile strength Elongation Hardness Min. bending radius Re [N/mm²] Rm [N/mm²] A80 [%] [HV] 90° bending
Docol Hard 1500 T 1350 1500 3 450 4xt
Steel grade Thickness Width [mm] [mm] Docol Hard 1500 T 0,48-1,95 50 – 1040
CHEMICAL COMPOSITION (typical values)
Steel grade C % Si % Mn % P % S % Al % B % Ti %
2.2 Hardening mechanisms
Hardening mechanisms are used to introduce a certain strength and hardness to a material, which is not obtainable with ordinary quenching methods. The mechanisms that are introduced to these steels are:
2.2.1 Grain refining
These steels are treated to get smaller grain sizes. This can be performed in different ways. An insoluble powder, such as a ceramic powder, can be added to the steel. These small particles act as nucleation sites for the grains in the steel and thus more grains of smaller size are formed in the steel and thereby increase the hardness as seen by the Hall-Petch relationship.
Another method to produce a small grain size in the steel is to cool it with a high cooling speed. When the cooling is fast there is a higher level of nucleation compared to growth, hence many grains can be formed, which impinge on the growth of each other. Consequently the steel gets a fine-grained structure. [2]
2.2.2 Work hardening
In steel there are many different defects. These defects can be separated into three general groups: zero dimensional defects, like holes and additional atoms, one dimensional defects, like dislocations and two dimensional defects like grain boundaries and twins [3, 13].
When a material is deformed the dislocations begin to move in the material. These
dislocations can be stopped by other defects - grain boundaries, twins and dislocation multiplication by Frank-Read-generaters. When the moving defects are stopped they build pileups which hinder each other and further dislocation motion.
These crowds cause a hardening of the material, as well as increasing the strength and decreasing ductility.. In the worst case cracks are generated in the work piece. Because of this hardening in the material cold forming operations can not be performed without limits, unlike hot forming [3].
2.3 Forming
The focus of this project is the forming of steel sheets of the previously named materials. Sheet forming is a plastic deformation process of the sheets which causes stresses in the material. The ability to be formed depends much of the material properties like the ductility and hardness. Thin sheets are often cold formed which results in a hardening of the sheet because of the high introduced stresses. When these stresses reach a maximal value the material can break during forming.
On these steels several different types of forming were performed, like hot rolling, cold rolling, cutting and bending. The latter are of most importance in this project and are explained further in this section.
2.3.1 Cold rolling
Figure 1: Schematic drawing of the cold rolling process [c]
In certain areas, thicknesses and surface qualities are desired which cannot be reached with the process of hot rolling, in this case the cold rolling has to be used. [4]
Cold rolling is a metallurgical deformation process of metal sheets. The sheets pass a pair of very hard work rolls which apply a high load on the sheet. [5] The process is performed at a
temperature below the recrystallisation temperature of the part, which means that the process influences many of the structural properties and the hardness of the metal. In a roll sequence the deformation achieved is not as big as for hot rolling.
The structure is influenced by compressing and stretching of the grains in the metal during the charge of the rolls. Because this structural change introduces defects and stresses in the material, the material has to be annealed between a certain number of rolling sequences. This annealing is a heating above the recrystallisation temperature, such that the stresses in the material can be
removed.
The rolled metal can be classified by using the degree of compressing during the cold rolling. The larger the thickness decrease, the higher the hardness of the steel, because of the introduced defects, which cause dislocation multiplication explained by the mechanism by Frank-
Read-generators .
At LuCoil a cold rolling method that is called Sendizimir method is used. In this method there is a system of rolls that is installed like two pyramids that are showing with their top to each other.
Figure 2: Schematical drawing of a sendizimir rolling installation [d]
2.3.2 Bending
Bending is a common method for the forming of steel sheets. There are many different types of bending which has to be chosen depending on the form the work piece has to be formed to, and also the number of pieces that have to be formed.
Examples of the different bending methods are:
● V- bending ● U-bending ● air bending ● Rollbending ● rollforming [6]
In the following section the two different processes for V-bending will be discussed. 2.3.2.1 V-bending
V-bending is in general performed with two different tools, one above the sheet which has the form of a V, and one support under the sheet wich may or may not have a defined shape. V-bending can be performed at angles between 0 to 180°, but the most commonly performed is bending of about 90°. The upper tool sinks down and presses the material into the support at the bottom.
The minimum possible radius selected for the edge of the upper tool will depend on the strength of the material to be bent; if the radius is too small for the material, it will break because the forming stress exceeds the ultimate tensile strength.
There are two different methods to perform V-bending:
● Corner bending
Here the sheet is pressed by the upper tool into the v-form until all the material touches the walls of the bottom tool. The bending force has to be big enough to cause a permanent plastic deformation in the material. Then even the springback is minimized.
The springback can even be more minimized when the upper tool has a radius which stands a little bit out of the formed triangle.
This bending type is mostly used on thin sheets, where the maximum thickness is 2mm. [6] Figure 3: schematic drawing of the corner bending [6]
● Air bending
During air bending the sheet is only in full contact with the upper tool and is just supported by the bottom tool. The upper tool presses the material down, but before the material touches the base of the bottom tool, it moves back. This is the reason why this method is called air bending.
For thin sheets from 0 to 3mm, the radius of the formed piece does not depend on the radius of the upper tool, but on the material’s strength, thickness and the gap size in the bottom tool. For thicker steel sheets, the radius of the upper tool has more influence.
The bending angle varies with the length of the beat of the upper tool. Because of the spring-back, this length must be chosen such that the sheet has springback the desired angle after
springback. [6]
In the report VAMP 15 about "Formning av ultrahöghallfasta stål delrapport 10 Kantbockning av Lars-Olof Ingemarsson" [8] a study of the V-bending of two different high strength steels, Docol 1000 and Docol 1400 was performed. These have a similar structure, and a tensile strength which lies between the steels which are studied in this project. The bending is done at two different forming angles, 90° and 120°, and several radii were tested for these steel grades.
For the 90°-bending test, sheets with a thickness of 0.8 mm were used, and for the 120°-bending test, the sheets had a thickness of 1.5 mm. The minimal radii which were found for these steels are the following:
Table 10: Recommended bending radius [8]
Material Minimal recommended
bending radius for SSAB with a bending angle of 90°
[x * t (for all thicknesses)]
Minimal recommended bending radius for SSAB with a bending angle of 60°
[x * t (for all thicknesses)]
Docol 1000 DP 3 * t 1,1 * t
Docol 1400 DP 4 * t No results because of breaking Figure 4: schematic drqwing of the airbending [6]
The 120°-bending of Docol 1400 was not possible without local heat treatment during the bending. [8]
In the same study a comparison between bending and roll forming was done, with the aim of determining the smallest bending radius without destruction of the material. The result was that with smaller radii were reached with roll forming. This is a phenomenon that must be analysed further.
Another finding was that bending 90° to the rolling direction always delivered better/
smaller bending angles than bending parallel to the rolling direction. This depended on the structure of the material after rolling, the texture. This is another phenomena which deserves further study during this work.
2.3.3 Springback
The springback is caused by the stresses which are still in the material after partial plastic deformation. The less the material is plastic deformed the more springback will occur [6].
The springback, itself, can be calculated with the following formula:
where the Ri is the radius before the springback, Rf is the radius after the springback, E is the Youngs modulus, Y the yield strength and T the thickness of the sheet.
The springback increases also as the R/T ratio and the yield strength increases and the Youngs modulus decreases. [7]
This problem has to be taken into account when the angle for the part and for the tool is calculated. The bending has to always be performed with an angle smaller than the desired angle so that the bent material attains the correct angle after springback.
There are mathematical equations to calculate the needed angle to reach the desired form. At SSAB Tin-plate is the following equation used to calculate the required over bending angle Δά [6]:
The springback can be compensated by different methods, like over bending, bottoming the punch wich is done by coining the bent area by applying high compressive stresses between the tip of the punch and the tool surface, or stretch bending where tensile stresses are applied on the bending area while the bending. Also the bending can be performed under an elevated temperature to minimize the springback.
In the paper of Zafer Tekýner springback angles from 1 to 4 ° were found [7].
2.3.4 Press bending
Press bending is also a common bending method which can be performed on a relatively small number of parts. It is performed in bending machines, where the sheet is mounted between the bending table and a vertical movable cover plate. The bending is performed by a tool which can be turned. In the following figure a theoretical press bending process is presented.
Figure 5: schematic drawing of the pressbending [6]
If the upper tool has a big radius the resulting radius of the workpiece corresponds to it. If this radius is small or the tool has a sharp edge the workpiece’s resulting radius depends on nearly the same conditions as for the air bending.
The bending force can be calculated with the following equation:
4 * * * 2 m a R t L M R P =
Where P = the bending force, Ra = the arm of the moment, and M = the bending moment.
One well known difficulty of this method is to find a cover plate which has enough strength to hold the steel sheet and that a big enough section of the sheet is mounted. If this section is too small, there is the risk that the sheet detaches and then the mounting tool can damage the sheet. A method to calculate an adequate distance for the mounting is shown in the following:
t R b= i + 2
Where b = the distance which should be mounted, Ri = the bending radius and t = the thickness of
2.4 Scope of this project
The aim of this work is to compare the bending methods of air and press bending to enable a minimum bending radius to be determined for particular grades of steel and to evaluate which method is best for this. Also, to determine the effect of microstructural parameters on the bending properties of the steels.
3 Experiments and equipment
The project was organized in the following way. First was a general materials characterization study. Second came the experimental formation by bending in two different ways, followed by the analysis of the results to draw connections between the material properties and forming conditions.. In this section individual steps of the different experimental parts will be described.
3.1 Material characterization
For material characterization, the five steels were analysed using the following methods: hardness and tensile testing, optical and scanning electron microscopy and texture measurements.
3.1.1 Sample preparation
The samples were subjected to the following treatment:
First the steel had to be cut. The steel plates were cut with a big metal press in the central university workshop. In this step the steel was cut into bars of about 2 cm width and a length of about 20 cm. After this the bars were cut in pieces of 2cm x 2cm with a metal saw. A sawing wheel for hard metals was used and during sawing both the machine and sample were cooled with a mixture of 23:7 water and anti-corrosion liquid.
When the cutting was finished the samples were mounted in a phenolic powdermatrix. For every steel three samples were mounted, so that it was possible to examine the surface and the cross-section in two different directions.
Mounting was necessary to be able to hold the sample in order to grind and polish them. The grinding was performed using a selection of grinding papers where the number of the paper indicates the number of grinding particles in a defined area. Higher numbers therefore have more but finer particles. The numbers of the papers used were 240, 600, 800 and 1200. Every sample was ground on every paper until the traces of the step before was removed, which meant about a half to two minutes. Between every paper change the sample was washed and turned 90°.
Polishing was performed with diamond particles of sizes 9 and 3 mm, on TEXMET clothes with DP-Blue solution as cooling liquid. During polishing the sample was moved in a circle against the rotation direction of the polishing plate. The samples were washed with water and soap between every polishing step.
For the final polishing step a MASTERTEX cloth was used with a MASTERMET suspension which consisted of silica particles. The cooling liquid was water. After the final step the samples were rinsed with water and methanol and dried.
Every polishing step consisted of about three times fifteen circles with the sample. However the final polishing step was not done for longer than one minute because the MASTERTEX plate can cause damages on the surface of the sample.
When the polishing was finished the samples were etched with 2% Nital for upp to 30 seconds. In order to make grain boundaries more visible the etching was also tested with a marshalls reagent,
which or some steels did not much influence the structure received by Nital etching destroyed the structure of the steels Docol Hard 450Y and 550Y.
3.1.2 Optical microscopy
After etching it was possible to see the steel structure with the microscope. Photos were taken of all the samples from the surface and the cross section. With these pictures it was possible to define the structure type.
With the aid of a program called Image tool it was possible to give a pre-analysis of the texture in the steels. About 200 grains on the pictures were measured in horizontal and vertical direction and an average aspect ratio of the grain geometry was calculated.
After the forming experiments performed in Arnemark the deformed steel samples were studied in order to evaluate the development of cracks in the material during the forming sequence
3.1.3 SEM
With the Scanning Electron Microscope pictures from all the cross sections and surfaces of the samples were also taken. Both secondary electron and backscattered electron modes were used. The pictures aided in making a more exact determination of the structure. Also the pictures could be used to find defects in the material and to see the development of the structure or defects
dependence on the depth in the material. For these measurements pictures were taken regularly spaced through the depth of the material on the cross section samples.
3.1.4 Hardness test
The hardness tests were performed with the Vickers method with different loads for the different steels. For Docol Hard 450/550 Y and their base materials the load was 15kN, for Docol Hard 850/9oo Y and Docol Hard 1500 T and their base materials it was 30kN.For every sample, at least 5 values were taken and an average value calculated, in order to compare this value with the initial informations of the material.
For the steels Docol Hard 450/550 Y 12 micro hardness values were also taken with a load of 300g, in order to compare the micro hardness with the macro hardness. The test was made because of the small thickness of the steel to ensure a good hardness result.
3.1.5 Tensile test
The tensile tests were in the laboratory of solid mechanics at the university in Luleå. From each steel 10 samples were cut of the following shape (Fig 6) by using a water jet-cutting machine at a company in Luleå. Five samples were cut in the parallel and five samples in the transverse direction to the rolling direction.
The 50 samples were loaded in the tensile machine until failure. Test parameters such as crosshead speed and force were not reported. This experiment gives us the stress-deformation-graph of the steels, which were not previously obtained, but is an important detail concerning the deformation ability of a material. The parameters of interest are yield strength (Rp0,2) and tensile strength (Rm). Not all the samples delivered useful results because some broke outside of the gauge length.
3.1.6 X-ray diffraction
The method of x-ray diffraction is an important one for the characterization of materials. It can be used for many different experiments.
In this project two types of measurement were taken:, firstly the measurement of textures in a material and secondly the measurement of the deformation in the material depending on the penetration depth.
3.1.6.1 Texture measurement
The texture measurement begun with the record of a diffraction pattern of every steel, which were compared with the powder diffraction pattern of iron, because the steels are low alloyed. For the steels Docol Hard 850/900 Y the diffraction pattern were taken at the very outer surface and for a Figure 6: Shape of the tensile test sample
surface which was polished lightly. The diffraction pattern showed a difference in peak height compared to the Iron Powder.
Consequently a pole figure measurement for all the steels was performed. The step length was 5° and the measurement of each step took 20 seconds.
The resulting diffraction pattern and pole figure pattern were converted with the program conVX to a data file, to enable it to be opened in Origin or Excel.
3.1.6.2 Deformation measurement
The measurement of the deformation in the steels was taken as a function of penetration depth of the x-rays. The x-ray penetration depth can be increased by increasing the omega angle (see Fig 7). For this experiment one peak was chosen for every steel, being the (110) which lies around 40°. This peak was scanned over 2-theta using a fixed omega angle, which was varied from 5° to 35° in steps of 5° between each scan. The 2-theta range varied every scan by about 5° plus and minus from the center position of the measured peak, and the theta step size was 0.5 degree and measurement lasted 2 seconds at every step.
The resulting graph of the peak was converted with the program conVX to a dat file, to be able to be opened with Origin, where the peak was drawn and fitted with a non linear function. This fit allowed measurement of the peak width w at half of the peak height (fwhm).
The values for w were taken into an excel sheet and converted to a graph. Figure 7: Schematical drawing of the x-ray-diffractometer
3.2 Forming
During the material characterization in the laboratory, it was decided to perform a bending sequence in the laboratory of SSAB in Borlänge and one at the company Svetjänst in Arnemark.
The rollforming process could not be realized because of communication problems with the operator in Borlänge, who did not answer any e-mails sent.
3.2.1 Corner Bending in Borlänge
Squared samples with a length of 9 cm were cut and sent to the laboratory in Borlänge. There a technician, Jarmo Hirvelä, performed the forming sequence and found the minimal radius in the following way (translated from an e-mail of Jarmo Hirvelä):
“In the beginning the width of the bottom tool, which has a rectangular hole, is chosen to correspond to 10 x thickness of the test material.
After this the radius of the knife is chosen. It does not matter which radius is chosen in the beginning, it has just to fit to the width of the bottom tool. Then the first sequence of bending is made.
If the result is without cracks, the knife has to be changed to one with an smaller radius. This change is made until the bent sample shows cracks.
If the first bending result shows cracks a knife with a bigger radius has to be chosen, until the bending result is without cracks. It is possible during this knife change that the width of the bottom tool has to be changed corresponding to the knife radius.
When you have a bending result without cracks, the same testing sequence is made with a smaller width and the same knife, and with a larger width widen and a smaller knife radius, in order to see if it is possible to get a smaller resulting bending radius in the material“
3.2.2 Press Bending in Arnemark
The press bending in Arnemark was performed in cooperation with Jan-Olov Renberg from the company Svetjänst in Arnemark. Erling Sundström of SSAB Hard and special steels and myself, went there twice to perform the experiments with the 5 steels and the base materials.
Also the bending was done on almost squared samples there, with a length of about 9 cm. For each steel the radius was altered to achieve a bending where the sample did not break. But to vary the radius we had to use inlays of a certain thickness during the bending. These inlays are listed in the results table 11.
Table 11: Inlay to influence bending angle during press bending
Material Inlay [mm]
Parallel bendingCross bending
Docol Hard 450Y (0,35mm) 0 0
Docol Hard 550Y(0,35mm) 0 0
Docol Hard 1500 T ~1mm 1-2 1 Docol Hard 1500 T ~2mm 1-2 1-2 Docol Hard 900 Y (3,0mm) 1-2 1-2 Docol Hard 850 Y (4,0mm) 1-5 1-5 DC 04 (0,5mm) 0 0 350Y (0,5mm) 0 0 700MC (3,75mm) 1-2 1 Dc 1400 (2mm) 0 0 700MC (4,7mm) 5 5
4 Results
This section presents the results of the different tests and measurements. The results are given in the same order as for the experimental description given in the previous section.
4.1 Material characterization
The material characterization delivered results that enhanced and filled gaps in the previous knowledge of the materials, and allowed us to show that the properties of a material are strongly connected to their behaviour during forming.
4.1.1 Optical Microscopy
Optical microscope images from the surface and the cross section of every steel and their base materials are presented below.
● Docol Hard 1500 T (1,92mm) (4%)
Docol Hard 1500 T has a martensitic-ferritic structure. It is a polyphase steel which isclearly seen in the optical micrographs, where the clear grains are ferritic and the darker zones martensitc.
Figure 8: Docol 1500, surface, 1000x, 2%
● DP 1400 (mm)
The base material DP 1400 has a very similar microstructure as the Docol Hard 1500 T. The properties have not changed much due to the low rolling percentage of 4%.
For this steel group grain size and aspect ratio were not figured out because the grains were hardly to distinguish.
● Docol Hard 900/850 Y (3/4 mm) (20/15%)
Figure 12: Docol 900, surface, 1000x, 2% Nital
(20s), Marshalls reagent(10s) Figure 13: Docol 900, cross section, 1000x, 2% Nital (20s), Marshalls reagent (10s)
Docol Hard 900/850 Y has a ferritic-pearlitic structure with a content of approximately 15% pearlite. The grains have a size of ~3µm and the aspect ratio is about 2.18.
Figure 10: DP 1400, cross section, 1000x, 2% Nital (30s)
Figure 11: DP 1400, surface, 1000x, 2% Nital (30s)
● 700 MC, 3,75/4,70mm
The base material for Docol Hard 850/900 Y, MC700 4,7/3,75mm, has the same ferritic-pearlitic structure with 15% pearlite content. The grains have a size of approximately 2µm and the aspect ratio determination gives values ~1-1.5.
Visually the structure shows no significant change during a rolling of 15-20%, but the calculated aspect ratio has changed which is a sign fora higher texture.
Figure 17: 700 MC, 3,75mm, cross section, 1000x, 2% Nital, (30s)
Figure 16: 700 MC, 3,75mm, surface, 1000x, 2% Nital (30s)
Figure 14: Docol 850, surface, 1000x,2% Nital (20s), Marshalls reagent (10s)
Figure 15: Docol 850, cross section, 1000x, 2% Nital (20s), Marshalls reagent (10s)
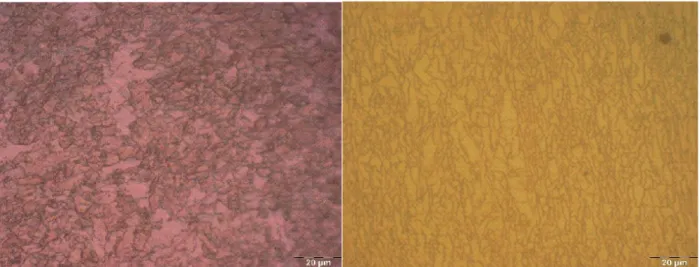
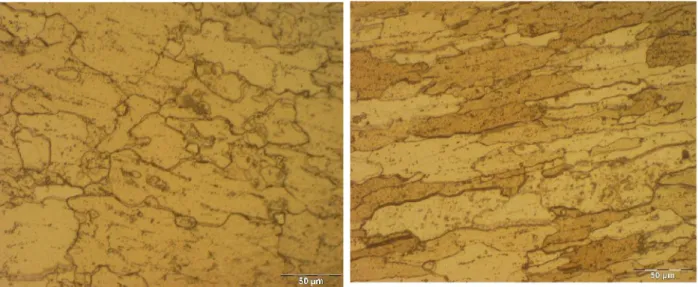
• Docol Hard 450 Y (0,35mm) (41,67%)
Docol Hard 450 has also a ferritic pearlitic structure, but with a 6% pearlite content. The grain size is ~ 20µm and the steel has an aspect ratio of ~ 1,7.
Figure 20: Docol 450, cross section, 500x, 2% Nital (30s)
Figure 19: 700 MC, 4,7 mm, surface, 1000x,
2% Nital (30s) Figure 18: 700 MC, 4,7 mm, cross section, 1000x, 2% Nital (30s)
Figure 21: Docol 450, surface, 500x, 2% Nital (30s)
● DC04, 0,6 mm
The structure of DC04 is ferritic pearlitic as Docol Hard 450Y with a 6% pearlite content. The grain size is ~ 15µm and the aspect ratio ~ 1.5.
Again only the aspect ratio has changed during the cold rolling.
● Docol Hard 550Y (0,35mm) (30%)
Also here the structure is ferritic pearlitic with a pearlite content of 6%. The grain size is much smaller because of the Nb content and has a value of ~ 6µm. The aspect ratio is 1.5 on the surface and ~ 3.5 for the cross section.
Figure 22: DC04, cross section, 500x, 2% Nital (30s)
Figure 23: DC04, surface, 500x, 2% Nital (30s)
Figure 25: Docol 550, surface, 500x, 2% Nital (30s)
Figure 24: Docol 550, cross section, 500x, 2% Nital
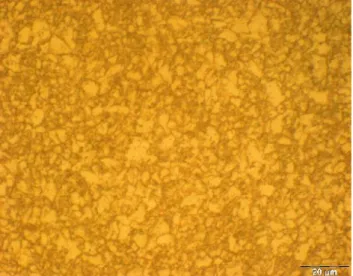
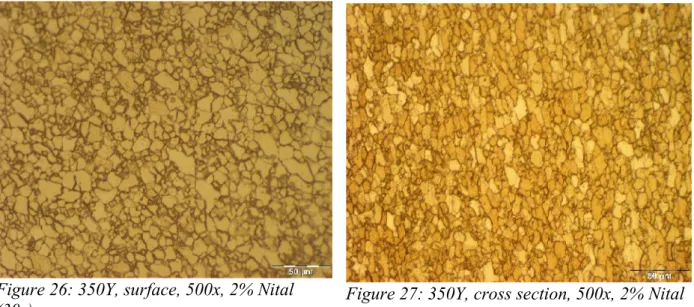
● 350Y, 0,5 mm
The baseline material 350Y for Docol Hard 550 Y has a ferritic pearlitic structure with 6% pearlite. The grain size is ~ 6µm and the aspect ratio ~ 1-1.5.
Figure 26: 350Y, surface, 500x, 2% Nital
4.1.2 SEM
With the Scanning Electron Microscope studies of defects in the material and of the differences through the thickness of the materials were made. In general it can be said that cracks are more common at the edges of the cross sections.
4.1.2.1 Cracks
Figure 28: 450, edge crack
mounting polymer
Figure 29: 550, edge crack
mounting polymer
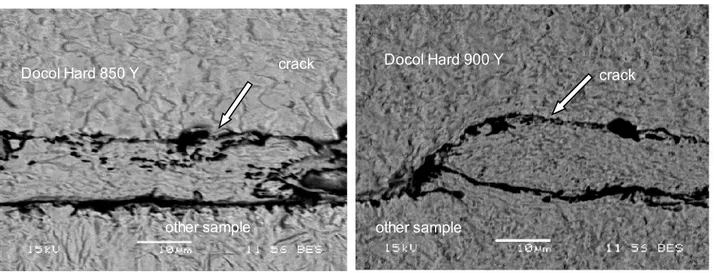
Figure 30: 850, edge crack
Docol Hard 850 Y crack
other sample
Figure 31: 900, edge crack Docol Hard 900 Y
crack
In every sample cracks can be seen, which are more concentrated on the edge of the cross section. The cracks were most likely developed during the cold rolling of the steels.
In the steel with the smallest rolling reduction percentage, the cracks are the smallest.
4.1.2.2 Edge middle difference
Figure 33: 450, edge Figure 34: 450, middle
Figure 32: 1500, edge crack
Docol Hard 1500 T crack
Figure 35: 550, edge Figure 36: 550, middle
Figure 37: 850, edge Figure 38: 850, middle
The images show that there are differences between the edge regions and the inner regions. At the edge the grain boundaries are less sharp, probably because of deformation defects and also the texture is often more developed than in the center of the samples.
4.1.3 Hardness test
Here are the hardness test results for measured with the Vickers method with the parameters described in 3.1.4.:
● Hardness test for the 5 main steels:
● Hardness test for the base materials:
The hardness tests delivered results that were always within the region given in the preliminary information about the materials, which consisted of a mix of theoretical values and values from initial material tests.
The microhardness test did not show good results because the step size was not to set up clearly. Figure 41: 1500, edge
Table 13: Hardness results base steels
MC700, 3,75 MC700, 4,70 DP1400 DC04 350Y
252,2 247,6 467,2 78,48 94,7
Table 12: Hardness results main steels
Docol 450 Docol 550 Docol 850 Docol 900 Docol 1500
169,67 212,67 290,8 301,6 481,2
4.1.4 Tensile test
The tensile test results did not show a high standard deviation. The following tables show the results for the main material Docol Hard 1500 T and its corresponding base material Dp 1400. These two materials showed the largest variation in test data.
Figure 43: strength of DP 1400
The values for tensile tests of the base material have an average value of 1175,96 MPa and a standard deviation of 112,94 MPa for the Rp02 and an average value of 1512,27 and a standard deviation of 28,29 for the Rm.
It is not known how these samples were oriented with the rolling direction. 1000 1025 1050 1075 1100 1125 1150 1175 1200 1225 1250 1275 1300 1325 1350 1375 1400 1425 1450 1475 1500 1525 1550 1575 dp1400 Rp02 Rm sample number st re ng th [ M P a]
Figure 44: Strengths of Docol Hard 1500 T 0°
In the parallel direction to the rolling direction, for Rp0,2 the average value is 1343,988 MPa and the standard deviation is 6,82 and for Rm the average value is 1474,762 MPa and the standard deviation is16,61.
Figure 45: Strength of Docol Hard 1500 T 90°
For the strength, in the direction transverse to the rolling direction, for Rp0,2 the average value is 1361MPa and the standard deviation is 7.96 and for Rm the average value is 1498MPa and the standard deviation is 6.28.
These results would suggest a clear difference in behaviour in the 2 different directions, but the results must be taken with caution. For the main materials the tensile tests were only performed on
1 2 3 4 5 1200 1225 1250 1275 1300 1325 1350 1375 1400 1425 1450 1475 1500
Docol Hard 1500 T (0°)
Rm Rp0,2 sample number S tr e ng th [M P a] 1 2 3 4 5 1200 1225 1250 1275 1300 1325 1350 1375 1400 1425 1450 1475 1500 1525Docol Hard 1500 T (90°)
Rm Rp0,2 sample number st re n gt h [ M P a ]3 to 5 samples of one material roll, which were taken from almost the same place in the roll. This shows relatively small variation and thus good local uniformity, however as the larger test sequence on the base material shows, a larger number of tests from throughout the roll or between batches are likely to reveal wider variation and differences, increasing the error.
4.1.5 X-ray Diffraction
The x-ray diffraction analysis gives better understanding of the material behavior. Different characterization methods were used in this work.
4.1.5.1 Texture measurements
Prior to the texture measurements, base diffraction patterns were taken of the materials. Out of them the lattice indices could be found for the pole figure measurement. The diffraction patterns were compared to the diffraction pattern of iron powder to get a first qualitative impression of the texture in the material.
Figure 46: Diffraction Pattern, Docol Hard 900 Y
The diffraction pattern of Docol Hard 900 Y showed the biggest difference to the diffraction pattern of iron powder. Consequently this steel is the one with the most developed texture.
30 40 50 60 70 80 90 100 110 -500 0 500 1000 1500 2000 2500 3000 3500 44,645 81,425 n u m b e r o f c o u n ts 2Theta number of counts
A diffraction pattern of the same steel where the sample was polished was measured, and this pattern shows much less differences with the iron pattern. This shows that the material at the surface is more textured and influenced by the cold rolling than in the center of the steel. In order to get more informations about the texture, pole figures were measured.
Figure 47: Diffraction pattern, Docol Hard 900 Y, polished
30 40 50 60 70 80 90 100 110 -50 0 50 100 150 200 250 300 350 44,555 n u m b e r o f c o u n ts 2Theta number of counts
The pole figure does not show a very clear texture, although the measurement was made with the Docol Hard 900 Y, whose diffraction pattern showed the most differences to the iron powder sample pattern, which indicated qualitatively the strongest texture of all the materials.
4.1.5.2Deformation Measurement
As seen on the diffraction pattern of Docol Hard 900 Y, there were differences in the structure on the outer surface compared to the centre. This means that the surface was more deformed during the cold rolling than the centre of the sample, which is a logical phenomenon for this type of forming procedure. To understand this better, the third experiment with x-ray diffraction used varying penetration depth of the x-rays, by varying the Omega angle, in order to measure the deformation of the material.
The graph shows the extent of deformation in the steel depending on the penetration depth. It is clear that the deformation is highest at the surface. In the beginning it sinks fast with the growing Omega angle and stays stays nearly constant with a value of 15 ~ 0.22.
Figure 49: peak width w at half of the peak height depending on the penetration depth of the x-rays
5 10 15 20 25 30 35 40 0 0,1 0,2 0,3 0,4 0,5 0,6 0,7 0,8 0,9 1
Doco1500- peak width
full width at half maximum Omega fu ll w id th a t ha lf m ax im um
4.2 Forming
The forming experiments were made in two different places. The air bending (bockning) was performed in the laboratory of SSAB in Borlänge and the press bending (kantvikning) was performed at Svetjänst in Arnemark.
4.2.1 Air bending
The air bending was performed by the technician Jarmo Hirvelä, and the results are shown in the following table:
The results show a big difference between the values for the bending parallel to the rolling direction and the bending transverse to the rolling direction.
Table 14: Smallest bending radii without cracking, air bending
Material Thickness Knife radius Ri/t Ri
[mm] [mm] [mm] [mm]
Docol Hard 450Y 0,35 6 26 Prallel 14
4,9
Docol Hard 450Y 0,35 0,5 9 Transverse 1
0,35
Docol Hard 550Y 0,35 5 18 Parallel 13 4,55
Docol Hard 550Y 0,35 0,5 9 Transverse 1 0,35
Docol Hard 850Y 4 26 63 Parallel 4,75 19
Docol Hard 850Y 4 6 50 Transverse 1 4
Docol Hard 900Y 3 16 50 Parallel 4,3 12,9
Docol Hard 900Y 3 4 50 Transverse 1 3
Docol Hard 1500T 1,92 8 32 Parallel 3,6 6,91
Docol Hard 1500T 1,92 5 32 Transverse 1,8 3,46
Wideness of the lower tool
Dependance to the rolling direction
4.2.2 Press bending
The bending results from Arnemark are given in two parts. Firstly there is the minimal resulting bending radius and in the second part the springback which results from the material strength and deformation.
4.2.2.1 Forming radius
It should be noted that it was not possible to measure radii smaller than 1 mm and between 7 and 14. This was due to lack of proper instrumentation which could not be solved within the duration of the project.
The forming radius also shows differences between the parallel and transverse samples, but this difference is much smaller than as for the resulting bending radius from the corner bending. Table 15: Smallest bending radii without cracking, press bending
Parallel Perpendicular
Material Min. radius inside Min radius outside Min. radius inside Min radius outside
<1 1,25 1,5 2 <1 1,5 5,5 >7 >7 2,25 6 2,5 6 6 2,25 5 DC 04 2 2,75 2,5 3,5 350Y 2,25 3,5 2,25 700MC (3,75mm) 3 7 3,5 >7 700MC (4,7mm) 7 >7 6,5 >7
Docol Hard 450Y
Docol Hard 550Y Betw. 1,25 and 1,5 Betw. 1 and 1,25
Docol Hard 850 Y Betw. 3,5 and 4
Docol Hard 900 Y
Docol Hard 1500 T ~2mm Betw. 4 and 4,5
In Figure 53 the bending radii of the two different methods are given in a bare chart. The results of the air bending are given in blue and the press bending results in green. The highest and smallest differences between the different bending directions are given in table 15.
Figure 50: Smallest bending radii without crack formation for both methods Docol Hard 450Y Docol Hard 550Y Docol Hard 850Y Docol Hard 900Y Docol Hard 1500T 0 2 4 6 8 10 12 14 16 18 20
Bending Radii
Ri (par, air bending) Ri (par, press bending)
Ri (perp, air bending) Ri (perp, press bending) Material ri [m m ] r >7
Table 16: Differences between bending directions
Differences between bending directions Biggest Smallest
Air bending 15 3,45 Press bending 1 0
4.2.2.2 Notation of the Bending results
Another result from the press bending is concerning the notation of the bening radii as it is
presented in tabel 10, which is a*t, where a is the bending constant during the bending test and t is the thickness of the material.
There were bending tests performed on Docol Hard 1500 T with the thicknesses ~1 and ~2mm.
In the tabel is to see that a is not constant for the two thicknesses.
Table 17: Minimal bending radius without crack formation, press bending, constant a
Parallel Perpendicular
Docol Hard 1500 T Min. radius Min. radius
Thickness Inside a*t Outside a*t Inside a*t Outside a*t
[mm] [mm] [mm] [mm] [mm]
~1 2,25 – 2,5 2,25*t – 2,5*t 3,5 – 4 3,5*t – 4*t 2,25 2,25*t 3,5 3,5*t
4.2.2.3 Springback
The base materials have a lower springback than the main materials, probably caused by the sold rolling of the materials, which introduces residual stresses into the material.
For the base materials the springback grows with the cold rolling percentage of the material, which corresponds to the deformation hardness in the material, which is one of the two parameters
influencing the spring back. The second one is the residual stresses in the material. Figure 51: springback base materials
DC 04 350Y 700MC (3,75mm) 700MC (4,7mm) dc 1400 0 2,55 7,510 12,515 17,520 22,5 25 27,5 30 32,5 35 37,5 40
springback base material
Springback max Springback min
material (increasing strength
sp
ri
ng
ba
ck
Table 18: minimal and maximal springback, which occured during press bending
Material Springback min Springback max
Docol Hard 450Y 18 22 Docol Hard 550Y 17 28 Docol Hard 850 Y 9 16 Docol Hard 900 Y 9 14 Docol Hard 1500 T ~2mm 10 20 DC 04 1 3 350Y 7 11 700MC (3,75mm) 7 11 700MC (4,7mm) 12 13 dc 1400 13 25
Here the springback is not increasing with the strength at the materials. Here must come in the effect of the residual stresses. It seems as if the influence of the residual stresses increases much at a certain stress level. The three materials, Docol Hard 1500T / 850 Y and 900Y which are rolled 4/15/20% follow still the dependence of the strength but the two materials Docol Hard 450 and 550 Y follow the springback-residual stress dependence.
Figure 52: springback for the main materials
Docol Hard
450Y Docol Hard 550Y Docol Hard 850 Y Docol Hard 900 Y Docol Hard 1500 T ~2mm 0 5 10 15 20 25 30 35 40 45
Sring back main material
Springback max Springback min
material ( increasing strength)
sp
rin
gb
ac
5 Discussion
Microstructural Effects
In this section the results from the previous section are discussed and related to the forming behaviour of the materials.
The materials used all have a ferritic-pearlitic structure where the pearlite content is not easily visible with the optical microscope, only with the SEM. The only exception is the Docol Hard 1500T, which shows a ferritic-martensitic structure, where the ferritic parts and the martensitic parts are clearly to distinguish, but in the martensitic part the grain borders were not so easily seen. Consequently only for the ferritic-pearlitic steels the grain size and the aspect ratio was measured. In all steels, a texture can be seen on the optical images and in the diffraction patterns when compared to the random pattern of iron powder. This is caused by the rolling of the steels.
Diffraction patterns of the very surface of the materials and from within the bulk by polishing away the surface showed strong qualitative differences. Consequently it can be concluded that there is a relatively strong texture produced at the very surface of the steel, but with the depth into the material this texture changes. In this report the highest texture was seen on the 1D diffraction pattern of Docol Hard 900 Y (e.g. the 110-peak had an intensity difference of ~300 between the not polished and the polished sample).
All the steels show a higher extent of deformation at the edge of the material than in the centre, forming a gradient of cold work through the depth of the material. The material which is the least rolled, Docol Hard 1500 T, showed the least differences in material properties and forming properties, when comparing the base mazterial and the rolled material.
Several results confirmed this deformation gradient effect. Optical and SEM images revealed structural differences at the edge of the material cross sections and the centres. The grains are more deformed and their grain boundaries are less sharp. The texture is also more clear at the edges of the materials. Cracks could also be detected at cross section edges of each of the materials but not in the center. The cracks are growing into the material down to a depth of ~5 to 10 µm. In some images it can be seen that a part of the cracks are oriented along the rolling direction which also influences the forming behaviour of the material [12].
One last proof for the deformation grade varying with the depth in the material was the deformation measurement with the XRD, during which the deformation was measured depending on the omega angle which is a sign for the penetration depth of the X-rays into the material.
Unfortunately the pole figure measurements could not confirm this effect, due to probable errors in the calibration of the machine, and the x-rays having a higher penetration depth than expected, so that the weak texture in the middle was measured and not the strong one at the surface.
From this it can be concluded that special precautions should be taken in order to avoid a such high deformation extent on the surface like that seen here. This is because the edge where the material is in contact with the cold rolling rolls is much more damaged and deformed than the centre of the material. It is this area which is also most highly loaded during bending, and where cracks are most likely to open and grow under tension. Hence if they are already present, the material is already weaker, and thus they can grow and destroy the material during a further forming load after the rolling.
In the paper “Cold rolling texture development of α/γ duplex stainless steels” of Nuri Akdut, Jacques Foct and Günter Gottstein, [11], is written that in order to avoid a deformation gradient through the thickness of the sample the ratio of contact length ld (between roll and material) to
sample thickness may not be smaller than 1.
ld d≈
d⋅r
d 1 , with d: sample thickness;
Δd: thickness reduction in each rolling pass r: radius of the roll
Mechanical Behaviour
The mechanical testing gave an overview over the material behaviour under certain loads. The Vickers hardness is localised on specific points in the material, and the test confirmed in general the data given in theoretical information and in earlier tests. The hardness is theoretically related to the tensile strength in the following way:
HV ~ Rm/3
The theoretical as well as the experimental values confirm this relation.
With the tensile test the strength of the bulk material and behavior during one dimensional load is measured. This can be related to the bending behavior because during bending, one side of the sample is under a tensile traction load. It is mostly this part of the sample, the surface layer with the tensile load, which shows cracks during the forming sequence.
The tensile test samples appeared to show a detectable difference in strength (e.g. Docol Hard 900 Y: Rmpar = 942,5MPa , Rp0,2par = 899,71MPa ; Rmperp = 1044,07MPa , Rp0,2perp =
1011,62MPa ) when measured along the rolling direction or transverse to it, with a small standard deviation (respectively: 4,56, 7,41; 4,19, 5,18). However these results must be taken with caution as the variation will probably be larger when the samples will be taken from different places in the roll or even from other rolls. All 5 samples were taken from the same position in the rolls, so they have good local uniformity. But to be certain, a wider study must be made to verify this result. To make a generalization from these few tests about the forming behavior of the five steels is therefore
difficult.
The low statistical variation seen in the mechanical testing did not correspond to the results found during the forming section, where in some case bigger variations were revealed.
The forming part of this project consisted of two different methods, air bending and press bending. The air bending was performed in the SSAB laboratory in Borlänge and the press bending at Svetjänst in Arnemark. Some problems were encountered with coordinating the activities amongst these companies. It was not possible to observe the air bending and only the final data was received, so it is unclear how comparable this is to the press bending conditions. Also, insufficient base material was able to be provided for a thorough comparison of properties. This makes the test method comparison difficult, however, some generalisations can be made, such that smaller grains as well as lower thicknesses allow smaller bending radii.
The results of the air bending delivered high differences between the two forming directions, ie. bending in the rolling direction and the bending across the rolling direction (rparallel-rperpendicular
=3,45-15mm). These differences are caused by the defects in the material, the texture in the surface layer and the aspect ratio of the particles. However his is not enough to explain all the differences, because the material was the same for the press bending and there the differences seen between the bending directions were much smaller(rparallel-rperpendicular=0-1mm). Factors such as the force applied or
speed of bending, which were not in our control, may affect the bending behaviour. Also the sample geometry could influence the bending, which was not controlled for the air bending either, only for the press bending (samples of about 10x10cm).
For the Air bending smaller radii were found for the bending across the rolling direction, and for the press bending smaller minimum radii were found for the bending parallel to the rolling direction. The differences in the bending results for the different bending directions can be caused by the orientation of the cracks in the material which are there initially. The cracks are more oriented along the rolling direction. When the bending is performed across the rolling direction the cracks are not under tension and there is less force to open them by the bending load compared to the bending parallel to the rolling direction which puts the cracks under high tensile loads [12].
One aspect which could influence the differences between the forming methods is the forming speed. This aspect was not tested in this project but is a proposal for a future work on the bending of steel.
Another bending parameter which was measured was the springback during the bending. The springback is mainly depending on the strength and the residual stresses in the material [6]. The results clearly show that the higher the strength the higher the springback. There is only one exception which are Docol Hard 450 Y and Docol Hard 550, the two steels which are the most rolled. During the rolling are residual stresses introduced into the material. The theory is that the introduced residual stresses in combination with the residual stresses which are introduced during bending, create the higher springback as seen for these materials. It seems like as the residual stresse don't have much influence until they reach a certain amount in the material, but then their importance dominates over the influence of the material strength. In fact there is still an increase with strength for the three materials which are rolled 4%, 15% and 20%, but the materials which are rolled 30% have the lowest strength but the highest springback.
In order to study the influence of forming parameters such as the angle and the radius, the air
bending is better than the press bending, because it is possible to vary both parameters, while for the press bending the bending radius cannot be easily influenced and it appears to be less sensitive to microstructural effects.
Consequently, because of the different bending conditions and lack of control over parameters, these methods are not well comparable in the way which was performed during this project. The way of testing has to be strongly defined to be able to get more specified conclusions about the bending behaviour of a material with different bending methods.
An additional test, the bending of Docol Hard 1500 T in two different thicknesses, brought the question if the way of notation of the bending radius, thickness * constant number, is the right way. For the example of Docol Hard 1500 T it did not correspond.
6 Conclusions
The aim of this work was to compare different bending methods, air bending and press bending, in order to find the minimal bending radius of five different steels and evaluate the best method for this work. Microstructural and mechanical parameters were to get connected to the material behaviour during bending, too.
The following conclusions could be drawn out of the results of this project:
• The two bending methods were difficult to compare because the tests were made by different persons in different ways and because the methods have both different conditions for the testing. It was not possible to oversee or control the bending parameters such as speed of bending, which may have a large effect on the results. Therefore a more controlled experiment with larger sample numbers should be performed to really understand the effect of bending test method.
• Air bending is more sensitive to microstructure and has better control over bending parameters hence it is most likely the better method for evaluating the materials.
Despite these problems with control over the bending tests, the micostructural study allowed the following conclusions to be made:
• The surface layer, which is the most deformed part in the sample after the cold rolling, is
responsible for defects formed during the bending sequence, as this layer is the most loaded part in the sample. The surface layer is loaded with a tensile load during bending and this causes cracks to form easily and they can grow easy, because they are opened under tension.
• The texture is the highest in the surface layer. This texture influences the different results in
different bending directions. In the middle the texture is much lower and different. This texture has not much influence on the bending.
• The statistically variation was low for the small testing sequences in this project. The tests were made with samples which come from the same place in the same roll. It is expected that the variances will grow, when larger testing sequences are made with samples from different place and rolls. Therefore the results must be taken with caution.
• It is difficult to give a general minimal bending radius for these materials. Radii specific to the test methods used here were given previously in Tables 13 and 14.
7 Future work
The results of this project were not fully conclusive, hence there are several areas where further work is required. Here are my recommendations for future work:
− The bending tests have to be made with an exactly defined way of testing, in order to be able to make the results comparable.
− A test of the influence of forming speed on the tests would be interesting. Firstly the forming speed of the two methods, if there is a difference or not. And secondly a measurement how the forming speed influences the material behaviour, for example a tensile test with different drawing speeds.
− Local heat treatment would probably improve the bending results. A test with a linear laser treatment during the bending sequence would be most interesting [10].
− An important consideration is the communication and planning between LTU, the companies,
and the persons involved in the project to ensure that materials are available and consistency of the tests performed. This was a significant factor which was making the work difficult.
8 References
[1] Material papers of SSAB Tunnplåt AB
[2] Praktikumsbericht von Anna Manzoni, Stefan Lackes, Tobias Müller, Christina Ackermann des Praktikums Zerstörende Werkstoffprüfung
[3] Domke: Werkstoffkunde und Werkstoffprüfung
[4] ASM Handbooks online, Volume 1, Properties and Selection: Irons, Steels, and High Performance Alloys, Carbon and Low-Alloy Steels, Steel Processing Technology, Processing of Solid Steel
[5] The Book of Steel, Reheating and Hot Rolling + Cold Rolling and Annealing
[6] SSAB Tunnplåt: Formningshandboken Styckskärande bearbetning och plastisk formning [7] Zafer Tekýner: An experimental study on the examination of springback of sheet metals
with several thicknesses and properties in bending dies, Journal of Materials Processing Technology 145 (2004) 109–117
[8] VAMP 15 – Formning av ultrahöghållfast stål: Delrapport 10: Kantbockning av Lars-Olof Ingemarsson, IVF Industriforskning och utveckling AB
[9] Produktionsprogramm für kaltgewalzte Feinbleche (Docol) von SSAB. [10] VAMP 15 - Formning av ultrahöghållfast stål: lokal Värmebehandling
[11] Nuri Akdut, Jacques Foct and Günter Gottstein: Cold rolling texture development of α/γ duplex stainless steels
[12]Patrik Midebjörk: Böjning och återfjädring av höghållfast kolstål (Examensarbete), Maskinteknik / 2005:051, Luleå Tekniska Universität
![Figure 3: schematic drawing of the corner bending [6]](https://thumb-eu.123doks.com/thumbv2/5dokorg/4295911.96066/14.892.245.499.293.757/figure-schematic-drawing-corner-bending.webp)
![Figure 4: schematic drqwing of the airbending [6]](https://thumb-eu.123doks.com/thumbv2/5dokorg/4295911.96066/15.892.94.787.951.1111/figure-schematic-drqwing-of-the-airbending.webp)