VTI särtryck
Nr 230 ' 1994
Children's Road Safety and the Strategy
of Voluntary Traffic Safety Clubs
Nils Petter Gregersen and Sixten Nolén
Reprint from Accident Analysis & Prevention, Vol. 26,
No.4,1994,pp.463 47O
BARNENS
TRAFIKKLUBB
NTF
(db
Väg- och
transport-,farskningsinstitutet
VTI särtryck
Nr 230 ' 1994
Children's Road Safety and the Strategy
of Voluntary Traffic Safety Clubs
Nils Petter Gregersen and Sixten Nolén
Reprint from Accident Analysis & Prevention, Vol. 26,
No. 4, 1994, pp. 463 470
db
Väg- och
transport-farskningsinstitutet
'
ISSN 1102 626XPergamon Accid. Anal. and Prev., Vol. 26, No. 4, pp. 463 470, 1994Copyright © 1994 Elsevier Science Ltd Printed in the USA. All rights reserved 0001-4575/94 $6.00 + .00
0001-4575(94)E0003-4
CHILDREN S ROAD SAFETY AND THE STRATEGY
OF VOLUNTARY TRAFFIC SAFETY CLUBS
NILS PETTER GREGERSENI'Z and SIXTEN NOLENl
lSwedish Road and Transport Research Institute (VTI). S 581 01 Linköping, Sweden, and 2Department of Community Medicine. University of Linköping
(Accepted October 1993)
Abstract This study focuses on the problem of traf c safety among children and the effectiveness of
voluntary traf c clubs. General doubts are growing in regard to this traditional strategy of teaching and training children how to act in speci c traf c situations. It has been shown that their knowledge and behavior improve. but the effect on accident risk is not clear. ln this study. one model for traditional teaching of this type. a voluntary traf c safety club for children. is evaluated in terms of accident risk. The data have been collected through questionnaires to members and nonmembers of the club. Approximately 20% of Swedish children are members of the club. The results show that members do not have a lower accident risk than nonmembers. On the contrary. the risk in this nonexperimental study is found to be higher among members. The use of safety equipment is. however. higher among members. The results are discussed in terms of systematic differences between the groups. i.e. socioeconomics. and in terms of the possibility that the general strategy of the club leads to overestimation of the safety effect.
INTRODUCTION
The traf c safety of children is a major problem in most countries. In order to reduce the large number of fatalities and injuries among children. several ac-cident and injury prevention measures are used.
There is no doubt that the injury-preventive ef fects of protective equipment such as safety belts. child restraints. and bicycle helmets are good. A greater problem is to reduce the number ofaccidents as such. There are basically three strategies for achieving this. One is to make the traf c environ-ment safer by separating children from dangerous traf c. The second is to make grown-ups realize that children are children and that they can never be made responsible for their behavior in traf c. Conse-quently. adults must change their own behavior. The third. a more traditional method. is to teach children how to behave safely in traf c.
This third strategy is often used in schools as
well as in voluntary safety work. Since this tradition
is long-standing and the experience considerable.
the method is fairly simple to use. Several studies
have shown that practical training of children in real
traf c improves their traf c behavior (Roberts 1980;
Michon 1981; Van der Mohlen 1983; Rothengatter 1984; Van der Mohlen and Rothengatter 1981). The-oretical teaching of children has been shown to
im-prove their knowledge. but has a limited effect upon
463
behavior (Rothengatter 1981. 1984;
Berard-Ander-sen 1985).
There are. however. growing doubts about the effect of this teaching and training strategy on accident risk. which are based on knowledge from general child psychology. Children are children and can never be expected to assume their own responsibility in traf c. Children have a number of psychological and physiological limitations. They can learn a great deal about how to behave, but they can never be relied on to use their knowledge when necessary (Sandels 1975; Vinje
1981; Rothengatter 1984).
These studies. evaluating teaching and training programs for children. are seldom based upon ef-fects on accident risk. There are no guarantees that
effects on knowledge or behavior automatically lead
to a reduced accident risk (OECD 1990). The main reasons that accidents are seldom used lie in method-ological problems such as small numbers of
acci-dents or a low degree of experimental control
(OECD 1983; Rothengatter 1987).
A common method. used in a number of coun-tries, of dealing with this teaching and training of
children is through children s traf c clubs, which
are voluntary clubs that families join as members.
Normally. the strategy in such'a club is to offer help
to families to ful l children s teaching and training.
464 N. P. GREGERSEN and S. NOLEN
fairly similar to those of the Swedish club (NTF 1986).
In Sweden, the club is organized by the National Society for Road Safety (NTF) and is named the Children s Traf c Club.* This is a members club for children aged 3 7. It also provides guidance for parents in their work with children to increase road safety. It is mainly focused on the child as a pedes-trian. The club therefore supplements the teaching and training in preschools and schools. All children aged three receive an offer to become members. They pay a small fee to join, and every half year they receive in the mail an envelope that includes information and instructions for their parents, work sheets, puzzles, decals. gifts. etc. In all, they receive nine envelopes. each focusing on special themes, such as winter roads, how to cross roads. walking in darkness. etc. Cycling instructions are not in-cluded in the Swedish material. because these chil dren are considered too young to ride a bicycle in traf c.
The aims of the Swedish club are to:
1. increase parents knowledge of children s limited abilities in traf c.
2. implement a continuous teaching and train-ing program to prepare the children for han dling different traf c situations as they grow up.
3. create suitable attitudes among children to-wards traf c.
A general aim ofthe club is to reduce accident risks in traf c for its members.
However. it is not possible to be sure whether the Swedish club has such risk-reducing effects. The main reason is that no experimental studies of the club have been made. There is a nonexperimental evaluation of the Norwegian club. showing that members have a lower number of accidents than nonmembers. but since the study is nonexperimen-tal. it is difficult to draw de nite conclusions. Do the different accident levels between the groups de-pend on membership or on other systematic differ-ences? (Schioldborg 1974). In nonexperimental eval-uations of the English traf c club, The Tufty Club. no improvements in knowledge or behavior were shown (Firth 1973; Antaki, Morris. and Flude 1986). One conclusion that can be drawn from these studies is that membership in traf c clubs is selective. Mem-bers have a better socioeconomic situation com-pared to nonmembers. Ifa comparison is made ofthe
*The description of the club refers to the situation when the study was made. After the study the club was changed in various ways.
accident risk between members and nonmembers in a club, it is not possible to be sure whether differ-ences are explained by membership or by other un-derlying factors. In a study of child pedestrian injur ies in Calgary, Canada, it was clearly shown that more accidents occur in poor neighbourhoods and in areas with high rates ofjuvenile crime, thus showing that social disadvantages correlate with the number of accidents (Bagley 1992). Similar results were found in an English evaluation (West, Sammon, and West 1993).
This, together with the general doubts about children s capacity discussed above, suggests that an experimental study would be ofgreat importance. Such a study could include three groups to be com-pared one experimental group with self-selected. voluntary members; one with children that are per-suaded to become members: and a control group of nonmembers.
An experimental study such as this, however, has certain disadvantages. First, it is necessary to persuade a large group to become members, which would probably be an expensive arrangement. Sec-ond, it would take several years before the results could be seen. lt was therefore decided to conduct a pilot study as preparation for an experimental study. The hypothesis of this pilot study is that the accident risk is lower among existing members com-pared to nonmembers. The problem of social selec-tion will probably work in favour of the members. thus increasing this difference even more. Ifthe hy pothesis cannot be con rmed. this is a signal that there are problems with the safety effects of the club. These signals ought to be suf cient to start a discussion about the strategy of the club. without conducting the experimental study.
The main purpose ofthe pilot study was to pre-pare and test methods. samples. questionnaires, etc., to be used in an experimental study later on.
AIMS
The primary aim of the study is to investigate whether there are any differences between a group of members in a voluntary traf c club and a group of nonmembers. in terms of accident risk, traf c behavior. and the safety concern of the parents. A further aim is to use the experience and the results from the pilot study in planning an experimental evaluation of this voluntary safety work.
METHODS AND MATERIAL
The evaluation included three questionnaires sent out by mail on three different occasions. All three were sent to both groups, members and
non-Children s road safety and the strategy of voluntary traf c safety clubs 465
members. The questionnaires were answered by the parents. The main reason for using three question-naires was that many of the questions were time related, such as number of accidents and degree of exposure. If the time periods for their reports were too long, parents would have had dif culties in re-membering details.
The time periods covered by the three question naires were as follows: (a) period 1 covered the pe riod October December 1987 and was sent out in January 1988; (b) period 2 covered the period of January February 1988 and was sent out in March 1988; (c) period 3 covered the period of March May 1988 and was sent out in June 1988.
The rst two questionnaires were identical. These questions covered mainly traf c accidents and exposure, in traf c as well as in other circum-stances. In addition to traf c accidents, there were also questions about other types of accidents. The idea was to create a reference showing whether there were any general differences in accident proneness, not in uenced by membership.
The third questionnaire was more extensive and included, with the exception of the same questions as in the two other questionnaires, more general questions that were not time related, such as back-ground factors, children s general habits in traf c, use of safety equipment, strategies in traf c teaching and training, and parents attitudes and beliefs about children in traf c.
The nonmember group was randomly drawn from the Swedish population register (SPAR) and consisted initially of 800 children born in July 1981. By comparing their personal identi cation numbers with the member register of the club, 229 children who were members were excluded. The nonmember group thus nally consisted of 671 children.
The member group was drawn from the member register of the club. Since there were no routines for randomization in the register, all members born in July 1981 were drawn. The members group con-sisted of 1,500 children. In total, 2,171 children re-ceived the questionnaires. To reduce the
non-response rate, two reminders were sent out after
each questionnaire. With the same purpose, a lottery was held among those who answered, with ve
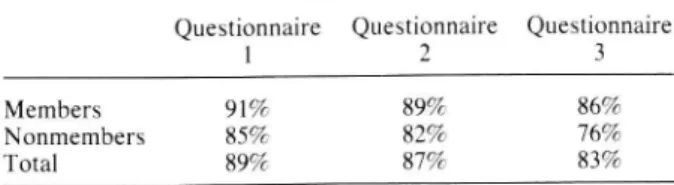
Table 1. Questionnaire response rates
Questionnaire Questionnaire Questionnaire
1 2 3
Members 91% 89% 86% Nonmembers 85% 82% 76% Total 89% 87% 83%
Table 2. Final size of groups in the pilot study Questionnaire Questionnaire Questionnaire
l 2 3
Members 777 761 732 Nonmembers 532 518 491 Total 1 309 1 279 1 223
pocket-size tape recorders and ve bicycle helmets as prizes. The response rates are presented in Table 1.
The birth date (July 1981) was chosen since greater effects from the club could be expected the longer the children had been members. The children were about six years of age when they received the questionnaires. By this time, the members had received seven out of nine envelopes from the club. Membership in the club normally starts at the age of three. It is also possible to become a member at the age of ve and thus participate only in the second half of the club. Information on the date of becoming a member was not included in the club register. Because of this, and because of the aim of evaluating the whole club, a question was included in the rst questionnaire concerning the date ofjoin-ing the club. Those who did join at the age of ve were excluded from the analysis. Table 2 shows the
nal size of the groups.
The measure of accident risk used is the number of accidents per 100 hours of exposure. Time is used as a measure of exposure instead of mileage since mileage for playing children is impossible to mea-sure. The questionnaire contains a de nition of acci-dents, including injured persons and/or damaged vehicles.
Three different statistical methods were used for testing differences between the two groups. For exposure, the t test was used. For accident risk, the 95% confidence interval for the quota between the risks of the two groups was calculated. If the con -dence interval includes 1.0, the hypothesis of differ-ence is rejected.
For other comparisons of answers from the questionnaire, chi square tests were used.
RESULTS
Comparability between Ilie groups
One of the basic assumptions that must be con rmed is that the two groups are as nearly equal
as possible in aspects other than membership. It is
obvious that they are not completely equal, since members voluntarily join the club. To study whether there are any other important differences, questions were asked about certain background factors. No
466 N. P. GREGERSEN and S. NOLEN
in With bicycle
[2 Without hicycicj
Hours per child
Members N on-members
Fig. 1. Exposure measured as hours spent in traf c environ-ments, October May, with bicycle (p < 0.01) and without
bicycle (ns).
significant differences were found. The groups do not differ greatly in distribution between the sexes. The distribution among the members is 50% 50% and the nonmembers include 52% boys and 48% girls. Most of the families own a car, including 98% of the member families and 96% among nonmem-bers. The same proportion of children in each group, 98%, know how to ride a bicycle.
Car traffic in the neighbourhoods is equally
in-tense. Fifty-eight percent in both groups have either car traffic to and from the house only or no car traffic at all around the house.
Exposure
The parents estimated the number of hours that the children had been outdoors in traffic environ ments, riding a bicycle, or walking during the week before they received the questionnaire. Based on this report, the number of hours has been calculated for the Whole period of the speci c questionnaire.
The results show that the members and non-members have been outdoors the same length of time. However, the members have been exposed to traf c environments less than the nonmembers. During the period from October to May, the average time in traf c environments was 210 hours for mem-bers and 250 for nonmemmem-bers (Fig. 1).
Accident risk
Comparing the total traf c accident risk (traf c
accidents/ 100 hours) the members have a signi -cantly higher risk. The total number of traf c acci dents reported is 394 for members and 162 for non members. If the risk is divided into cycling and noncycling, it is the accident risk when riding a bicy cle that is higher among members. Without cycling
. Total Accidents per 100 h
35 _
With bicycle
D Without hicycicj
0.30 : 0.25 j »-0.20: 0.15: 0.10: 0.05 j 0.00 ' Members N on-members
Fig. 2. Traf c accident risks, accidents/100 hours, totally (p <
0.05), with bicycle (p < 0.05) and without bicycle (ns).
the number of accidents is very small and no signi -cant differences can be shown (Fig. 2).
Other accidents, excluding traf c accidents, do not show the same difference. There is a tendency to the opposite pattern, with the members having a lower risk (Fig. 3). The number of accidents is low (88 for members and 95 for nonmembers). However, the difference is not signi cant.
The study was not dimensioned to compare the severity ofinjuries between the groups. The number of severe injuries in the groups was expected to be very low, which it also turned out to be. Therefore no signi cant differences can be shown in type of injuries. Most of the accidents, 95% 97%. are mi-nor; approximately 30% consist of accidents with
vehicle damage only, and 65% consist of injuries
that did not require any hospital treatment. Freedom of movement
The parents reported the length oftime that the children have spent in traf c environments without
Accidents per child 35 _ I I I I 0.30 025 E ., 020 : . i & 0.10: 0.05 j 0.00 ' Non-members Members
Fig. 3. Accident risk, accidents/child, accidents other than traffic
Children s road safety and the strategy of voluntary traf c safety clubs 467 - Non-members Members i
% 100 80; ...
60;,_._.
_ . f. 40~~ _ .. __ / Zojm ,/, ... /o"
A
A
Often Sometimes Seldom
(a) - Non-members VÄ Members i C l()()
60 ?
40 _
207
Fig. 4. Distribution of the children according to how often they are exposed to traf c without a grown-up, (a) as pedestrians (p <
0.05) and (b) when bicycling (p < 0.01).
the company ofa grown up. The nonmembers were found to spend a little more time on their own. The difference is signi cant, but small, for both pedestri-ans and cyclists (Fig. 4).
Traf c teaching and training
There is a difference between the number of children in each group who were given teaching and training. A larger number of members were given theoretical teaching (p < 0.001) as well as practical training as pedestrians (p < 0.001). No difference was found in practical bicycle training (Fig. 5).
The parents were also asked to report how many times they had trained the children in traf c. No signi cant difference was found in average number of times per child. The questions cover theoretical teaching and practical training as pedestrians as well as cyclists. i. Non-members Zi Members I
100_
80:
60]-
401-1-
20-Pedestrian Theory BicycleFig. 5. Percentage ofthe parents giving their children theoretical teaching (p < 0.001) and practical training as pedestrians (p <
0.001) and on bicycle (ns).
These results show that if only those children who are given training are compared, the member child receives less training than the nonmember child.
Use of safety equipment
The members use bicycle helmets and child re straints in cars more often. There is a considerable difference in helmet usage, but concerning the use of child restraints the difference is small. Almost everyone uses child restraints in both groups. No difference was found in the use of re ector tags (Fig. 6).
DISCUSSION
As mentioned in the introduction, several stud-ies have shown differences between members and
i. Non-members W Members J
100
80,
601.
0
Child restraints Re ector tags Bicycle helmets
Fig. 6. Percentage of children always or almost always using bicycle helmets (p < 0.05), child restraints in cars (p ( 0.01),
468 N. P. GREGERSEN and S. NOLEN
nonmembers with respect to socioeconomic circum-stances. The member parents are more highly edu-cated. and more of them live in their own houses.
A reasonable conclusion from such ndings is that members ought to have a lower accident risk than nonmembers, excluding the effects ofthe club. The assumption is also supported in this study by the results from accidents other than traf c accidents. In addition, the expectations from the club ought to be a reduction of the accident risk. which would lead to an even larger difference with the members having the lowest risk. However. this can be investigated only in an experimental study.
The results from this study point in a completely opposite direction. There are various results in the study. such as the use ofsafety equipment and num ber of parents teaching and training the children. supporting the hypothesis that safety effects are achieved by the traf c club. On the other hand. the results from the comparison of accident risk suggest that the most important effects are negative.
The expected pattern. i.e. a lower risk among members. was found for other accidents than traf
c accidents. however. the difference is not signi cant. lf this difference is true. it could probably be explained by the difference in their socioeconomic background. The difference could be interpreted as a basic level ofdifference between the groups. show-ing how accident prone they are in general. lf this is correct. an experimental study would show an even larger risk for the members in traf c. due to membership.
Certain other comparisons. not including acci dent risk. show safer behavior patterns in the mem ber group. The freedom of movement of the mem bers to walk or cycle in traf c alone is lower. The members also spend less time in traf c environ-ments. More of the members also receive traf c teaching and training from their parents. although on a smaller number of occasions per child. There is no difference in the amount of practical training on the bicycle. which could be explained by the fact that the club does not include any training in cycling. The difference in freedom of movement was
expected. since one of the aims of the club is to
give parents increased knowledge about children s limited capabilities in traf c. On the other hand. the opposite result might also be expected. Following the second aim of the club. the children should be
prepared for handling different traf c situations as
they grow up. The second expectation is probably
general for traf c education. Children will use their
increased ability in their general social deveIOpment
including needs for increased mobility. This is sup
ported by the ndings of Nummenmaa et al. (1975).
They found that the freedom of movement did in-crease as a result ofa teaching and training program. The conclusion is that the results show some safety effects of the club. however. not including
the most important aspect; traf c accident risk. The
obvious question is whether this is true and what the explanation in that case could be.
Several possible hypothetical explanations to why no reduced accident risk was found may be valid. These explanations are more or less probable if compared to the other results of the study. It is not possible to give any true answers from the study alone. but some of the results may be of help in estimating their probability. There may also be some methodological problems. which will be commented upon rst.
One possible methodological explanation for the results is that the member parents are more con-cerned about matters of children and traf c in gen-eral. and are therefore more aware of what is hap-pening to their children. This leads to a more sensitive interpretation of what is to be de ned as an accident. which leads to a higher tendency to report minor accidents. This sensitivity may also in uence their reports of traf c exposure or the amount of teaching and training.
This risk of overreporting accidents among members cannot be ignored. but if this should be the case. it should also be expected that a higher proportion of other. nontraf c accidents would be reported. This is not the case. since these results point in the opposite direction. with a tendency to-ward fewer "other accidents in the member group. Another methodological aspect of over- and underreporting is the consequences of differences between the nonresponse groups. The nonresponse share in the nonmember group is larger than that among members. Hypothetically. this could affect the results and conceal a real accident reducing ef-fect of the club. In this study. however, it is not very probable. since. ifthe nonresponse group were to change the results in the opposite direction. there would have to be very large differences between the nonresponse groups. If the nonresponse group among the members had reported no accidents at all and the nonresponse group among the nonmembers had reported a 200% higher risk than the response group. the results would still not change to the ad-vantage of the members. This kind of error may perhaps reduce the difference between the groups, but never change it to a signi cantly better accident-reducing effect among members.
One explanation for the unexpected results may be that parents in the member group overestimate the effect of the club, which leads to a greater
free-Children s road safety and the strategy of voluntary traf c safety clubs 469
dom of movement for the children in traf c or to a
higher degree of exposure. However, this
assump-tion is not supported by the results, since it was found that freedom and exposure are lower in the member group.
The overestimation of the skills of the children as road users may, however, also lead to a higher
degree of risk taking in traf c. It is not necessarily
a matter of quantity, but may be a qualitative aspect of exposure. This cannot be evaluated when measur-ing the number of hours in traf c, as was done in this study. In general, this type of qualitative differ-ence is very dif cult to detect in questionnaires. It is necessary to be there and to study the children s behavior.
Another explanation may be that the children s traf c environment differs between the groups. Nei-ther is this explanation supported by the results, since there were no differences in the proportion of car traf c in the children s immediate environment. Naturally, there may be differences, but in other aspects of the traf c environment not measured in this study.
A possible explanation may also be that mem-bership leads to less teaching and training than the children would have had if they had not become members, because the parents shift the responsibil-ity onto the club. The results may be interpreted this way, since each member child receives less training than a nonmember child. The results show that a similar number of training occasions are distributed over more member children compared to nonmem ber children.
CONCLUSIONS
Since these explanations are solely hypothetical and not tested in a controlled experiment, great care should be taken in drawing the conclusion that the effect of the club is negative. Even if several of the
results in this study point in that direction, it would
be a very drastic conclusion with serious
implica-tions, which cannot be drawn from a nonexperimen-tal study such as this.
The probability that there are such great meth-odological problems in the study that they hide a positive effect is, however, not very high. The differ-ences in socioeconomic background ought to re duce the risk in the member group, not increase it. The risk of nontraf c accidents supports this assumption.
Thus, the most reasonable conclusion from this study is that the club does not have any effect in reducing accident risk.
The results, however, have considerable ethical implications for future club activities in general and
for the planned experimental evaluation of the
Swed-ish club. The suggestion for the future is to avoid the planned experimental study, since one of the groups would include children who are persuaded to become members. If this leads to a higher accident risk, which might be the case, such an experiment must be classi ed as unethical. The results from the pilot study ought to be suf cient to start develop-ment of a new strategy for the children s traf c club. The dif cult question concerns the direction in which such a change should be made. What strategy should be chosen? This demands more theoretical
work and a deeper understanding of the effects
of different strategies in traf c safety teaching and training on skills, overestimation, and traf c behavior.
In general, the ndings are supported by several other studies of the effects of traf c safety measures. There are many other studies showing unexpected contradictory effects or zero effects of educational measures and other potentially good efforts, such as driver education, skid training, training programs for motorcycles, the use of antilock brakes, winter maintenance of roads, the use of studded tyres, etc. (Gregersen 1994; OECD 1990). The number of such studies supporting motivational theories, e.g. zero-risk theory (Näätänen and Summala 1976; Summala 1987) is large. These ndings ought to lead to greater care in the development of traf c safety measures such as voluntary traf c safety clubs. They also show the importance of evaluating new strategies for safety among children. It often happens that com-mon-sense expectations are found to be unjusti ed. The practical result of this study has been a revision of the Swedish Children s Traf c Club , but this has not yet been evaluated.
Acknowledgements This rersearch was supported by grants
from the National Society for Road Safety (NTF) in Sweden.
REFERENCES
Antaki, B. C.; Morris, P. E.; Flude, B. M. The
effective-ness of the Tufty Club in road safety education. Br.
J. Educ. Psychol. 56:363 365; 1986.
Bagley, C. The urban setting of juvenile pedestrian injur-ies: A study of behavioral ecology and social disadvan-tage. Accid. Anal. Prev. 24:673 678; 1992.
Berard-Andersen, K. Om barn, tra kk og oss voksne. Oslo: Institute of Transport Economics; 1985. Firth, D. E. The road safety aspects of the Tufty Club.
Report LR 604. Crowthorne, U.K.: Transport and
Road Research Laboratory (TRRL); 1973.
Gregersen, N. P. Systematic co-operation between traf c schools and parents in driver education, an experiment. Accid. Prev. Anal. 26:453 461; 1994.
Michon, J. A. Traf c education for young pedestrians: An introduction. Accid. Anal. Prev. 13:161 167; 1981.
470 N. P. GREGERSEN and S. NOLEN
Mohlen van der, H. Pedestrian ethology: Unobtrusive observations of child and adult road-crossing behavior in the framework of the development of a child pedes-trian training program. The Netherlands: University of Groningen; 1983.
Mohlen van der, H.; Rothengatter, J. A. Road safety edu-cation: The development, implementation and evalua-tion of road safety educaevalua-tion programs for children.
In: European Conference of Ministers of Transport and
Council of Europe, Road safety education for children and teenagers. Strasbourg; 1981.
NTF. BTK now and in the future (in Swedish). BTK-gruppen. Stockholm: National Society for Road Safety;
1986.
Nummenmaa, T.; Ruuhilehto, K.; Syvänen. M. Trach education programme for preschool aged children and children starting school. Report 17. Helsinki: Liiken neturva; 1975.
Näätänen, R.; Summala, H. Road user behaviour and traf c accidents. Amsterdam and New York: North Holland/American Elsevier; 1976.
OECD. Traffic safety of children. Paris: Road Transport Research; 1983.
OECD. Behavioural adaptation to changes in the road transport system. Paris: OECD: 1990.
Roberts, M. Appraisal ofexisting material aimed at teach-ing road safety. Report 3/83. Hawthorn. Victoria. Aus tralia: Road Safety and Traffic Authority: 1980.
Rothengatter, J. A. The in uence of instructional variables on the effectiveness of traf c education. Accid. Anal. Prev. 13:241 253; 1981.
Rothengatter, J. A. A behavioural approach to improving
traf c behaviour of young children. Ergonomics
27:147 160; 1984.
Rothengatter, J. A. Road safety education as accident countermeasure. In: Proceedings of the international
workshop Recent developments in road safety
re-search. The Hague: Institute for Road Safety Research
(SWOV); 1987.
Sandels,S. Children in Traf c. London: Elek Books Lim-ited; 1975.
Schioldborg, P. Children, traf c and traf c teaching. An analysis of the Children s Traf c Club (in Norwegian). Oslo: Dept of Psychology, University of Oslo; 1974. Summala, H. Young driver accidents: Risk taking or
fail-ure of skills? Alcohol, Drugs and Driving 3:79 89;
1987.
Vinje, M. P. Children as pedestrians: Abilities and limita-tions. Accid. Anal. Prev. 13:225 240; 1981.
West, R.; Sammons, P.; West, A. Effects of a traf c club on road safety knowledge and self-reported behaviour of young and their parents. Accid. Anal. Prev.
25:609 618; 1993.
Wilde. G. J. S. The theory of risk homeostasis: Implica-tions for safety and health. Risk Analysis. 2:209 258;
& Pergamon
Accid. Anal. and Prev., Vol. 26, No. 4, pp. 471 482, 1994 Copyright © 1994 Elsevier Science Ltd Printed in the USA. All rights reserved 0001-4575/94 $6.00 + .00
0001-4575(94)E0010-I
THE RELATIONSHIP BETWEEN TRUCK ACCIDENTS
AND GEOMETRIC DESIGN OF ROAD SECTIONS:
POISSON VERSUS NEGATIVE
BINOMIAL REGRESSIONS
SHAW-PIN MIAOU
Center for Transportation Analysis, Energy Division, Oak Ridge National Laboratory P.O. Box 2008, MS 6366, Building 5500A, Oak Ridge, TN 37831, U.S.A.
(Accepted 25 September 1993)
Abstract This paper evaluates the performance of Poisson and negative binomial (NB) regression models in establishing the relationship between truck accidents and geometric design of road sections. Three types of models are considered: Poisson regression, zero-in ated Poisson (ZIP) regression, and NB regression. Maximum likelihood (ML) method is used to estimate the unknown parameters of these models. Two other feasible estimators for estimating the dispersion parameter in the NB regression model are also examined: a moment estimator and a regression-based estimator. These models and estimators are evaluated based on their (i) estimated regression parameters, (ii) overall goodness-of t, (iii) estimated relative frequency of truck accident involvements across road sections, (iv) sensitivity to the inclusion of short road sections, and (v) estimated total number oftruck accident involvements. Data from the Highway Safety Information System are employed to examine the performance of these models in developing such relationships. The evaluation results suggest that the NB regression model estimated using the moment and regression based methods should be used with caution. Also, under the ML method, the estimated regression parameters from all three models are quite consistent and no particular model outperforms the other two models in terms of the estimated relative frequencies of truck accident involvements across road sections. It is recommended that the Poisson regression model be used as an intial model for developing the relationship. Ifthe overdispersion of accident data is found to be moderate or high, both the NB and ZIP regression models could be explored. Overall, the ZIP regression model appears to be a serious candidate model when data exhibit excess zeros, e.g. due to underreporting. However, the interpretation of the ZIP model can be dif cult.
Keywords Truck accidents, Geometric design, Poisson, Zero-in ated Poisson, Negative binomial
1. INTRODUCTION
The relationships between vehicle accidents and geometric design of road sections, such as horizontal curvature, vertical grade, lane width, and shoulder
width, have been studied using multiple linear re
gression models in numerous previous studies (Roy Jorgensen Associates, Inc. 1978; Zegeer et al. 1987; Okamoto and Koshi 1989; Zegeer et al. 1990). Be-cause the occurrences of vehicle accidents are typi-cally sporadic across the road network, in most vehi-cle accidents-geometric design studies the analysts are faced with a problem of dealing with a large number of road sections that had no reported acci dents during the observed period. For example, in a study by Zegeer et al. (1990), 55.7% of the road sections they studied had had no reported vehicle
471
accidents in a ve-year period, and in another study by Miaou and Lum (1993b), over 80% of the road sections had no reported truck accidents during a one-year period. This suggests that for a period of several years most of the road sections considered would have a high probability of being observed with no accidents. In other words, the underlying distribution of the occurrences of vehicle accidents on most of the road sections during the observed period is positively or rightly skewed. It has been demonstrated that the conventional multiple linear regression models. which rely on normal assump-tion, lack the distributional property necessary to describe adequately the random and discrete vehicle accident events on the road (Jovanis and Chang 1986; Saccomanno and Buyco 1988; Miaou and Lum 1993a). As a result, these linear regression models