Gone with the Wind
The economic impact of disruptions
A study of service and maintenance in the Swedish wind power market
Bachelor’s thesis within Business Administration Author: Nadja Duncker
Anneke Klötzer Kristofer Larsson Tutor: Mike Danilovic
Bachelor Thesis in Business Administration
Titel: GONE WITH THE WIND. The economic impact of disruptions: A
study of service and maintenance in the Swedish wind power market
Authors: Nadja Duncker, Anneke Klötzer, Kristofer Larsson
Tutor: Mike Danilovic
Date: May 2010
Keywords: Wind Power, Wind Turbines, Disruptions, Economic Impact,
Service and Maintenance, Maintenance Costs, Lack of Competition, Industry
Analysis
Abstract
The purpose of this thesis is to explore disruptions Swedish wind turbines onshore are exposed to, and to estimate their economic impacts on the operators. We want to investigate whether there is a need for a more developed service and maintenance market within the Swedish wind power market.
This study focuses on wind power, a renewable energy source in an emerging market, which experiences exponential growth. Sweden is a minor actor in the wind power market with a production of around 2 TWh yearly. The government aims at a total production of 10TWh in 2015 and 20TWh in 2020, which equals an annual growth of 24%. However, we hypothesize that the Swedish wind power market is negatively affected by a service and maintenance market which is underdeveloped due to a lack of competition. This results in lengthy repair times and disproportionate costs for wind power operators.
The study was carried out by conducting semi-structured qualitative interviews and by sending out a survey to approximately 300 wind power operators. Six interviewees were wind power operators and one interviewee was a representative from an independent service supplier. We have also analysed the current cost situation of operators with theories about maintenance costs and we have also carried out an industry analysis on the service and maintenance market, which was based on Porter’s structural industry analysis.
After conducting a structural analysis of the service and maintenance market, we can conclude a lack of competition today as there is a dominance of the wind turbine manufacturers as the service supplier. Furthermore we can see that this lack of competition has negative effects on the efficiency of the service and maintenance provided. The results also stress a need for a more developed service and maintenance market. We have found that the profitability for the Swedish wind power operators is challenged if the service and maintenance market is not keeping pace and meeting the demands of the rapidly growing Swedish wind power market as a whole.
Acknowledgements
We would like to begin by thanking Mike Danilovic who has been a helpful, available and supportive tutor throughout the creation of this thesis.
Further we would like to thank Örjan Hedblom, chairman of Svensk Vindkraftförening, and Gunnar Fredriksson, vice CEO of Svensk Vindenergi, for giving us feedback on our survey and aiding us in sending it out to their members. We would subsequently like to thank all responding operators who took the time to fill in the numbers and comments required, adding valuable information to our research.
We would also like to thank the representatives of Vattenfall, Stena Renewable AB, E.ON, Nordisk Vindkraft, Göteborgs Energi and the service and maintenance company for their participation in interviews.
__________________ __________________ __________________
Table of Contents
Abstract ... 3
List of Definitions ... 8
Thesis Disposition ... 9
1
Introduction ... 10
1.1 Service and maintenance - a problem for the growing wind power market? ... 10
1.2 Purpose and Research Questions ... 11
1.3 Background ... 12
1.3.1 History of Wind Power ... 12
1.3.2 How exactly does wind become energy? ... 13
1.3.3 Onshore vs. Offshore ... 13
1.4 Wind Power from a global perspective ... 14
1.4.1 Global Market ... 14
1.4.2 European Market ... 15
1.5 Wind Power in Sweden... 16
1.5.1 The Market ... 16
1.5.2 Actors in the Industry ... 17
1.5.3 Support system: Green Certificate ... 17
1.5.4 Service/Maintenance Market ... 18
2
Methodology ... 19
2.1 Research Approach ... 19
2.1.1 Inductive and deductive research ... 19
2.2 Data Collection ... 19
2.2.1 Qualitative and quantitative research ... 19
2.2.2 Primary and secondary data ... 20
2.3 Survey ... 20
2.3.1 General structure ... 20
2.3.2 Questions ... 21
2.3.3 Distribution ... 21
2.4 Interviews ... 22
2.5 Samples and selection... 23
2.6 Data Analysis ... 23
2.6.1 Analysis ... 23
2.7 Data Quality ... 24
2.7.1 Data Quality and data trustworthiness ... 24
2.7.2 Validity and reliability... 24
2.7.3 Generalizability ... 25
3
Frame of Reference ... 26
3.1 Life cycle costs ... 26
3.1.1 Challenges when implementing LCC ... 26
3.2 Generating costs of wind turbines ... 27
3.3 Maintenance ... 27
3.3.1 Reactive Maintenance... 28
3.3.3 Corrective Maintenance ... 28
3.4 Maintenance Costs ... 28
3.5 The Impact of Maintenance ... 28
3.6 The Structural Analysis of Industries ... 30
3.6.1 The five competitive forces ... 31
4
Empirical findings ... 33
4.1 Operator Interviews ... 34
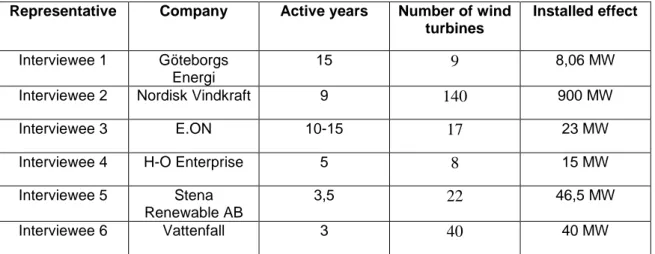
4.1.1 Size and experience... 34
4.1.2 Costs, disruptions and downtime ... 34
4.1.3 Service and Maintenance ... 36
4.1.4 Future of service and maintenance market ... 39
4.2 Interview: Independent Service Company ... 40
4.2.1 Disruption and downtime ... 40
4.2.2 The service and maintenance market ... 41
4.3 Survey ... 41
4.3.1 Presentation of Operators ... 41
4.3.2 Organization of service and maintenance ... 42
4.3.3 Operators with fixed service and maintenance agreement 44 4.3.4 Operators with non-fixed maintenance agreement ... 45
4.3.5 Direct Service and maintenance cost ... 45
4.3.6 Average number of disruptions ... 47
4.3.7 Length of downtime ... 48
4.3.8 Electricity Production Loss ... 49
4.3.9 Electricity production loss in SEK (Indirect costs) ... 50
4.3.10Economic Impact for the operator ... 50
4.3.11Customer satisfaction... 51
4.3.12Future of the Service and Maintenance Market ... 52
4.3.13Survey Comments ... 53
5
Analysis ... 56
5.1 The current cost situation for wind power operators ... 56
5.1.1 Economic impact of direct and indirect costs ... 56
5.1.2 Factors affecting downtime ... 57
5.1.3 Need for a more developed service and maintenance market... 58
5.2 Structural analysis of the service and maintenance market ... 58
5.2.1 Bargaining power of Buyers ... 59
5.2.2 Bargaining power of Suppliers ... 60
5.2.3 Threat of new entrants ... 61
5.2.4 Threat of substitutes... 62
5.2.5 The degree of rivalry among existing competitors ... 63
6
Conclusion and discussion ... 64
6.1.1 Exploring disruptions Swedish wind turbines onshore are exposed to ... 64
6.1.2 Estimation of the economic impact ... 64
6.1.3 Need for a more developed market ... 65
6.1.4 Challenges for the market ... 65
6.1.6 Suggestions for future research ... 67
7
List of References ... 68
8
Appendix 1: Interview Matrix ... 72
9
Appendix 2: Interview Service Company ... 75
10
Appendix 3: Letter to Survey receipients ... 77
11
Appendix 4: Survey ... 78
Figure 1-1 Installed effect of wind power in Sweden between 1997 and 2009 (The Windpower, 2010b) ... 10
Figure 1-2 Wind Turbine Structure (Amirat, Benbouzid, Al-Ahmar, Bensaker & Turri, 2009). ... 13
Figure 1-3 Installed effect in Sweden, onshore versus offshore in MW, based on Vindkraftsstatistik (2009) ... 14
Figure 1-4 Worldwide growth of installed wind power effect in MW (Thresher, Robinson & Veers, 2007). ... 15
Figure 1-5 The European map of wind farms (www.thewindpower.net) ... 16
Figure 4-1 Distribution of wind turbines with respect to installed effect and age. ... 41
Figure 4-2 Average installed effect per wind turbine (kW) in terms of their age and warranty. ... 42
Figure 4-3 Distribution of answers when asked how the operators organize service and maintenance. (Vertically = no of operators). ... 43
Figure 4-4 This graph shows the distribution (in percentage) of how operators, who have signed a fixed service agreement, organise service and maintenance. ... 44
Figure 4-5 This graph shows the distribution (in percentage) of how operators, who also have filled in the option “non- fixed service agreement” for any of their wind turbines. ... 45
Figure 4-6 Maintenance cost per actual produced MWh ( SEK) for 2007-2009. ... 46
Figure 4-7 Average number of disruptions per wind turbine. ... 47
Figure 4-8 Average length of downtime per wind turbine in days. ... 48
Figure 4-9 Average Electricity Production Loss per wind turbine in MWh. ... 49
Figure 4-10 Average customer satisfaction with service supplier. ... 52
Figure 4-11 Average customer satisfaction regarding 5 aspects of service and maintenance. ... 52
Figure 4-12 Average importance of a more developed service and maintenance market by operators. ... 53
Figure 5-1 The five forces driving industry competition in the service and maintenance market. Based on Porter (1980)... 59
List of Definitions
Swedish English Explanation
Service/underhåll Service/maintenance Planned and budgeted repairs, service and maintenance.
Driftstörningar Disruptions Unplanned and unbudgeted disruptions.
Fast serviceavtal Fixed service agreement
This term means that a fixed sum of money is paid yearly by the operator to an external service company for service and maintenance and repairs that were agreed on in the contract.
Inget serviceavtal No fixed service agreement
The operator deals with service, maintenance and repairs as they occur and pays thereafter.
MWh MWh This is the frequently used unit of electric
energy production when referring to yearly production.
kWh kWh This unit of energy is used when referring
to yearly electricity production loss.
MW MW This unit of power is used when defining
wind turbine effect.
Stilltid Downtime The time a wind turbine is still, not producing electricity, due to disruptions not wind conditions.
Ledtid Lead time The time it takes for spare parts to be delivered and technicians to reach wind turbines at disruptions.
Elproduktionsbortfall Electricity production loss
During downtime caused by disruptions of any kind, the wind turbine will not produce any electricity. The amount of production lost due to this circumstance is referred to as electricity production loss.
Thesis Disposition
Introduction
Methodology
Frame of reference
• Background of the topic and problem presentation
• Purpose and research questions
Discussion
Empirical findings
Analysis
Conclusion
• Presentation of the thesis’ research approach • How the research was conducted
• Theories and models used to analyze empirical findings with the use of our frame of reference
• Presentation and interpretation of the interviews and the survey findings
• Interpretation and analysis of empirical findings with the use of our frame of reference
• Conclusions based on our findings and analysis structured by purpose and research questions
• Future projections and trends
1 Introduction
This section begins with an introduction to the research problem and the hypothesis, continues to purpose and research question and ends with an in-depth background towards wind power.
1.1
Service and maintenance - a problem for the growing wind power
market?
The wind power industry in Sweden has grown extensively during the recent years. The figure below shows the growth of installed effect of wind power in Sweden in MW (megawatt).
Figure 1-1 Installed effect of wind power in Sweden between 1997 and 2009 (The Windpower, 2010b)
This figure emphasizes clearly that the growth of Swedish installed effect is exponential, which becomes particularly evident when looking at the last few years. In 2005 the installed effect was around 500MW, compared to 2009’s 1500MW. Here one can observe that installed capacity has tripled in only 5 years. The exponential growth of installed effect simultaneously entails the growth of the entire Swedish wind power market. If the demand for wind power capacity grows, demand for related industries will grow as well. Hence, industries, such as the wind power related service and maintenance industry, will most probably experience a similar increase in demand.
The Swedish wind power market is dominated by two wind turbine manufacturers; Vestas and Enercon. In 2009, Vestas controlled a 50% share of the market and Enercon came second with approximately one third of the market (Karlberg&Hållén, 2010). Together these two companies accounted for over 80% of the total wind power market, revealing a clear market dominance and a possible lack of competition. These large wind turbine manufacturers are also suppliers of service and maintenance for their wind turbines. According to Nils Naumburg the large wind turbine manufacturers in the North of Europe are spoiled, especially Vestas (Hållén, 2008).
A growing market also leads to new challenges. In 2008, Ny Teknik, a Swedish technology and IT weekly newspaper, published an article about challenges in the growing wind power market revealing that several insurance companies had left the Swedish wind power market and refused to insure wind turbines due to the high costs related with disruptions. In this article, Nils Naumburg from the insurance company IF, describes the wind power industry as immature as it focuses on selling more and building bigger wind turbines, whereas the service and maintenance market does not receive enough attention (Hållén, 2008). If wind turbines are not insured serious disruptions can cost millions. This amount is a combination of the repair costs as well as the electricity production loss the wind turbine operator faces due to downtime.
Presuming the wind power market will continue to grow exponentially in the future, will the service and maintenance market be able to keep up with the growth? If the service and maintenance market does not keep pace, will that have a negative effect on the whole industry? If disruptions cannot be repaired because of an underdeveloped service and maintenance market, wind turbines cannot produce electricity which results in losses for the operator. The most negative imaginative scenario could be that potential investors cease to invest in wind power which would decelerate the growth that it is experiencing today. Hence in order to ensure a stable and robust future growth of wind power, it is important to put focus on the development of the service and maintenance market.
Our hypothesis is that the wind power service and maintenance market in Sweden is underdeveloped due to a lack of competition and that this underdevelopment results in lengthy repair times and disproportionate costs for wind power operators.
1.2
Purpose and Research Questions
The purpose of this thesis is to explore disruptions Swedish wind turbines onshore are exposed to, and to estimate their economic impacts on the operators. We want to investigate whether there is a need for a more developed service and maintenance market within the Swedish wind power market.
In order to answer our purpose we have chosen to analyse the current market structure of the service and maintenance market for wind turbines. This analysis will be done in order to see if the service and maintenance market is working efficiently or if it is not working efficiently and in that case why. The purpose is investigated by the following research questions.
1. What are the most frequent disruptions wind turbines in Sweden are exposed to? 2. Which factors influence downtime?
3. What are the costs for maintenance and repair services of wind turbines? 4. How large is the operator’s economic impact from disruptions?
5. How content are the operators with their present service and maintenance suppliers? 6. How large is the fraction of wind turbine operators who have signed a service
agreement with their manufacturer?
7. What challenges are there in the service and maintenance market?
The questions are examining the different aspects of our purpose. The first two research questions are exploring the disruptions and the related downtime. Questions three and four were created in order to estimate the economic impacts of these disruptions. The last three research questions are investigating if there is a need for a more developed service and
maintenance market within the Swedish wind power market. The sixth question is examining if manufacturers of wind turbines have a large market share of the service and maintenance market because our hypothesis is that the wind power service and maintenance market in Sweden is underdeveloped due to a lack of competition and that this underdevelopment results in lengthy repair times and disproportionate costs for wind power operators.
1.3
Background
1.3.1 History of Wind Power
The windmill is as genius as it is old. Historically used primarily for grinding wheat into flower or pumping water for crops, the ability to transform wind into pure electricity without polluting the environment is as close as one can get to a renewable energy source (Svensk Vindkraftförening, 2010). Since the first windmill was used for generating electricity, the development of the technology has continued. Despite the environmental benefits, there are still limitations with wind power for instance the high service and maintenance costs and that wind conditions have to be optimal to generate energy. In order to produce electricity, the wind has to blow between 4-25 m/s (Svensk Vindkraftförening, 2010). Exact forecasts for wind power production are difficult as wind is irregular in its nature (Elforsk, 2008a). However, usually one would expect the wind to blow enough for a wind turbine to produce electricity approximately 80% of the time, explicitly 6000 hours of a full year’s 8760 hours (Svensk Vindkraftförening, 2010).
In the European Union, Sweden is one of the leading countries in generating electricity from renewable sources, although the main part is produced by hydroelectricity. Despite of being an attractive market for wind power, Sweden was one of the latter countries installing wind power. This was mostly due to limited political commitment as well as the requirements concerning new wind power installations (Svensk Vindkraftförening, 2010). Consequently, Sweden is today dependent on the technical knowledge of countries that started to develop wind power earlier and these include primarily Denmark and Germany (Sveriges Energiföreningars Riksorganisation, 2007). However, since the 1980’s, wind power has experienced a quite fast development even in Sweden, with its size doubling every four years (Svensk Vindkraftförening, 2010). Above all, this extreme growth is a result of the growing electricity prices in Sweden which have let both power producing companies, as well as the industry and real-estate concerns, to massively invest in new wind turbines (Sveriges Energiföreningars Riksorganisation, 2007).
The extreme growth of today’s wind power market triggers a number of challenges. According to Energimyndigheten (Swedish Ministry of Energy), there are several factors that have to be developed in order to keep wind power being profitable. These include a faster permission process, higher governmental support through the green certificate (for more detailed information, see below) as well as more support to offshore parks (Elforsk, 2008c). Nils Naumburg (IF försäkringar) compares today’s wind power market to the IT industry 10 years ago claiming that wind power is an immature market where the actors focus on selling more and building bigger instead of concentrating on service and maintenance (Hållén, 2008). The service and maintenance market is facing a hard time catching up with the extreme growth of wind power in Sweden and this is felt by the wind power operators (Appendix 1).
1.3.2 How exactly does wind become energy?
In order to produce electricity, wind turbines use their blades to capture energy from the wind. When the wind touches the blades, positive pressure is created on the front of it and negative pressure behind it which makes the rotor turn. Wind turbines normally generate electricity at a wind speed range of 4-25m/s, which is then led through a transformer to the grid which eventually brings the electrical output to the consumers (Svensk Vindkraftförening, 2010). In just 2-3 hours, a Vestas wind turbine with a V90-3.0 MW turbine can produce enough power to cover the annual electricity consumption of an average European household (Vestas, 2010).
Figure 1-2 Wind Turbine Structure (Amirat, Benbouzid, Al-Ahmar, Bensaker & Turri, 2009). 1.3.3 Onshore vs. Offshore
This study will only measure the costs of onshore wind turbines due to several reasons which are explained in detail in the methodology section. Once installed, wind power should be cheap. As wind is for free, wind turbine operators do not have to pay for it. Regarding the costs of an onshore wind turbine, wind generation costs per MWh range from EUR 50 to EUR 90 including service and maintenance costs, which can be quite substantial. By 2050, Investment costs are expected to be 23% lower than today as a consequence of technology development, deployment and economies of scale (International Energy Agency, 2009). Aside from the traditional onshore wind turbines, there are high expectations in offshore wind turbines as the wind offshore is stronger. This implies that wind turbines do not have to be as high offshore as they are onshore in order to capture the wind. However, offshore costs can be double of onshore costs as maintenance costs are a lot higher. This is because offshore wind turbines are more difficult to reach and thus need a lot of special equipment such as boats and cranes. However, by 2050 offshore costs are expected to have been decreased by 38% due to new technologies (Global Wind Energy Council, 2010). According to the International Energy Agency, the quality of offshore resources is approximately 50% better. Moreover, regarding offshore wind turbine, Sweden is one of the major players in the
global market with a capacity of 133MW (International Energy Agency, 2009). This can be seen in figure 1-3.
Figure 1-3 Installed effect in Sweden, onshore versus offshore in MW, based on Vindkraftsstatistik (2009)
This figure shows that installed effect and growth of onshore wind turbines is higher than the respective for offshore. Hence it makes sense to investigate only onshore wind turbines.
1.4
Wind Power from a global perspective
1.4.1 Global Market
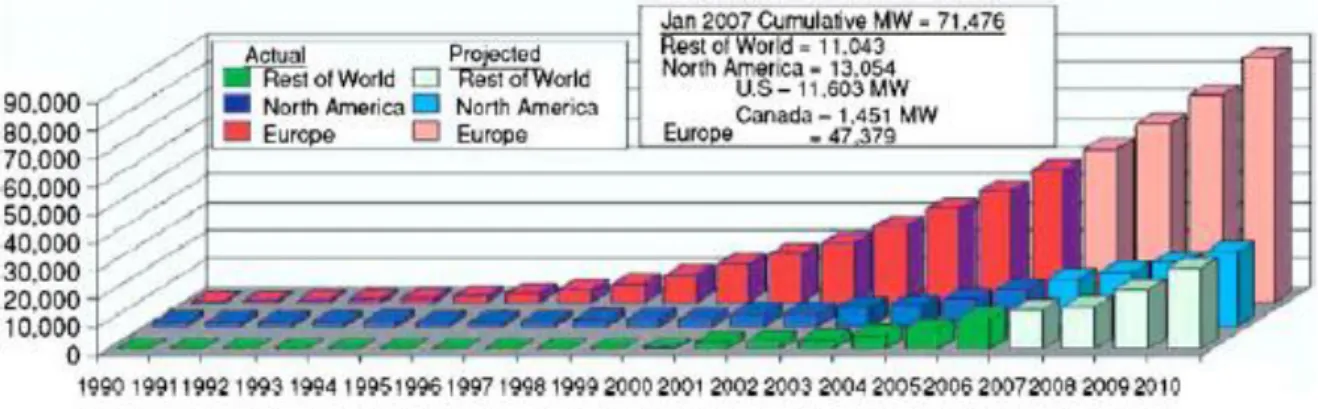
In today’s energy market, wind power represents the most advanced renewable energy technology although there is still a lot that has to be improved and developed in order to make wind more profitable (International Energy Agency, 2009). The wind power market is experiencing an exponential growth and it is in fact the fastest growing energy generating technology with an annual average growth rate of 27.6% for the past five years (BTM Consult, 2010). In 2009, total wind power installed effect grew by 31% resulting in a total of 157.9 GW of installations around the globe (The European Wind Energy Association, 2010b). The most investments were made in Asia, North America and Europe, with China having the largest market potential and doubling their capacity from 12.1 GW in 2008 to 25.1 GW in 2009 (The European Wind Energy Association, 2010b). Figure 1 shows the development of the global wind power market.
0,0 200,0 400,0 600,0 800,0 1000,0 1200,0 1400,0 2007 2008 2009 Onshore Offshore
Figure 1-4 Worldwide growth of installed wind power effect in MW (Thresher, Robinson & Veers, 2007). 1.4.2 European Market
The European Union is one of the major investors in wind power and it has experienced an annual average growth rate of 23% for the past 15 years (The European Wind Energy Association, 2010a). Its total share of total installed energy capacity has increased from 2% in 2000 to 9% in 2009. In 2009 a total of 10,163MW wind power was installed in the EU, adding up to a total of 74,767 MW. 2009 is the second successive year that more energy capacity was installed in wind power than any other energy source, with 39% of all energy capacity produced being wind power and 35% in 2008 respectively (The European Wind Energy Association, 2010a). In total, renewable energies accounted for 61% of all new energy capacity, which includes solar photovoltaic (16%) and gas (26%). The target of the EU for 2020 is to increase the renewable energy supply up to 20% and wind power is expected to account for around 12-14% of those 20% (The European Wind Energy Association, 2010a).
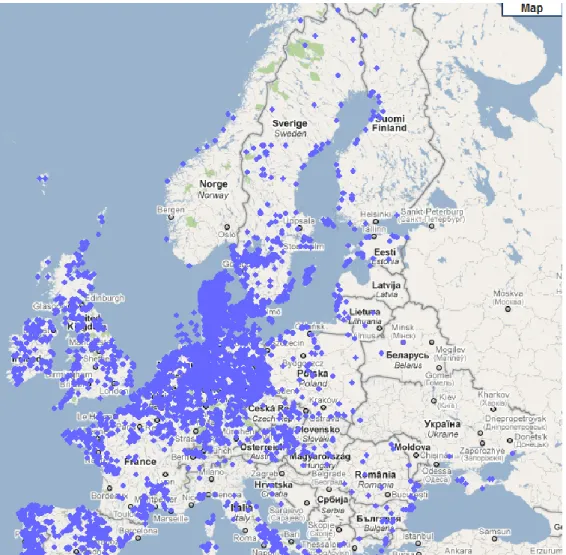
The leading EU country in wind power is Germany with a total of almost 26 GW of installed wind power capacity in 2009 followed by Spain, Italy, France and the UK. Thriving markets exist where the deployment conditions are right (International Energy Agency, 2009) and one of the most successful examples is Denmark. The figure below (1-4) shows the distribution of installed wind power in Europe. Here one can clearly detect the majority of wind power to be situated in Germany and Denmark.
Figure 1-5 The European map of wind farms (www.thewindpower.net)
Today almost 20% of the energy produced in Denmark consists of wind power (Ministry of Foreign Affairs of Denmark, 2009). Even though Sweden is a very attractive market for wind power it remains quite a small player compared to other European countries with a total installed capacity of 1560 MW in 2009 (The European Wind Energy Association, 2010a). This can also be seen in the figure 1-4. The market is very attractive mainly because of good wind resources and the small population spread over the large country which creates space for wind turbines.
1.5
Wind Power in Sweden
1.5.1 The Market
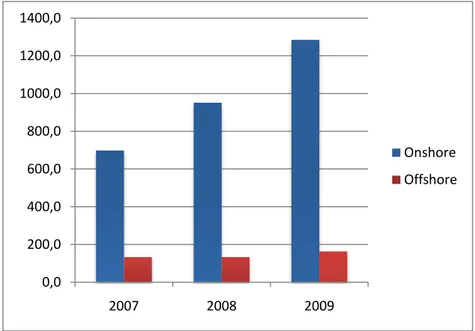
In 2009, Sweden’s onshore installed effect was 1285 MW compared to 2008’s 952 MW and 2007’s 699 MW, this can be seen in figure 1-4 (Vindkraftsstatistik, 2009). According to the Swedish Wind Energy Association, Sweden has the potential of producing 540TWh/year but in 2008 it only produced 2TWh which represents approximately 1.5% of Sweden’s total energy consumption (The European Wind Energy Association, 2010). Regarding the EU targets for 2020, Sweden is supposed to supply 49% of its electricity with renewable energy. In order to achieve this target, Sweden will be forced to increase its wind capacity to 20TWh and this requires a more rapid permitting process, the disappearance of the extensive appeals process as well as a new grid construction (The European Wind Energy Association, 2010).
The Swedish government even has its personal target of producing 25TWh by 2020 and in order to be able to achieve this, it has launched the so called green certificate support system (section 1.5.3). This will intentionally provide renewable energy producers, such as wind turbine operators; with support for every MWh they produce (Global Wind Energy Council, 2010).
1.5.2 Actors in the Industry
The distribution of actors in the wind power market is completely different from the rest of the energy market where there is usually a limited number of very dominant actors who represent a large market share. Wind power is more open for small actors such as private persons or small businesses than most of the other energy sources. These independent power producers mainly invest in wind power for their own consumption. Factors that simplify the engagement in wind power for small firms include for instance that the ―fuel‖ (wind) is free of charge as well as that electricity can be produced much closer to the user than many other forms of energy. Yet recently, as wind power has become more important and has gained more attention the big energy companies have started to play a more fundamental role (Vinnova, 2009).
Vattenfall is the biggest actor and investor in the Scandinavian wind power market. Other firms who play an active role within the Swedish wind power market are Göteborg Energi, Skellefteå Kraft AB, Jämtkraft AB and Falkenberg Energi AB (Vinnova, 2009). Further substantial operators are Stena Renewable Energy, O2 Vindkompaniet and Global Green Energy (Global Wind Energy Council, 2010).
Today, even though wind turbine assembling occurs in Sweden, there are no Swedish wind turbine manufacturers. However, there are several Swedish companies such as ABB and SKF which produce and export a variety of components, like main shafts, generators, towers and bearings. Several foreign wind turbine manufactures like Vestas, Enercon and Siemens have entered the Swedish market (Global Wind Energy Council, 2010).
1.5.3 Support system: Green Certificate
With the purpose to increase the production of renewable energy in a cost-effective way, the Swedish government introduced the so-called green certificate (elcertifikat) in 2003. The general objective is to raise renewable energy up to 25 TW in 2020 and at the same time to increase its competitiveness against other energy sources. The support system is a market based system that forces trade between renewable energy producers and other parties obligated to allocate by quota. These parties include electricity suppliers, electricity-intensive industry as well as end-users that produce their own electricity, import it or buy on the Nord Pool market place (Energimyndigheten, 2009b).
For every MWh of renewable energy produced, the operator receives a certificate (Global Wind Energy Council, 2010), which are then sold to electricity suppliers depending on how much electricity they sell. Through the sales of certificates the producers receive extra income which makes it more profitable to produce renewable energy (Energimyndigheten, 2009b). Producers receive certificates for a maximum of 15 years for every new installed capacity, but only until 2030 (Global Wind Energy Council, 2010). The extra income from the certificate sales represents a substitute to former investment grants from the government (Energimyndigheten, 2010a). According to Kent Eriksson from Nordisk Vindkraft (Appendix 1), wind power producers earn a subsidy of around 100% due to the green certificate.
1.5.4 Service/Maintenance Market
After the warranty expires, wind turbine operators have three different choices how to organize their maintenance (Elforsk, 2009b):
I. Buy service and maintenance from the wind turbine manufacturer through fixed or running agreements
II. Outsource service and maintenance to another supplier of service and maintenance than the wind turbine manufacturer
III. Keeping service and maintenance in the own company
However, according to CEO of H-O enterprise AB (Appendix 1) there is a strong dominance of Enercon and Vestas (large wind turbine manufacturers) on the Swedish wind power market regarding service and maintenance. That means that small wind power operators usually have no other choice than to buy service and maintenance from either of those two companies. He also highlights his opinion that Enercon and Vestas use their market power in order to control the prices of service and maintenance as they have doubled their agreement prices in the last five years. There are only few competitors in the service and maintenance market like Triventus Energiteknik AB or Engy Airtech AB.
We therefore see a lack of competition in the Swedish service and maintenance market. Thus our hypothesis is that the service and maintenance market within the Swedish wind power market is underdeveloped with a lack of competition and that this underdevelopment results in lengthy repair times and disproportionate costs for service and maintenance for the wind power operators.
2 Methodology
In this section, we will explain the methods we used in order to carry out a study of high quality.
2.1
Research Approach
2.1.1 Inductive and deductive research
When conducting research there are two different main approaches which can be used; inductive and deductive research.
Deductive research is an approach where the researcher tests a theoretical structure by empirical observation; consequently particular examples are deduced from general theory (Collis & Hussey, 2003). In this research approach, the researcher tests the theory (Dan, 2008). Another research approach is the inductive approach. In this approach the researcher starts with a particular case and the theory is concluded from the observation of the empirical data, thus general theory is induced from particular cases (Collis & Hussey, 2003). In summary a deductive approach starts with the general theory and tests it on a specific observation and an inductive approach starts with a specific observation and attempts to draw general conclusions.
This thesis is built upon an inductive approach as general statements are concluded from the research carried out. The frame of reference was chosen after observations of the specific case of Swedish wind turbine operators. This frame of reference was chosen in order to help us to analyze and understand the findings of our study and then be able to draw conclusions from the specific cases examined. An inductive approach was chosen because the Swedish wind power market is young and not that much research has been carried out in this area yet.
2.2
Data Collection
2.2.1 Qualitative and quantitative research
Data can be collected through qualitative and/or quantitative research. Quantitative research aims to quantify data. The questions posed in this research method request responses that can be measured in some way. Quantitative studies focus on making a generalization, which results in a representative summary of the chosen populations (Hague, 2006). Qualitative research is used in order to find out information about the way people think and behave, as well as to recognize patterns in those thoughts and behaviors. Qualitative studies also employ open-ended questions in order to gather information (Hague, 2006).
In our study we carried out both qualitative as well as quantitative research in order to exploit the advantages of both research approaches. The quantitative approach was chosen in order to estimate the economic impact of disruptions; however we also wanted to receive more in-depth understanding of how operators think about the market in order to recognize patterns in their opinions and perceptions. This was necessary in order to see if the wind turbine operators see a need for a more developed service and maintenance market. The qualitative approach was necessary especially to answer our fifth and seventh research questions.
A survey was used to gather quantitative primary data and six interviews with operators as well as one interview with an independent service and maintenance company were conducted to gather qualitative data.
2.2.2 Primary and secondary data
Data collected can be either primary or secondary. Primary data is obtained directly from the source, for instance through surveys or interviews. This type of data is collected in order to answer the specific purpose of the study carried out (Collis & Hussey, 2003). In contrast, secondary data already exists in various forms of reports or books, which was previously collected for other studies (Collis & Hussey, 2003). Since this data was collected for another purpose it might be difficult to find appropriate secondary data. However, secondary data can be useful by displaying the different viewpoints and findings of previous researchers (Walliman, 2001).
Primary as well as secondary data was collected in order to answer our purpose. Our primary data stems from survey results and interview answers, giving us the opportunity to collect data directly from the source. The secondary data was used in the form of background information about the Swedish as well as the global wind power market. Secondary data was also collected for the frame of reference, which was utilized to explain and analyse the Swedish wind power service and maintenance market.
2.3
Survey
The survey mainly represents the quantitative primary data collection, but it also contains qualitative elements. A survey is the gathering of standardized data from a specific population, or a sample from one. The purpose of a survey is normally to create generalized statistics (Robson, 1993). There are two different types of surveys commonly used in research, descriptive surveys and explanatory surveys. A descriptive survey’s main objective is to gather information, list and describe the data collected. Explanatory surveys on the other hand try to discover and measure correlations of variables and links between them (Williamson, 2002).
Our survey is mainly explanatory but with descriptive elements. We focused on asking for data which would help us to estimate costs and discover correlations and links between them, which is why the survey is mainly explanatory. We for instance wanted to compare the development of numbers of disruptions to the development of downtime. The explanatory part of the survey was thus needed in order to answer research questions two, three and four. The descriptive part of the survey is used in order to gather a background knowledge and understanding about our sample and to show the opinions of wind power operators, that is if they are content with the present service and maintenance supplier. This information was important in order to answer research questions five and seventh.
2.3.1 General structure
The length, appearance, style and how the questions are formulated and presented are crucial aspects to consider when creating a survey as this will affect both the response rate and the quality of the answers (Bourque & Fielder, 2003). We emphasized much on these issues, changing the survey’s questions and its outline numerous times. The final structure of the survey was formed after several rounds of feedback from representatives of wind power associations as well as wind power operators. This feedback was important in order to
formulate and structure the questions correctly. Throughout the survey construction, we sought to utilise well-known terms within the Swedish wind power industry.
2.3.2 Questions
The first questions concerned the size of the operator in terms of number of wind turbines, installed effect, electricity production as well as active years on the market. We distinguished between expected and actual electricity production. Most questions were asked with respect to a time span of three years, from 2007-2009. A time span of the last three years was chosen in order to see trends and correlations between the different variables. The following questions asked whether the operator has signed a service agreement with his manufacturer or if he outsources service to an independent service supplier. These questions where included to answer our sixth research questions and also in order to see if the fraction of wind turbine operators who have signed a service agreement with their manufactures has changed during the last years.
The survey continued with questions about disruptions that occurred during the last three years. The questions asked concerned the number of disruptions, the related downtime in days and the resulted electricity production loss. These questions were asked in order to answer research question two, three and four.
The next questions concerned customer satisfaction regarding the general service and maintenance as well as specific aspects such as satisfaction with lead times, delivery times of spare parts and service personnel. The last part of the survey contained questions regarding the development of the service and maintenance market and the importance of such a development. The section about customer satisfaction and the development of the service and maintenance market was included in order to answer research question five and seven.
In the end of the survey, the operators were given the opportunity to write down individual comments. We wanted to give the operators the chance to express freely if they had anything to add or if they had special experiences in the market they wanted to share. 2.3.3 Distribution
The survey was sent out in two sets to members who were identified operators by two different wind power associations, Svensk Vindenergi and Svensk Vindkraftförening. The survey was sent out electronically to the members of Svensk Vindenergi mostly due to practical reasons. The reasons include that email surveys usually have a fast response time; the probability of a more honest response increases compared to telephone surveys and response rates are also higher than for postal surveys (Williamson, 2002). The electronic survey was sent out by the vice CEO of Svensk Vindenergi to demonstrate the importance of the study and create trust and in this way higher the response rate from the members.
Secondly, the survey was sent out to members of Svensk Vindkraftförening (SVIF) who were wind power operators, but by mail instead of e-mail, as it was impossible to retrieve the email addresses of all members. The addresses for all the operators were provided by the head of SVIF. In order to increase the response rate, a letter was sent out together with the survey to inform the members about the study.
2.4
Interviews
The primary reason for conducting interviews was to obtain qualitative data in order to answer our research questions. According to Kvale (King, 2004) a qualitative research interview is “an interview whose purpose is to gather descriptions of the life-world of the interviewee with respect to interpretation of the described phenomena”. We chose to conduct six interviews with wind power operators of different sizes and one interview with an independent service company active in the service and maintenance market.
The operator interviews were made in order to supplement the information we received from the survey with more qualitative aspects and the interview with the independent service company was conducted because we wanted to compare their perception of the market with those of the wind power operators. We took this decision after having established contacts with Vattenfall and H-O Enterprises, who gave us a different and more in-depth perception of the market. Hereafter we let them participate in interviews and thereafter also made a list of other suitable companies to interview who we thought would provide us with additional valuable information about the market. These interviewees were mainly chosen so that they differed in their size as well as the time they had been active on the market. This choice was made in order to see if there would be a different perception of the service and maintenance market influenced by the size or the years of activity in the market.
When contacting the operators, we firstly contacted the CEO’s of the companies and we asked for the employee that would be best suited for answering questions regarding service and maintenance and adherent costs. This approach had varying results regarding the contact information we received. Depending on the size and the organizational structure of the wind power operator we were directed to both senior officials such as owners and CEOs, as well as managers of the service and maintenance departments.
A semi-structured interview has the advantage of allowing a more open discussion of the questions rather than directing or limiting the answers of the interviewee (Saunders, Lewis & Thornhill, 2009). Our interviews followed an ordered structure, yet simultaneously allowed side-topic discussions as well as jumping between questions. We chose to conduct semi-structured interviews in order to not miss out on important information that we might have missed out when using a more strict structure.
The interview questions for operators were divided into four groups. The first group concerned the size of the operator and the time span in which the operator has been active in the market. We asked these questions because we wanted to have the opportunity to identify possible differences between operators who are small and big, old and new from the perspective of how they handle their costs for service and maintenance.
The second group of questions concerned the magnitude and economic impact of disruptions. Here, the interviewees had the opportunity to answer by explaining their views and experiences. The questions are asked with respect to a time span of three years, from 2007 to 2009, encouraging the interviewee to explain and illustrate important changes over time. We also asked our first research question; ―What are the most frequent disruptions?‖. In the third group of questions, the interviewees are asked to explain and inform how they organize the service and maintenance of their wind turbines, again between 2007 and 2009 in order to identify possible changes and trends. The last questions gave the interviewees the opportunity to communicate their opinion about the future of the Swedish wind power market with emphasis particularly on the service and maintenance market.
The interviewees as well as the respondents of the survey will be anonymous in this report because of the sensibility of the data asked for as well as some of them stated the wish to remain anonymous. We also argue that being anonymous raises the response rate.
2.5
Samples and selection
Choosing to focus on only the onshore wind turbines was necessary in order to limit the research. Onshore and offshore wind turbines have a lot in common. However, when comparing requirements and costs for service and maintenance as well as other aspects, it becomes clear that one cannot simply put onshore and offshore on the same edge and compare them as they differ a lot in costs and characteristics Another reason for limiting our research to only onshore wind turbines is that only few operators in Sweden combine onshore and offshore wind power.
As mentioned above, the survey was sent out to the members of Svensk Vindkraftföreningen (SVIF) as well as to members of Svensk Vindenergi. The members the survey was send to were all wind power operators. This research was selected to be a population research of SVIF and Svensk Vindenergi. For the overall population of Swedish wind turbine operators this sample is not a random sample, as it only shows wind turbine operators who have chosen to become a member of SVIF or Svensk Vindenergi. However, disruptions are general problems for the general wind turbine population in Sweden and therefore the findings of economic consequences for SVIF and Svensk Vindenergi’s members can be generalized to some extent for the whole population. Our sample symbolizes a purposive sampling approach, as we have selected what we consider is a typical sample (Walliman, 2001).
2.6
Data Analysis
2.6.1 Analysis
Considering the different kinds of data that was gathered, different approaches were used in order to present and analyze the data. Both the survey as well as the interview consisted of qualitative and quantitative elements. For the quantitative data, which was acquired by closed questions using rating scales from one to five, a structured approach according to the method of both descriptive data analysis as well as graphical display of responses to closed questions was used (Gillman, 2008).
The aim of descriptive analysis is to transform the raw data into a framework that will present information to describe a set of features in a situation. In order to transform the raw data into a descriptive framework the raw data collected is ordered and shaped (Sekaran, 2000). The quantitative data conducted is presented in tables, graphs and charts in order to visualize the obtained information. The analysis of the quantitative data includes frequencies which refer to the number of times a range of subcategories of a certain phenomenon occur. This allows calculating the percentage of the occurrence of one specific group of answers (Sekaran, 2000).
Qualitative data focuses on describing the issue of the study and a variety of interpretive techniques can be used to decode, translate, reveal patterns and discover the meaning of phenomena that arise. The extracted data can be classified and coded using a meaningful classification scheme (Sekaran, 2000). We have chosen to present the qualitative data from the interviews in a matrix included in the appendix as well as a summary of the collected
qualitative data in the empirical findings chapter. The qualitative data obtained from the interviews was analysed and interpreted by searching for patterns and common opinions among the interviewees.
The survey conducted also includes several open-ended questions which ask for specific data regarding the costs of disruptions as well as the capacity of the wind turbines owned by the operator answering the survey. The information obtained by the open-ended questions is presented in diagrams in order to make changes visible.
2.7
Data Quality
2.7.1 Data Quality and data trustworthiness
Basically all researchers deal with problems of restricted generalizability and measuring the quality of the data. Quality of interview answers is, in our opinion, impossible to measure. The only thing a researcher could do is to critically select interviewees and this procedure is described in section 2.4.
When conducting surveys, one of the most crucial issues is whether the researcher has retrieved enough answers. The meaning of ―enough answers‖ can depend on numerous factors, such as statistical theory, the size of sample and population and how symmetrically the respondents have filled in the survey. The survey was sent out to approximately 300 operators and we received a total of 43 answered surveys. Due to asymmetrical response rates to several questions from our respondents, not all 43 respondents were included when summarizing, measuring and comparing all the answers in all the questions.
The questions where we received an asymmetrical response rate were the questions which asked about specific data about costs and disruptions. A blank answer can be due to various reasons. The information about disruptions and costs is sensitive and some operators might not want to share this information. Another reason could be that the operators who could not provide the specific data did not know the answer. Even though the remaining questions were answered fully by all 43 respondents we chose for the sake of consistency to only include the 21 operators who had answered all questions. Hence the response rate of our survey was 21 out of 300 which is equal to 7%.
Therefore the final sample that was applicable for all questions contained a total of 21 operators representing a total of 31 wind turbines in 2007 and 2008 and 32 in 2009. There is one more wind turbine in 2009 because in 2009 one wind turbine was bought by one operator so we added it to the total number of wind turbines. However, the change in the number of wind turbines between the different years does not affect the calculation as the average was calculated taking into account the exact number of wind turbines for every particular year.
2.7.2 Validity and reliability
When selecting whom to send our survey to, we had to find eligible recipients. The recipients had to be operators of electricity producing wind turbines. We found recipients through communication with senior officials of Sweden’s biggest wind power associations; Svensk Vindkraftförening (SVIF) and Svensk Vindenergi (SV). These two organizations helped us in sending our survey to their members, ensuring that the recipients were in fact true wind power operators. The qualitative interviews we conducted provided us with information from both larger and smaller wind power operators. As explained in the
interview section, our interviewees were mostly chosen according to their size as we wanted to have data collected from a heterogeneous group of operators.
According to Sekaran (2000), reliability shows the stability and consistency of the data. We conducted research from three different primary data collections, which we can test and compare against each other and investigate in order to see patterns and similar opinions. We consider that this increases the validity and reliability of our study. By asking similar questions in both the survey and the interviews we were able to see if there were significant differences between the opinion expressed in the survey and the opinion expressed in the interviews.
Besides the interviews with the operators we also had an interview with an independent service and maintenance company in order to see if they had a different perception of the market than wind power operators. This allowed us to see the whole picture and analyse the market from different perspectives. On the top of the different type of primary data we also gathered secondary data from various sources, which were used to further compare the results found by the primary data to already existing data and statistics.
2.7.3 Generalizability
Generalizability affects the scope of relevance of the research findings in one situation to another situation (Sekaran, 2000). We have to emphasize that the sample received in the survey consisted mostly of small operators owning less than 5 wind turbines and that therefore the results of this survey have a limited generalizability for the whole population of Swedish wind power operators.
We consider the information gathered by our survey still useful and important as the situation of the service and maintenance market is highly complex and not all operators might be able to answer due to various reasons such as the sensitivity of the data asked for. In order to be able to understand larger operators we conducted qualitative interviews with some of Sweden’s largest wind power operators as well as medium sized wind power operators. In these interviews we tried to learn about their experiences in the service and maintenance market. After several interviews we were able to see patterns in the perception of the market which makes it possible to draw conclusions. These patterns were confirmed by the interview carried out with the service and maintenance company as well as by the results of the survey conducted. We consider that patterns which can be found increase the generalizability of our study.
According to Sekaran (2000) many if not all studies have a limited generalizability. We agree with Sekaran (2000) who states that limited applicability of results, which only are relevant for similar studies, ―does not necessarily decrease its [the studies] scientific value (if the research is properly conducted), its generalizability gets restricted.” We argue that even though our generalizability might be restricted, we still can draw conclusions from our study, which to some extent are valid for the whole population, and that our study therefore is of scientific value.
3 Frame of Reference
The frame of reference includes literature regarding the structure and competition in an industry as well as theories about costs and the importance and the impact of maintenance. These ideas will be used in order to analyze and understand the findings of our research. The structural analysis of industries by Porter (1980) was chosen in order to gain an overall view of the service and maintenance market in the Swedish wind power market and to identify possible power imbalances in this market. The literature about maintenance and life cycle cost was chosen in order to gain an understanding of the importance of costs occurring in the later part of a products life cycle and the importance of these costs for wind turbines in particular. Maintenance costs are costs that arise after the initial investment and literature about maintenance was therefore used to understand the impact and the importance of these costs.
3.1
Life cycle costs
Traditionally the cost of a product was defined as the price at the time of its purchase. However, for some products this definition may be inaccurate. Many durable goods incur a considerable share of costs in the use of maintenance during their life time. The concept of life cycle cost (LCC) was established in order to show the total cost of such durable goods over the whole period of their useful life (Hutton&Wilkie, 1980). A wind turbine is a good example of a good that will incur many costs after the initial investment.
According to Hutton & Wilkie (1980) LCCs are defined as the sum of the amount paid for an average product during its useful life. LCCs consist of three different elements:
purchase price;
Operating costs; energy, maintenance, service. disposal cost
The concept of LCC has been used both in the industry as well as by the US government and the US army. The military became aware of the importance of LCC by the finding that operating cost for large-weapon systems may account for as much as 75 percent of the total cost (Hutton&Wilkie, 1980). The LCC approach can also be useful in the wind power industry. Nilsson and Bertling (2007) recognize that investment, maintenance, downtime, and remainder value are costs that would typically concern a power plant operator. It is important for wind power operators to take those costs into account.
3.1.1 Challenges when implementing LCC
Resistance against the implementation of LCC in companies is more common than one might expect. Nobody wants to admit to have purchased an expensive product and suppliers do not want to show that they have constructed a product which generates high cost due to service and maintenance or a product that requires many and expensive spare parts during its life cycle. Those are the facts which might be found in an LCC analysis (Johansson, 1993). Despite these challenges LCC is a widely used concept and might also be profitable when investigating the costs of a wind turbine. Especially when looking at the economic aspects of wind energy, it becomes clear that a wind turbine is a product where the LCC approach is applicable.
3.2
Generating costs of wind turbines
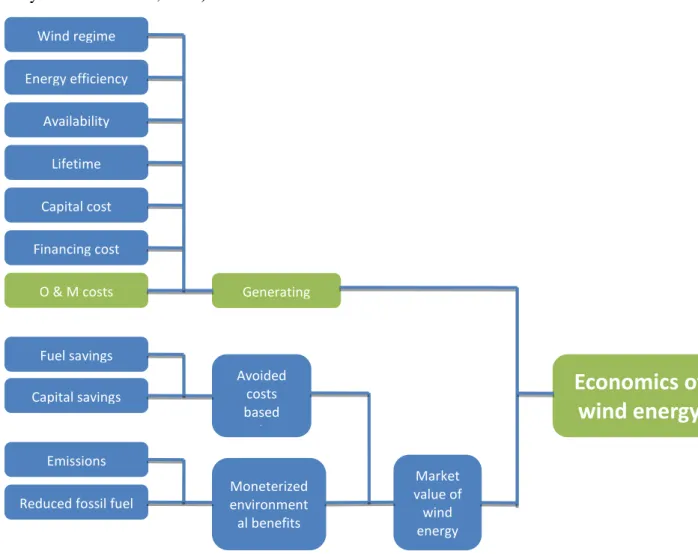
The economic aspects of wind energy are divided into two factors: market value of wind energy produced and generating costs. These features are illustrated in figure 3-1 (El-Thalij, Alsyouf and Ronsten, 2009).
Figure 3-1 Components of wind system economics from Manwell ( 2002) ( El-Thalij, Alsyouf &Ronsten, 2009)
The green parts in this figure show how operating and maintenance costs (O&M costs) are related to the generating costs of a wind turbine and thus the economics of wind energy. According to El-Thalij, Alsyouf and Ronsten (2009) operation and maintenance costs are a considerable share of total generating costs of a wind turbine and the main purpose of any wind farm is to reduce O&M costs. A power plant operator’s aim is to guarantee safe operation of the power plants. This safe operation is defined by maximum availability during the entire life cycle of the power plant and minimized generating costs. One factor which can actively be influenced by power plant operators is maintenance (Gräber, 2004).
3.3
Maintenance
Blanchard (2004) defines maintenance as all the required actions necessary for keeping the system or a product in a useful and functioning condition within its life cycle, or repairing it to a state in which it can carry out the required function (Fakhoury & Al Hamed, 2008). A set of essential inputs like management, equipment, tools, information and spare parts, are required for maintenance actions. Schnoebelen, Aerne & Miller (2001), discuss several maintenance approaches, which are described below.
Wind regime
O & M costs
Reduced fossil fuel use Energy efficiency Generating costs Market value of wind energy
Economics of
wind energy
Availability Lifetime Capital cost Financing cost Moneterized environment al benefits Avoided costs based value Emissions reductions Capital savings Fuel savings3.3.1 Reactive Maintenance
Reactive Maintenance focuses on reacting quickly to upcoming problems. This method emphasizes on having resources available ―just in case‖. Therefore the investment in resources, such as spare parts, is high in order to respond to possible emergencies or failures (Schnoebelen, Aerne & Miller, 2001).
3.3.2 Preventive Maintenance
Preventive Maintenance is a technique that focuses primarily on systematic, scheduling maintenance tasks at intervals that are frequent enough to prevent unscheduled equipment breakdowns. An example of Preventive Maintenance in every-day life is changing the oil in one’s car every 3,000 miles. Instead of time, Preventive Maintenance can also be based on conditions. Vibration (primarily for rotating equipment) is a good example of conditions that are controlled and tested. A real-live example of condition based maintenance would be monitoring the condition of the oil in a car, and scheduling an oil change when certain conditions were observed like for example a chemical breakdown of the oil (Schnoebelen, Aerne & Miller, 2001).
3.3.3 Corrective Maintenance
Corrective Maintenance is carried out after the occurrence of a failure in order to prevent repeated breakdowns. The cause for the failure is analysed and fixed rather than having shorter intervals for Preventive Maintenance (Schnoebelen, Aerne & Miller, 2001).
3.4
Maintenance Costs
Maintenance has generally been seen as a non-productive support function rather than a core function. It was considered to be a necessary evil. Maintenance cost can be divided into direct and indirect costs. Direct costs are costs that are directly linked to the planned or unplanned maintenance such as direct labour, material and overheads as for instance transportation, training and tools. Indirect costs are costs such as loss of income due to breakdowns and/or market share (Alsyouf, 2004). Indirect maintenance costs are also more difficult to estimate than direct maintenance costs (Al-Najjar &Alsyouf, 2004).
Furthermore, Alsyouf (2004) shows that throughout history researches have claimed that there are savings, gains or profits that can be made when adopting more effective maintenance approaches. He also explains that when breakdowns occur it is often straightforward to reveal that a lack of maintenance or insufficient maintenance was the reason. On the other hand it is harder to prove that maintenance does prevent breakdowns when no breakdowns occur.
3.5
The Impact of Maintenance
Maintenance may have an impact on different stakeholders. It does not only affect the operation but also customers, society and shareholders. The impact of maintenance on society is described among other things by its impacts on the environment and ecology (Alsyouf, 2004). The figure below shows how maintenance can affect a company’s competitive advantage.
Figure 3-2 Conceptual model showing how maintenance could affect the companies’ competitiveness (Alsyouf, 2004) Figure 3-2 will be used in order to see the impact of cost-effective maintenance in a broader context regarding Swedish wind power. We will apply this figure by describing its different elements for the case of the Swedish wind power market. We see cost effective maintenance as the base for the quality, effectiveness and efficiency for the operation of a wind turbine. Our definition for operations effectiveness is to which extent targets of electricity production are achieved. Operations efficiency on the other hand focuses on how the given resources were used in order to achieve the production target. Effectiveness and efficiency influence the quality of operations. It is important to effectively perform the right operation to achieve targets as well as to use resources efficiently.
The quality of operation has an impact on the competitive advantage of wind power compared to other energy sources as it influences profitability of wind power compared to other energy sources. A high quality of operations affects the productivity advantages wind power has compared to other energy sources. Also advantages in value compared to other energy sources are influenced by the quality of operations as the environmental impact of wind power decreases when using resources more efficient. A high profitability of wind power decreases the price of electricity produced by wind power compared to electricity produced by other energy sources and increases therefore the competitive advantage of wind power in relation to other energy sources. This competitive advantage has consequences for several stakeholders.
We understand that high productivity and profitability decreases prices and increases the production of wind power which is positive for customers as they can buy more electricity produced by wind power and for a lower price. This is also positive for the Swedish society
as a whole as more environmentally friendly energy is produced and fewer resources are wasted in order to produce electricity. In addition, shareholders are more satisfied because they earn higher returns from a more profitable organisation.
To summarize we would like to highlight that Figure 3-2 shows that cost-effective maintenance has a high impact not only on the single operator but also for the society as a whole. Due to the high impact of maintenance several maintenance approaches have been developed in order to make maintenance more effective and many companies try to consistently improve their maintenance (Alsyouf, 2004).
3.6
The Structural Analysis of Industries
All good maintenance practices are of no use for the operator if the service supplier exercises too much power over other participants, like the operator (the buyer). Thus the industry structure determines the potential competitive strategies available to wind power operators (Porter, 1980). The supplier can exert power through increasing the prices and/ or reducing the quality of the service (Porter, 1980). In order to demonstrate that suppliers (wind turbine manufacturers) hold the dominant position in the Swedish wind power market, Porter’s structural industry analysis is a suitable tool. A structural analysis identifies the basic economic and technological characteristics of an industry which are critical factors to the strength of each competitive force. Looking at figure 3-3, one can see the five basic competitive forces that make up the state of competition of an industry.
Figure 3-3 The 5 Forces Driving Industry Competition (Porter, 1980).
The five competitive forces, displayed above, include entry, threat of substitution, bargaining power of buyers, bargaining power of suppliers, and rivalry among current competitors. This figure reflects the fact that competition in an industry not only exists between wind power operators (buyers) but also between them and their suppliers. Porter called this ―extended rivalry‖ instead of competition in order to emphasize that all the market powers are competing with each other even though they may not be direct