www.vti.se/publications Niclas Krüger Inge Vierth Gerard de Jong Askill Halse Marit Killi
Value of Freight Time
Variability Reductions
Results from a pilot study for the
Swedish Transport Administration
VTI notat 39A–2013 Published 2013
Förord
Under första halvåret 2013 finansierade Trafikverket två pilotstudier som avser metoder för att beräkna värden för förbättrad tillförlitlighet (VTTV = value of reduced transport time variability) för godstransporter som kan användas i kostnadsnyttoanalyser. VTI, Significance och Transportøkonomisk Institutt (TØI) har genomfört studien “Value of Freight Time Variability Reductions”; WSP, KTH, Göteborgs universitet, Transrail och Vectura har genomfört studien “Value of Transport Time Variability for Freight
Transport”. Studierna ska tjäna som underlag för vidare beslut.
En utgångspunkt för VTI:s, Significance’s och TØI:s pilotstudie är de forsknings- och utvecklingsaktiviteter som VTI har rekommenderat i förstudier 2010 och 2012. Mål-sättningen var att föra de föreslagna aktiviteterna ett steg längre. Riktlinjerna för kostnadsnyttoanalyser täcker alla transportsätt; i pilotstudien ligger dock tyngdpunkten på transportkedjor som inkluderar järnväg som förknippas med de största tillförlitlig-hetsproblem i Sverige.
Pilotstudien innehåller tre moment: Sammanfattningen/Kappan, del 1 och del 2. I del 1 beskrivs de i Nederländerna och Norge nyligen beräknade VTTV (beräknade med hjälp av Stated Preference metoden) och möjliga implikationer för Sverige. I del 2 presenteras ansatsen som bygger på förebyggande kostnader (precautionary costs),
fallstudie-ansatsen och aktiekursfallstudie-ansatsen som nya metoder för att beräkna VTTV.
Niclas Krüger och Inge Vierth (båda VTI) har skrivit sammanfattningen och del 2. Gerard de Jong (Significance), Askill Halse och Marit Killi (båda TØI) har skrivit del 1. Denna rapport innehåller sammanfattningen och del 1. Del 2 finns tillgänglig hos
författarna, som planerar att publicera innehållet som CTS-working paper respektive vetenskapliga artiklar.
Stockholm, december 2013
Inge Vierth Utredningsledare
Quality review
Review seminar was carried out on 3 September 2013 where Lars Hultkrantz and John Bates reviewed and commented on the report 29 November 2013. Inge Vierth and Niclas Krüger have made alterations to the final manuscript of the report. The research director of the project manager Anders Ljungberg examined and approved the report for publication on 4 December 2013.
Kvalitetsgranskning
Granskningsseminarium har genomförts 3 september 2013 där Lars Hultkrantz och John Bates var lektörer. Inge Vierth och Niclas Krüger har genomfört justeringar av slutligt rapportmanus 29 november 2013. Projektledarens närmaste chef Anders Ljungberg har därefter granskat och godkänt publikationen för publicering 4 december 2013.
Table of contents
Summary ... 5
Sammanfattning ... 11
1 Part One: Evidence and Implications from Netherlands and Norway .... 17
1.1 Implications of Dutch/Norwegian SP-studies for Swedish freight VTTV 17 1.2 Objectives of the studies ... 17
1.3 Definition of reliability ... 17
1.4 The SP survey ... 18
1.5 Analysis of the SP survey ... 20
1.6 Current practice ... 22
2 Part Two: New methods for estimating the freight VTTV ... 27
Annex A: Norwegian studies on the value of freight time variability Annex B: VTTV in recent SP study on in The Netherlands
Value of Freight Time Variability Reductions – Results from a pilot study performed on behalf of the Swedish Transport Administration
by Niclas Krüger, Inge Vierth, Gerard de Jong*, Askill Halse** and Marit Killi** Swedish National Road and Transport Research Institute (VTI)
SE-581 95 Linköping, Sweden *Significance
**Transportøkonomisk Institutt (TØI)
Summary
There is to date limited knowledge about the impact of different policy measures and the monetary valuation of improved reliability for freight transports. This means that the benefits of reduced variability in transport time are not taken into account properly in cost-benefit analysis (CBA), for example related to infrastructure measures. VTTV are in comparison to the VTTS hardly addressed in cost benefit analysis despite the
intentions in several countries (OECD/ITF, 2009). The Swedish CBA-guidelines recommend provisional commodity specific VTTV for the cargo component. These values are assumed to be two times the VTTS and expressed in SEK per tonne-hour (Trafikverket, 2012 ). The benefits for the vehicle and staff component are assumed to be part of the transport costs and quantified elsewhere in the CBA.
Unreliable rail transports are the main contributor to the transport time variability. The Swedish Transport Administration registered around 80 000 delay hours for freight trains in 2010 and 2011 and around 40 000 delay hours in 2012, (Trafikverket, Anders Broberg, 2013-11-29). This corresponds roughly to 20 million tonne-delay-hours, given that 500 tonnes per train is assumed to be the average load. This figure is 10 times higher than the corresponding figure for road transports. The Swedish Transport Administration registered circa 1,300,000 road vehicle-delay-hours due to unplanned stops over five minutes (and at least for all lanes in one direction) in 2010 (Trafikverket, 2013). The number of truck-delay-hours is ca. 200 000 hours (assuming that 15 per cent of the vehicles are trucks) and the number of the “tonne-delay-hours” is ca. two million (assuming a load of ten tonnes per truck). The delays for the sea and air transports are probably negligible.
The information about the reliability of the rail transports and how different policy measures influence i.e. the number and length of delays and or the risks for delays has been limited. The former has been improved in recent years but the latter is still a problem. The lack of underlying data is one reason why the recommended VTTV have only been applied in a few rail infrastructure projects (Vierth & Nyström, 2013). Nevertheless, the industry complains about the extensive problems caused by train delays or cancellations and that the reduction of these problems is not taken into
account in a proper way in the CBA. One example for such a problem is the derailment in Grötingen in January 2011 that led to a two day stop of the SSAB steel plant in Borlänge, additional transport costs of SEK 1.5 million and lost/delayed sales of SEK 60 million. Another example is the derailment and destruction of a seven km single track in Jutland/Denmark in November 2012. The track was blocked and circa 60 freight trains to/from Sweden had to find alternative routes and modes during a period of more than two weeks. ScandFibre Logistics claimed to have additional transport
costs of circa SEK 20 million to carry paper (worth ca. one billion SEK) to mainland Europe.
Another question that is debated is how much more high value products would be transported by rail if the rail transports would be more reliable. According to the latest Swedish Commodity Flow Survey 2009 (Trafikanalys, 2010), the value of the outgoing goods transported by road (SEK 9.5 per kg) is about three times the value of the
outgoing goods transported by rail or rail in combination with other modes (SEK 3.7 per kg). The Transport Administration are aware of the shortcomings and has among others funded this pilot study that studies different approaches to calculate the VTTV for the cargo transported.
Part One presents the SP-studies to calculate VTTS (Value of Transport Time Savings) and VTTV that have been carried out recently in The Netherlands and Norway. Both the Dutch VOTVOR-study (Significance et al, 2012) and the Norwegian GUNVOR-study (Halse et.al, 2010) comprise door to door transports for all modes and use the standard deviation of the transport time to express the variability in transport time. The PUSAM-study (Halse et al, 2012) is a follow up PUSAM-study of the GUNVOR-PUSAM-study with the intention to obtain better values for rail freight transports. The PUSAM study uses the expected delay between railways stations to express the reliability. VTTV-estimates could be derived although the response rates were low: in GUNVOR ca.6 percent and in PUSAM ca. 14 percent; the majority of the big forwarders were however represented in the PUSAM-study.
Part One also discusses to what extent the VTTV calculated in the Dutch and
Norwegian SP-studies can be transferred to Sweden. The freight reliability ratios (RR) express the importance of the variability of the transport time relative to the transport time. The RR for rail transports are 0.8 in the Dutch VOTVOR-study and 1.8 in the Norwegian GUNVOR-study, whereas expected delay has a value of 72 NOK per tonne-hour in the Norwegian PUSAM-study. The VTTV would need to be adjusted to the mix of goods transported1 and are probably lower for Sweden (and The Netherlands) with a high share of bulk transports with a relatively low value than for Norway. As for road an empirical study for Sweden would be needed. Also transport distances and the level of congestion differ and an empirical study in Sweden would be needed to get VTTV for Swedish road transports. The choice between the two reliability measures (standard deviation or expected delays) should to a large extent depend on which measure can be implemented with the least effort in the Swedish transport model SAMGODS.
In Part Two three alternative approaches to calculate VTTV for Swedish rail freight transports are demonstrated, that to the best of our knowledge have not been
implemented before.
1. The precautionary cost approach uses the hypothesis that a company reacts to a stochastic delivery time by taking precautionary measures (s) which are a function of the standard deviation in transport time (σ): s=f (σ) ceteris paribus. Different types of precautionary measures can be applied; i.e. holding of safety
1 If one uses the RR for this, it may not be necessary to correct the RR itself for the difference in the mix of goods transported between countries. Since the VTTV is defined as (VTTS * RR), differences in the VTTV that arise because of differences in the mix of goods transported might already be covered by differences in the VTTS (for the cargo; VTTSs for transport services do not differ much between commodity types). However it is also possible that there are additional differences between the countries that are reflected in differences in the RR and that amplify or reduce the differences that we see in the VTTSs.
stocks, using more expensive modes that are more reliable and localisation close to suppliers or customers. The cost for holding a safety stock and hence the cost of variability in transport time is the cost of physical storage of the goods and the capital costs of the goods stored. Hence we can compute the societal cost of variability under certain simplifying conditions. We show i) that the marginal precautionary costs measure marginal VTTV and that ii) a precautionary stock approach can in principle be made operational by aggregating all companies in Sweden with freight transport exposure, computing a virtual safety stock and using key aggregate figures about transport time variance, inventory costs, freight flows and required service level. Required service levels should be obtainable from companies since they are key figures used in practice. Further on other precautionary costs than inventory costs need to be included in the approach. More research should be done on how to incorporate the extremeness of empirical delays that tentatively increase the firms’ precautionary costs and VTTV.
2. The case study approach identifies the amount and type of the additional costs that (Swedish) shippers face due to the variability of the rail transport time with help of company cases. The shuttle train run by the grocery company COOP is studied. We measure the degree of variability that the company faces during a 16-month period and estimate the precautionary costs COOP were willing to accept to manage the costs of transport time variability and the additional operative costs that the company pays in case of train delays over one hour and cancellations. We show i) that it is possible to get an estimate of VTTV valid for a specific company and that ii) in conclusion, given the high degree of market concentration with regard to shippers and forwarders, just a few case studies for key companies in the market might be sufficient to get a
representative VTTV in Sweden.
3. The market based approach is built on the hypothesis that publicly traded company stocks accurately reflect the steady stream of information and hence that delays for freight trains should have an effect on stock prices. We show i) that stock prices for companies that use rail transports react on train delays, ii) that changes in company market value per hour delay can be used as a VTTV-estimate given figures about rail freight flows (volume and variability of transport time) for a certain company and that iii) the method can be used to discern between costs for relatively small delays and the very large delays. In other words, the method has the potential to identify costs of transport system vulnerability not covered by VTTV. The approach presented in this pilot study needs to be developed by using information about quantities transported for the examined companies.
Table 1 summarizes the cargo-related VTTV for rail transports calculated with help of the different approaches. The values derived in the Dutch and Norwegian SP-studies (see Part One) are not adjusted to the Swedish commodity mix. In Part Two new approaches are tested, that make use of existing data. The computed VTTV have to be seen as preliminary values; the values are probably lower bounds as not all
precautionary costs are included and as the market value approach does not take into account the train delays for specific companies. The importance of how to measure reliability is illustrated in the COOP-case where the VTTV based on the delays over one hour is higher than the VTTV based on the standard deviation. The VTTV that are recommended in the Swedish CBA-guidelines (Trafikverket, 2012 ) are included as comparison.
Table I: VTTV for the cargo component in rail transports (SEK per tonne-hour) COOP:s goods Consoli-dated goods Other goods Food and feed High value goods All goods Part One
Dutch VOTVOR-study, (standard deviation for door-to-door transports)
2 Norwegian GUNVOR study,
(standard deviation for door-to-door
transports) 50
Norwegian PUSAM study, (expected delay between railway stations)
317 40 82
Part Two
Precautionary cost approach (standard deviation, inventory costs)
2 (prel.) Case study approach (COOP, train
delays over one hour and
cancellations precautionary costs)
18 (prel.)
Case study approach (COOP, train delays over one hour and
cancellations precautionary costs and operative costs in case of delays)
34 (prel.)
Market value approach (standard deviation)
2 (prel.) Swedish ASEK 5-values (excl. VAT),
based on commodity value, per delay tonne hour
4 14 3
Note: Values where the VTTV is measured as the standard deviation of transport time (in hours) are printed in bold. It is difficult to compare these values to values for delay in hours, though there is a positive correlation between the standard deviation and mean delay.
The reasons (measurement of variability, method, selection of companies/persons who participate in the study, response rate, etc.) for the partly large differences for the calculated VTTV for the cargo component for rail transport need to be analyzed.
We show that the VTTV calculated in the Dutch and Norwegian SP-studies in principle can be transferred to Sweden. However, empirical studies that are adjust with respect to the commodity mix, the transport distances, level of congestion etc. in Sweden are needed. One question is how to handle early arrivals (that are included in the standard deviation but not in the expected delay) needs to be addressed. The question of
excessive slack is also important from a policy point of view. Another question is how the variation in transport time for empty trains should be taken into account. If Sweden decides to carry out a SP-study to calculate VTTV (and VTTS) it is possible to make use of the Dutch and Norwegian experience.
We also demonstrate the use of three approaches using crude figures as an input. We advocate further research on getting more realistic inputs. Moreover, the theoretical and empirical methods should be developed. Also, more research should be done on how to incorporate the extremeness of empirical delays in models and definitions of VTTV and how different policy measures can reduce the transport time variability. Last but not
least, new methods, for example based on micro-level data on company inventories, the standard SP-method and the three new approaches suggested here, should be used in combination in order to validate VTTV-estimates.
The starting point for our comments on future research are the recommendations in VTI's pre-studies from 2010 and 2012 2 See Table 2 below. Lastly we would like to stress that use of the VTTV in cost benefit analysis requires information about the causes for variation in transport time, how delays, cancellations and early arrivals are distributed over the network, the dispersion of delays and how different policy measures influence the transport time and the variation in transport time. Ideally the variability of the transport time should be included in the Samgods model (as the transport time). Given that also information about the stock out costs is available the buffer stock approach could be integrated in the Samgods model.
When it comes to further developments, we need to be sure what to valuate and how to use the VTTV in CBA. According to the fact that most of the delays for the Swedish freight transports are related to rail transports, there is a need to improve a) the knowledge about transport time variability in transport chains that include rail and b) the firms’ valuation of (the lack of) reliability. The following questions need to be covered in research and development projects:
How should transport time variability be expressed and measured - i.e. inclusion of early arrivals and slack or not, handling of large versus small delays (the standard deviation is not that relevant in the COOP case), risks for very large delays versus vulnerability of the transport system
How does the variation in transport time influence companies? - Thresholds for delays and early arrivals could be derived with SP-study, companies’ costs related to average costs in case of (major) delays are higher than the costs for average delays
How do different policy measures influence transport time variability? - i.e. analysis of causes for delays, evaluation of impacts of measures that have been applied in recent years, identification of “weak links” in the rail network What are the possibilities to transfer the VTTV derived in the Dutch and
Norwegian SP-studies to Sweden - empirical studies of Swedish freight transports and their conditions compared to Norwegian and Dutch transports How do share of rail transports, service levels, type of precautionary costs etc.
differ between companies from different sectors?
Collection of information from large shippers and forwarders in order to extend the approaches described in Part Two. One aspect is the separation of variation of transport time and variation of demand. Another aspect is to what extent could less transport time variability contribute to more rail transports.
2 The remaining recommendations are not that directly related to the estimations of the VTTV: improvement of the knowledge of the less well studied opportunity costs, a clarification of the whole CBA structure for freight value of time and reliability as well as an application of the logistics model within the Samgods model
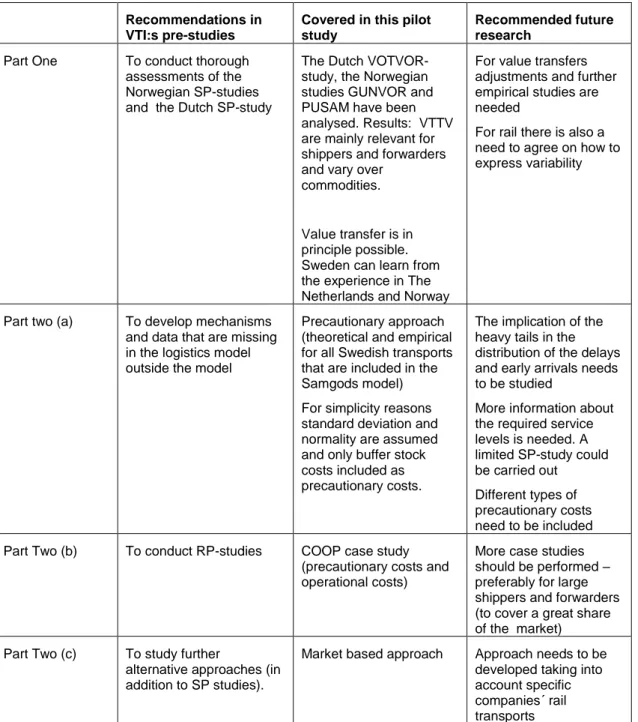
Table II: Activities to estimate VTTV in earlier pre-studies, this pilot study and recommended as next steps
Recommendations in VTI:s pre-studies
Covered in this pilot study
Recommended future research
Part One To conduct thorough
assessments of the Norwegian SP-studies and the Dutch SP-study
The Dutch VOTVOR-study, the Norwegian studies GUNVOR and PUSAM have been analysed. Results: VTTV are mainly relevant for shippers and forwarders and vary over
commodities.
Value transfer is in principle possible. Sweden can learn from the experience in The Netherlands and Norway
For value transfers adjustments and further empirical studies are needed
For rail there is also a need to agree on how to express variability
Part two (a) To develop mechanisms
and data that are missing in the logistics model outside the model
Precautionary approach (theoretical and empirical for all Swedish transports that are included in the Samgods model) For simplicity reasons standard deviation and normality are assumed and only buffer stock costs included as precautionary costs.
The implication of the heavy tails in the distribution of the delays and early arrivals needs to be studied
More information about the required service levels is needed. A limited SP-study could be carried out Different types of precautionary costs need to be included
Part Two (b) To conduct RP-studies COOP case study
(precautionary costs and operational costs)
More case studies should be performed – preferably for large shippers and forwarders (to cover a great share of the market) Part Two (c) To study further
alternative approaches (in addition to SP studies).
Market based approach Approach needs to be developed taking into account specific companies´ rail transports
Värdet av minskad variabilitet i transporttid för godstransporter – resultat från en pilotstudie som genomfördes på uppdrag av Trafikverket
av Niclas Krüger, Inge Vierth, Gerard de Jong*, Askill Halse** och Marit Killi** VTI, Statens väg- och transportforskningsinstitut
581 95 Linköping *Significance
**Transportøkonomisk Institutt (TØI)
Sammanfattning
Det finns begränsad kunskap om effekterna av olika politiska åtgärder och den monetära värderingen av förbättrad tillförlitlighet för godstransporter. Detta innebär att nyttorna kopplade till minskad variabilitet i transporttiden inte beaktas korrekt i kostnadsnytto-analyserna (CBA) som genomförs till exempel i samband med infrastrukturåtgärder.
Value of reduced transport time variability (VTTV) behandlas i jämförelse med Value of reduced transport time variability (VTTS) knappast i CBA trots intentionerna i flera
länder (OECD/ITF, 2009). De svenska CBA-riktlinjerna rekommenderar provisoriska varugruppspecifika VTTV för det transporterade godset. Dessa värden erhålls genom att multiplicera VTTS med två och anges därmed i kronor per tontimme (Trafikverket 2012). Nyttorna för fordonet och personalen antas vara en del av transportkostnaderna som ingår i en annan del i CBA.
Otillförlitliga järnvägstransporter bidrar mest till transporttidens variabilitet. Trafik-verket registrerade 2010 och 2011 cirka 80 000 förseningstimmar för godståg och 2012 cirka 40 000 timmar, (Trafikverket, Anders Broberg, 2013-11-29). 40 000 försenings-timmar motsvarar ungefär 20 miljoner tonförsenings-timmar försening om man antar att det fraktas 500 ton per tåg. Denna siffra är 10 gånger större än motsvarande siffra för
väg-transporter. Trafikverket registrerade år 2010 cirka 1,3 miljoner förseningstimmar för vägtransportfordon på grund av oplanerade stopp över fem minuter för åtminstone ett körfält i en riktning (Trafikverket, 2013). Antalet förseningstimmar för lastbilar var cirka 200 000 timmar, om man antar att 15 procent av vägfordonen är lastbilar, och antalet tonförseningstimmar därmed cirka 2 miljoner, förutsatt att en lastbil
transporterar 10 ton. Förseningar för sjö- och flygtransporter är förmodligen försumbara.
Informationen om tillförlitligheten av järnvägstransporter och hur olika åtgärder påverkar till exempel antalet av och längden på förseningar eller förseningsrisker har varit begränsad. Mer och bättre information om förseningar har tagits fram under de senaste åren men bristen på så kallat effektsamband är fortfarande ett problem. Bristen på förseningsdata är en anledning till varför de rekommenderade VTTV endast har tillämpats i ett fåtal kalkyler för järnvägsinfrastrukturåtgärder (Vierth & Nyström, 2013). Industrin klagar över omfattande problem som förorsakas av sena eller inställda tåg och att minskningen av dessa problem inte beaktas på ett korrekt sätt i CBA. Ett exempel på ett sådant problem är urspårningen i Grötingen i januari 2011 som ledde till ett två dagars stopp i SSAB:s stålverk i Borlänge, extra transportkostnader på 1,5 miljoner kronor och förlorad/försenad försäljning värd cirka 60 miljoner kronor. Ett annat exempel är urspårningen och förstöringen av 7 kilometer enkelspår i
Jylland/Danmark i november 2012. Banan var blockerad och cirka 60 godståg till eller från Sverige var tvungna att hitta alternativa vägar och/eller transportsätt under mer än
två veckor. ScandFibre Logistics anger att de har haft extra transportkostnader på cirka 20 miljoner kronor för att frakta papper till kontinenten.
En annan fråga som diskuteras är att mer högvärdiga produkter skulle transporteras på järnväg om järnvägstransporter skulle vara mer tillförlitliga. Enligt den nationella Varuflödesundersökningen 2009 (Trafikanalys, 2010), är värdet för avgående gods som transporteras på väg (9,5 kronor per kg) ungefär tre gånger så stor som värdet för avgående gods som transporteras på järnväg eller på järnväg i kombination med andra trafikslag (3,7 kronor per kg). Trafikverket är medveten om bristerna och har bland annat finansierat detta pilotprojekt som studerar olika ansatser för att beräkna VTTV för det transporterade godset.
Del 1 presenterar SP-studierna (Stated Preference) för att beräkna VTTS och VTTV som nyligen genomfördes i Nederländerna och Norge. Både den holländska VOTVOR-studien (Significance et.al. 2012) och den norska GUNVOR-VOTVOR-studien (Halse et. al. 2010) omfattar dörr-till-dörr-transporter för alla transportsätt och använder transporttidens standardavvikelse för att mäta variabiliteten i transporttiden. PUSAM-studien (Halse et.al 2012) är en uppföljning av GUNVOR-studien och har målsättningen att ta fram ”bättre värden” för godstransporter på järnväg. PUSAM-studien använder förväntade förseningar mellan järnvägsstationer som tillförlitlighetsmått. VTTV-estimat kunde härledas trots att svarsfrekvensen var låg: cirka sex procent i GUNVOR-studien och cirka 14 procent i PUSAM-studien.
Del 1 behandlar också i vilken utsträckning som de i de norska och holländska SP-studierna beräknade VTTV kan överföras till Sverige. Den så kallade reliability ratio (RR) uttrycker betydelsen av variabiliteten i transporttiden i förhållande till
transporttiden. RR-värden för järnvägstransporter är 0,8 i den holländska VOTVOR-studien och 1,8 i den norska GUNVOR-VOTVOR-studien, medan den förväntade förseningen har ett värde på 72 norska kronor per tontimme i PUSAM-studien. VTTV skulle behöva anpassas till sammansättningen av det på järnväg transporterade godset och är förmodligen lägre för Sverige (och Nederländerna) med en hög andel av relativt lågvärdiga bulktransporter än för Norge.3 Även transportsträckor och kapacitets-begränsningar skiljer sig åt och en empirisk studie för Sverige skulle därför behövas. Valet mellan de två tillförlitlighetsmåttens standardavvikelse och förväntad försening beror säkert i stor utsträckning på vilket som enklast kan användas i den svenska nationella transportmodellen SAMGODS.
I del 2 visas tre alternativa metoder för att beräkna VTTV för svenska godstransporter på järnväg, som så vitt vi vet inte har genomförts tidigare:
1. Precautionary costs ansatsen baseras på hypotesen att företag reagerar på stokastiska leveranstider genom att vidta förebyggande åtgärder (s) som är en funktion av standardavvikelsen för transporttiden (σ): s = f (σ) allt annat lika. Olika typer av förebyggande åtgärder kan tillämpas, till exempel säkerhetslager, användning av dyrare, mer tillförlitliga transportsätt eller lokalisering nära underleverantörer eller kunder. Kostnaden för att hålla ett säkerhetslager – och
3 Om man använder RR för detta, kan det vara nödvändigt att korrigera RR själv för skillnaden i godssammansättningen mellan länderna. Eftersom VTTV definieras som (VTTS * RR), kan skillnader i VTTV som uppstår på grund av skillnader i godssammansättningen redan inkluderar av skillnader i VTTS för godset (VTTS för transporttjänster skiljer sig inte mycket mellan varugrupper). Det kan dock finnas ytterligare skillnader mellan länderna som återspeglas i skillnader i RR och som förstärker eller reducerar de skillnader som vi ser i VTTS.
därmed kostnaden för variabiliteten i transporttiden – är kostnaden för den fysiska lagringen och kapitalbindningen av det lagrade godset. Därför kan vi beräkna de samhällsekonomiska kostnaderna för transporttidens variabilitet under vissa förenklande förutsättningar. Vi visar i) att de marginella
förebyggande kostnaderna motsvarar marginell VTTV och att ii) precautionary cost-ansatsen i princip kan operationaliseras genom att aggregera alla företag i Sverige som transporterar gods, beräkna ett virtuellt aggregerat säkerhetslager och använda aggregerade uppgifter för transporttidens variabilitet,
lagerkostnader, godsflöden och önskad servicenivå. Det borde vara möjligt att få uppgifter om de önskade servicenivåerna eftersom företagen använder service-nivåerna som nyckeltal. I ett senare steg borde andra förebyggande åtgärder än lagerkostnader inkluderas. Mer forskning krävs också om hur det kan/ska tas hänsyn till extrema förseningar som tenderar att öka företagens förebyggande kostnader och VTTV.
2.
I fallstudieansatsen identifieras vilken typ och hur stora extra kostnader dagligvaruföretag möter på grund av att transporttiden för järnvägstransporter avviker från tidtabellstiden. Dagligvaruföretaget COOP:s skytteltåg studeras. Vi mäter vilken variabilitet i transporttiden företaget exponerades för under en period på 16 månader och uppskattar de förebyggande kostnader som COOP var villiga att acceptera för att hantera kostnaderna för transporttidens variabilitet. Vi skattar även de operativa kostnaderna som uppstod i de fall tågen var över en timme försenade eller inställda. Vi visar i) att det är möjligt att uppskatta VTTV för ett visst företag och ii) att det med tanke på den höga koncentrationsgraden på godstransportköpare och speditörsmarknaden skulle vara tillräckligt att genomföra (några) fallstudier med dominerande företag för att få ett för Sverige representativt VTTV.3. Stock market-ansatsen bygger på hypotesen att börsnoterade företags aktier återspeglar den stadiga strömmen av ny information och att godstågens förseningar därmed bör ha en effekt på aktiekurserna. Vi visar i) att aktiekurserna för företag som transporterar gods på järnväg reagerar på tågförseningar, ii) att förändringar i företagens marknadsvärde per förseningstimme kan användas som VTTV förutsatt att det finns data på järnvägsflöden (volym och transporttidens variabilitet) för ett visst företag och att iii) metoden kan användas för att skilja mellan kostnader för relativt små förseningar och mycket stora förseningar. Med andra ord har metoden potential att identifiera kostnaderna för transportsystemets sårbarhet som inte omfattas av VTTV. Ansatsen som presenteras i pilotstudien behöver utvecklas genom att använda information om hur mycket de undersökta företagen verkligen har transporter på järnväg.
Tabell I sammanfattar VTTV för gods som transporteras på järnväg, beräknade med hjälp av olika metoder. Värden som har erhållits i de nederländska och norska SP-studierna (se del 1) är inte anpassade till den svenska godssammansättningen. I del 2 testas två nya metoder som använder sig av befintliga svenska data. De beräknade VTTV för det transporterade godset måste ses som preliminära, värdena är förmodligen högre eftersom inte alla förebyggande kostnader är inkluderade och eftersom stock-market ansatsen inte tar hänsyn till tågförseningar för specifika företag. Att det är av betydelse hur man mäter tillförlitligheten illustreras i COOP-fallet där VTTV baserat på förseningarna över en timme är högre än VTTV baserat på standardavvikelsen. VTTV som rekommenderas i de svenska CBA-riktlinjer (Trafikverket 2012) ingår som jämförelse i tabellen.
Tabell I: VTTV för godskomponenten för järnvägstransporter (kr per tontimme) COOP:s gods Konsoli-derat gods Övrigt gods Livsmedel och djurfoder Högvärdigt gods Allt gods Del 1 Holländsk VOTVOR-studie, (standardavvikelse, dörr-till-dörr transporter) 2 Norsk GUNVOR-studie (standardavvikelse, dörr-till-dörr transporter) 50 Norsk PUSAM-studie (förväntad försening för transporter mellan järnvägsstationer) 317 40 82 Del 2
Precautionary costs ansats (standard avvikelse, lagerkostnader)
2 (prel.)
Fallstudie ansats (COOP, förseningar över en timme, förebyggande kostnader)
18 (prel.)
Fallstudie ansats (COOP, förseningar över en timme, förebyggande kostnader och operativa kostnader vid förseningar) 34 (prel.) Marknadsvärdeansatsen (förseningstid) 2 (prel.) Svenska ASEK 5-värden (exkl.
MOMS) baserad på godsets värde, per förseningstimme
4 14 3
Obs: Värden där VTTV mäts som standardavvikelse (i timmar) är tryckta med fet stil. Det är svårt att jämföra dessa värden till värden för förseningar i timmar, även om det finns ett positivt samband mellan standardavvikelsen och genomsnittlig försening.
Orsakerna (mått för variabilitet, metod, urval av företag/personer som delta i studien, svarsfrekvens m.m.) för de delvis stora skillnaderna mellan de beräknade VTTV för godskomponenten för järnvägstransporter, behöver analyseras.
Vi visar att VTTV beräknade i de nederländska och norska SP-studierna i princip kan överföras till Sverige. Det krävs dock empiriska studier för att justera för samman-sättningen av det transporterade godset, transportavstånd, kapacitetsrestriktioner med mera i Sverige. En fråga som behöver tas ställning till är hanteringen av för tidiga ankomster, som ingår i standardavvikelsen men inte i den förväntade förseningen. Frågan om inbyggda tidsmarginaler i tidtabellen är också viktig, bland annat ur en politisk synvinkel. En annan fråga är hur variabiliteten i transporttiden för tomma tåg ska beaktas. Om Sverige beslutar att genomföra en SP-studie för att beräkna VTTV (och VTTS) är det möjligt att använda sig av de holländska och norska erfarenheterna. Vi visar också användningen av tre nya metoder med relativt grova data som input. Det krävs ytterligare forskning och utveckling för att ta fram mer realistiska indata. Både de
teoretiska och de empiriska metoderna behöver vidareutvecklas. Dessutom bör det undersökas om och hur man bör införliva extrema förseningar i modeller, hur VTTV ska definieras och hur olika policyåtgärder kan minska variabiliteten i transporttiden. Sist men inte minst, borde nya ansatser, till exempel baserade på mikrodata om
företagets lager, standard SP-metoden och tre nya ansatser som föreslås här, användas i kombination för att validera VTTV-skattningar.
Utgångspunkten för våra förslag till framtida forskning är rekommendationerna i VTI:s förstudier från 2010 och 20124 , se Tabell II nedan. Vi vill understryka att användningen av VTTV i samhällsekonomiska analyser kräver information om orsaker till
variabiliteten i transporttiden, hur försenade, för tidiga och inställda tåg fördelas i infrastrukturen, förseningarnas spridning och hur olika åtgärder påverkar transporttiden och variabiliteten i transporttiden. Helst bör variabiliteten av transporttiden ingå i den nationella Samgodsmodellen (som transporttiden). Förutsatt att även uppgifter om kostnaderna som uppstår om gods som efterfrågas inte finns på lager (stock out costs) skulle precautionary costs ansatsen som omfattar lagerkostnader kunna integreras i Samgodsmodellen.
När det gäller den fortsatta utvecklingen, måste vi vara säker på exakt vad som (ska) värderas och hur VTTV ska användas i CBA. Med hänsyn till att de flesta förseningar för de svenska godstransporter uppstår i järnvägssystemet finns behov att förbättra a) kunskapen om transporttidens variabilitet i transportkedjor som omfattar järnväg och b) företagens värdering av (bristen på) tillförlitlighet. Följande frågor borde besvaras i forsknings-och utvecklingsprojekt:
Hur ska transporttidens variabilitet uttryckas och mätas – till exempel om för tidiga ankomster och slack ska inkluderas eller inte, hanteringen av stora kontra små förseningar (standardavvikelsen är inte så relevant i COOP-fallstudien), risker för stora förseningar kontra transportsystemets sårbarhet Hur påverkar transporttidens variabilitet företag? Trösklar för förseningar och för tidiga ankomster kunde härledas med hjälp av SP-studier, företagens kostnader relaterade till de genomsnittliga kostnaderna i de fallen där (stora) förseningar uppträder är högre än kostnaderna för genomsnittliga förseningar Hur olika åtgärder påverkar transporttidens variabilitet? – Bland annat analys av
förseningsorsakerna, utvärdering av effekter av under de senaste årens genomförda åtgärder, identifiering av "svaga länkar" i järnvägsnätet
Vilka möjligheter finns det för att överföra VTTV som har beräknats i de neder-ländska och norska SP-studierna till Sverige? - Empiriska studier av de svenska godstransporterna och förutsättningar för dessa jämfört med de norska och holländska transporterna
Hur mycket skiljer andelen järnvägstransporter, servicenivåer, typ av
förbyggande åtgärder kostnader med mera mellan företag i olika branscher? Insamling av information från stora varuägare och speditörer i syfte att utvidga
de metoder som beskrivs i del 2. En aspekt är separationen av variabiliteten i transporttiden och efterfrågan. En annan aspekt är i vilken utsträckning mindre variabilitet i transporttiden kan bidra till mer järnvägstransporter.
4De övriga rekommendationerna är inte direkt relaterade till beräkningarna av VTTV: förbättring av
kunskapen om de mindre väl studerade alternativkostnaderna (opportunity costs), en analys av hela CBA- struktur för godstransporter inklusive värdering av tidsvinster och förbättrad tillförlitlighet samt en tillämpning av den logistiska modellen inom den nationella Samgodsmodellen med sina befintliga mekanismer.
Tabell II: Aktiviteter för att uppskatta VTTV i tidigare förstudier, denna pilotstudie och rekommendationer för nästa steg
Rekommendationer i VTI:s förstudier
Täckt i denna pilotstudie Rekommenderad framtida forskning
Del 1 Att göra grundliga
bedömningar av de norska och holländska SP - studier
Den holländska VOTVOR-studien och de norska studierna (GUNVOR och PUSAM) har analyserats. Resultat: VTTV har störst betydelse för varuägare och speditörer och varierar över varugrupper Överföring av värden är i princip möjligt. Sverige kan lära av erfarenheterna i Nederländerna och Norge
För överföringar av värden krävs justeringar och ytterligare empiriska studier behövs
För järnväg finns det också ett behov av att enas om hur man uttrycker variabiliteten
Del 2 (a) För att utveckla
mekanismer och uppgifter som saknas i den logistiska modellen utanför modellen
Försiktighetsprincipen (teoretisk och empirisk för alla svenska transporter som ingår i Samgods -modellen)
För enkelhetens skull antas standardavvikelse och normalitet och endast buffertlagrets kostnader ingår som förebyggande kostnader
Innebörden av tunga svansar i fördelningen av de förseningar och tidiga ankomster måste studeras
Mer information om den erforderliga servicenivån behövs. En begränsad SP - studie skulle kunna genomföras
Olika typer av
försiktighetsåtgärder och kostnader måste inkluderas
Del 2 (b) Genomföra RP – studiers COOP fallstudie Fler fallstudier bör göras
- helst för stora avlastare och speditörer (för att täcka en stor andel av marknaden)
Del 2 (c) Att studera vidare
alternativa metoder (förutom SP-studier)
Marknadsbaserad modell Ansats måste utvecklas med hänsyn till särskilda företags
1
Part One: Evidence and Implications from Netherlands and
Norway
1.1
Implications of Dutch/Norwegian SP-studies for Swedish
freight VTTV
1.2
Objectives of the studies
In both Norway and The Netherlands Stated Preference (SP) studies in freight transport have been carried out recently (2009-2013) that provide – among other things- monetary values for reliability in freight transport for use in project appraisal.
In Norway this actually concerns two studies (besides the separate Norwegian passenger value of time and reliability study):
The multimodal GUNVOR project that was carried out to gain more insight into the valuation of freight reliability and develop methods to assess this value using SP studies as well as to obtain unit values for transport time and reliability in freight for application in cost-benefit analysis (CBA).
The rail-based PUSAM project that aims at improving rail transport
reliability by developing decision support tools, including an SP study on the value of time and reliability in rail freight transport.
The Dutch project, VOTVOR, was carried out to establish values of time and reliability for all modes in freight transport for use in CBA. The same VOTVOR study also treated passenger values of time and reliability.
In Norway, these were the first freight SP studies of this kind; in The Netherlands the study replaces older SP-based values of freight transport time savings and adds values of reliability to this.
In Annex 1 and 2 the two Norwegian SP freight studies and the Dutch one are described in more detail. These annexes also include references to the original material.
1.3
Definition of reliability
1.3.1 Reliability in the model
In the models estimated on the SP data and in the values recommended for use in CBA that were derived from those models, reliability is defined as the standard deviation of the transport time distribution (though scheduling terms were sometimes tried in the modelling as well). The same definition was used for the recommended values in passenger transport. The main reason for choosing this definition was that transport models are needed to supply quantity changes in reliability, and that the standard deviation is relatively easy to integrate in these models.
An exception to this rule is rail freight transport in Norway, where the recommended values for reliability are in terms of expected delays.
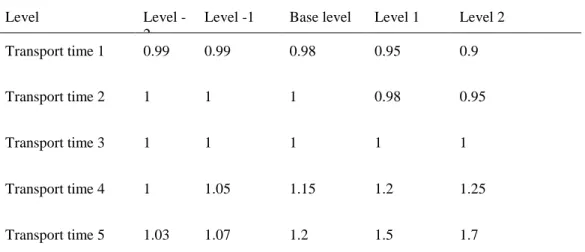
1.3.2 Reliability as presented to the respondents in the survey
Since many respondents would not understand the concept of standard deviations, the presentation of reliability to the respondents in the SP experiments is different. GUNVOR, PUSAM and VOTVOR include at least one choice experiment where
reliability is presented within a single choice alternative as a series of five transport times that are all equally likely to happen. These are presented verbally not graphically, which worked best in extensive pilot surveys in The Netherlands.
GUNVOR also used a presentation format with a certain delivery in one of the two alternatives on a screen and a length of the delay with some probability in the other alternative. This format was also used in PUSAM.
The Dutch study provides values of time and reliability that refer to the transport personnel and vehicle costs of providing transport services as well as the cargo-related values (e.g. interest costs on the goods in transit, disruption of the production process due to missing inputs), since this is how the CBA for transport projects in The
Netherlands works. The recommend values from the Norwegian study refer to the cargo component only. For CBA in Sweden the recommended values should also only relate to the cargo component, not the transport services. The Dutch results can however be split into both components (and in fact, for the value of reliability, the transport service component was not significant and only the cargo component matters).
GUNVOR and VOTVOR are about door-to-door transports and consequently about transport time and its variation at the receiver of the goods. PUSAM on the other hand deals with transport time between railway terminals only.
1.4
The SP survey
1.4.1 Why use SP data here?
In the survey design stage in both Norway and the Netherlands, other approaches than SP were considered. Revealed Preference (RP) surveys were not chosen as the main data base, because it is difficult to get RP data where time, costs and reliability are not heavily correlated and where there is still sufficient variation in these variables (that should relate to chosen and non-chosen alternatives) for estimation.
The buffer stock approach (or: ‘logistics costs function’ approach) was mentioned in both countries, but not selected because no examples were known of empirical applications for estimating the value of reliability using this approach.
1.4.2 Design of the SP survey
In GUNVOR, PUSAM and VOTVOR the questionnaires first asked questions about the firm and then about a specific transport/shipment that was carried out in practice by or for the firm. The attribute values are based on the reported attribute values for this reference transport/shipment, which can be considered good practice in SP survey design.
Then follows a series of SP choice experiments. All of these use binary choices between choice alternatives that both refer to the same mode. GUNVOR, PUSAM and
VOTVOR first have an experiment with only two attributes: transport time and transport cost. This is only relevant for the VTTS.
After that all three surveys continue with an experiment with transport costs and with reliability in the form of five equi-probable transport times. These experiments are similar but not quite the same:
The Dutch experiment also contains as a separate attribute presented in the SP the usual transport time; the Norwegian GUNVOR study left it
out (showing that it is not needed) and inferred the mean transport time from the series of five transport times.
The Dutch study also presents departure time and five arrival times (corresponding with the five transport times and the departure time), so that the respondents can easily see the scheduling consequences of delays. In one experiment the most likely arrival time is fixed, in another it varies.
The statistical design used is different.
Whereas the third and final Dutch SP experiment is a variant of the second (initially the most likely arrival time varies, later it is fixed), the two Norwegian studies use a
different format with risk of a specific delay instead of the five transport times.
The Dutch study has 19 SP choice situations in total (6+6+7), the two Norwegian ones have 20 (8+6+6). The Norwegian studies always present the reference cost and time in one of the alternatives; in VOTVOR this is not necessary. VOTVOR and GUNVOR present both early and late arrivals, but in PUSAM only late arrival is considered. In the Dutch survey, there were specific experiments for carriers in sea and inland waterway transport that did not use the context of a door-to-door transport, but the context of waiting for a lock/bridge or of waiting to be loaded/unloaded at a quay in the port.
1.4.3 Who are the respondents?
GUNVOR and VOTVOR were targetted at: Shippers that contract transport out Shippers with own account transport
Companies providing transport services, such as carriers.
PUSAM only looked at customers (shippers and transport companies that act on behalf of the shippers, but do not operate the trains) of the rail operator CargoNet.
Shippers are in the best position to provide the components of the value of time and reliability that are related to the goods themselves, whereas carriers have the best knowledge to supply the transport services components. In the Dutch questionnaire, the shippers that contract out were specifically asked to only consider the aspects related to the goods. Similarly the carriers were specifically asked to only think about the
transport services, not about the goods. This set-up helped to obtain values with a clearer interpretation than previous surveys (including older Dutch SP surveys) that were ambiguous on this.
1.4.4 Recruitment and interview method
The shippers and carriers in GUNVOR and VOTVOR were recruited from various national company registers. The PUSAM respondents were taken from the customer data base of CargoNet. The Norwegian surveys approached the firms by email; VOTVOR used approach by phone.
The VOTVOR interviewers were carried out at the offices of the firm by professional interviewers as computer-assisted personal interviews (CAPI). This interview method has good possibilities for explaining the questionnaire and motivating the respondent,
but is expensive. GUNVOR and PUSAM were carried out online, which is considerably less expensive.
1.4.5 Sample size obtained
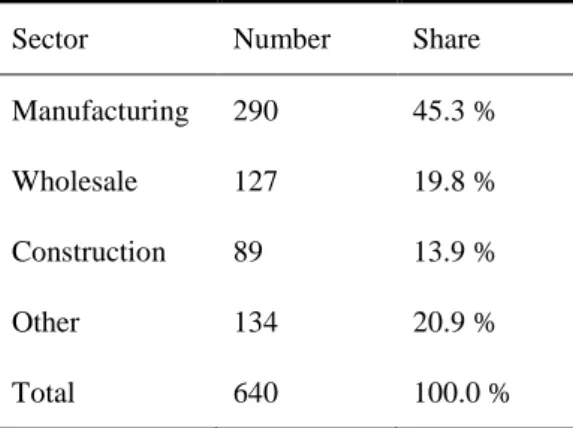
GUNVOR obtained responses from 117 transport firms and 640 shippers (including those that contract out and those that do own account transport), whereas VOTVOR had 315 carriers and 497 shippers as respondents.
These sample sizes are, in as far as we are aware, the largest ever achieved in SP research in freight transport. Nevertheless, compared to the SP sample sizes that are common in passenger transport, these are rather small samples and many of the more sophisticated models that are used in the analysis of passenger transport SP data cannot be supported by these freight SP data sets.
GUNVOR has a majority of observations from road transport (almost 80%), whereas VOTVOR has just over 50% for road transport, but also many respondents for inland waterways and sea transport (not so many for air and 50 respondents for rail, of which 35 shippers). The GUNVOR data contains 42 respondents in the shipper segment which have used rail transport for their shipment, making it possible to study this mode
separately.
PUSAM by definition only has respondents (34 in total) that use rail transport. Most are forwarders or consolidators, some are shippers.
1.5
Analysis of the SP survey
1.5.1 Data checks
All three data sets were checked for outliers and missing values, and these respondents were removed before estimation. In GUNVOR also respondents who had answered the questionnaire in less than 10 minutes were discarded (such situations did not occur in VOTVOR or PUSAM).
Respondents that do not involve in trade-offs between the attributes were kept in the estimation sample in all three surveys. But in the Norwegian studies attributes that are ignored by the respondent are eliminated from the model. These surveys asked the respondents at the end which attributes they had considered, and this information is used to identify attribute non-attendance. Such questions also appeared at the end of the VOTVOR questionnaire, but were not used in estimation.
1.5.2 Model specifications
A typical feature of freight transport is the large degree of heterogeneity, for instance in the time and costs attributes. This needs to be taken into account in the analysis.
The recommended values from GUNVOR, PUSAM and VOTVOR all come from multinomial logit models (MNL). More sophisticated models (e.g. mixed logit, latent class), as used in the Norwegian and Dutch passenger SP surveys, were not successful and stable when estimated on the freight SP data.
The number of interaction variables to explain heterogeneity in the coefficients for time and reliability in these models remained very limited.
The chosen MNL models in GUNVOR use a multiplicative error specification, as do the models in VOTVOR for carriers in road transport (the latter is a
log-willingness-to-pay space model). All Norwegian freight models use preference (utility) space. The chosen MNL models in PUSAM and those for all other carriers and for shippers in VOTVOR use an additive error term (and are formulated in preference space). These VOTVOR models all use a relative specification (all attributes measured relative to its reference value), which is one way of dealing with heterogeneity. This specification can only provide values of time and reliability when combined with information on the transport costs per hour.
In order to correct for repeated measurements (multiple SP choice observations on the same respondent), the Norwegian studies specify the user ID as a panel variable, whereas VOTVOR used the Jackknife method to correct for the possible bias (especially in the t-ratios).
In VOTVOR, joint models (with scaling factors) were estimated on all three SP experiments together. The Norwegian studies have different models for each SP experiment.
The chosen specification in GUNVOR and VOTVOR includes reliability in the form of the standard error (besides time and cost). The Norwegian studies have an alternative specification, used for the data from the third experiment that includes the expected delay as reliability variable, which is the preferred definition for rail transport (also from PUSAM) for the Norwegian studies.
1.5.3 Results
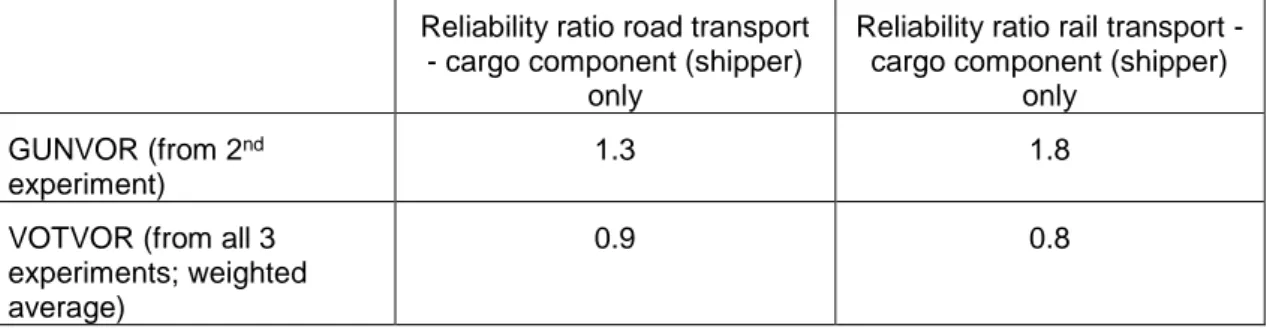
Below we focus on results for the VTTV (the various studies also give outcomes for the VTTS) for shippers (cargo component only), which is the appropriate VTTV for the Swedish CBA context (though this does not guarantee transferability). The reliability ratio in the table below is the ratio of the VTTV (using the standard deviation) to the VTTS.
Table 1 Comparison of outcomes for the VTTV (as the reliability ratio) from GUNVOR and VOTVOR
Reliability ratio road transport - cargo component (shipper)
only
Reliability ratio rail transport -cargo component (shipper)
only GUNVOR (from 2nd
experiment)
1.3 1.8
VOTVOR (from all 3 experiments; weighted average)
0.9 0.8
We see that the reliability ratios (RRs) for the cargo component only (as given by the shippers) is reasonably similar, with somewhat lower values for The Netherlands. For the carriers VTTV, both GUNVOR and VOTVOR found estimated coefficients for the standard deviation that were not significantly different from zero. (However, the valuation of delays in the third experiment in GUNVOR was somewhat higher than the VTTS.) If we would add the carriers VTTV of 0 to the shippers VTTV and divide this sum by the summed VTTS of the shipper and the carrier (where the carrier component is substantially larger than the shipper component), we get an overall RR that is much smaller than 1 (0.1 to 0.4).
The Norwegian team has so far recommended to use the PUSAM results for rail. The key result for the VTTV here is the value of expected delay, which for rail (weighted average) is 72 NOK per tonne-hour.
1.6
Current practice
1.6.1 What is used for VTTV (P-side of reliability)?
The current practice of CBA of transport projects in Norway is reported in the
handbooks by the Norwegian Public Roads Administration and the Norwegian National Rail Administration. The latter has recently been revised, while the former is due for revision.
In road transport, only known transport time savings are valued in the current practice and there is no cargo component in the VTTS. In rail transport, delays are given a higher weight than changes in known transport time both for passengers and freight. The current values of transport time savings and delays for freight are taken from the Norwegian freight model. These are considerably lower than those in the results
reported in this document, and the National Rail Administration is considering replacing them with the new values.
We expect that the new Dutch VTTSs and VTTVs will become the official transport CBA values in August 2013. At the moment, reliability benefits in The Netherlands are usually calculated as simply 25% of the travel time (passengers) or transport time (freight) benefits. More differentiated, though still preliminary, guidelines for the VTTV have been available since 2004/2005.
1.6.2 Variability forecasts (Q-side of reliability)
Concerning the prediction of variability, this has not been given very much attention in Norway. In the case of road transport, the current practice is as mentioned not to value changes in variability. In rail transport, the CBA tool of the National Rail
Administration contains a formula which estimates the amount of delays in hours based on the percentage of trains which are late. However, since the percentage late trains is not something which is estimated in the transport models normally used, this figure has to be based on some analysis which is specific to the project. Furthermore, for
passenger trains, delays are assumed to be the same for passengers getting off at all stations on the line.
The more detailed preliminary VTTVs in The Netherlands referred to in section 2.5.1 have been used in very few studies, because of the difficulty to predict changes in reliability and the impact of a project on reliability (only some prototype forecasting models are available to do this). Most project appraisals have used the 25% surcharge on the time benefits for the reliability gains.
The new VTTVs can also only be used in conjunction with forecasts of how infrastructure projects influence variability (in The Netherlands this is called the ’Q-side of reliability’). The development of such models for passenger and freight transport is planned, but still needs to be carried out. Some models explaining variability of transport time in road transport (passengers and freight) have already been estimated in The Netherlands on speed data from induction loop measurements on motorways.
1.6.3 Swedish freight SP experience
Before moving to the lessons that Sweden might learn from the Norwegian en Dutch experience from freight SP surveys that include reliability, it is good to look at freight SP surveys carried out in Sweden in the past.
The SP surveys carried out by Staffan Widlert (who was in close contact at the time with Hague Consulting Group that was doing a similar study in the Netherlands) in the early 90ties (Transek (1990) for road and rail freight transport and Transek (1992) for road freight transport) focused on the VTTS. However an attribute referring to
reliability was also included in the SP: the frequency of shipments arriving late (either on the same day or the next day). The outcomes for this definition of reliability are hard to translate to a value of the standard deviation of transport time or a reliability ratio. Both studies interviewed shippers (so in our interpretation the results can best be interpreted as for the cargo component only) and used face-to-face interviews. The models estimated are MNL model using a relative specification (attributes levels relative to those of the reference shipment).
The data from the 1992 Transek study have later been analysed by Erik Bergkvist, using different models (absolute levels for the attributes instead of relative) and estimation methods (weighted exogenous maximum likelihood). See for instance Bergkvist and Westin (2000).
The SP study by Inregia that also involved Mogens Fosgerau from Denmark (Inregia, 2001) also focused on the VTTS (for road, sea, rail and air transport), but included a measure of reliability in the SP. This measure was presented as the fraction of shipments (how many in a 1000 shipments) that is delayed. The respondents were shippers, so again the results should probably be interpreted as referring to the cargo component only. The interviews were done by phone. An MNL model (amongst other models) was estimated and it gives a value for the risk of delay expressed as a change of 1 per 1000 shipments. It is difficult to translate the outcomes for this definition of reliability into a value of the standard deviation of transport time or a reliability ratio. Xing Liu estimates VTTS for four commodity groups based on data form the Swedish Commodity Flow Survey (CFS 2001) and costs information form the Swedish national freight transport model Samgods as part of her PhD at Örebro University (which is planned to be finished in 2013).
1.6.4 Implications for the Swedish VTTV
The recent Norwegian and Dutch freight SP studies have shown that it is possible to derive plausible monetary values for the cargo-related component of reliability measured as the standard deviation of transport time by means of SP interviews with shippers and models estimated on these data.5 The finding in these studies that the transport services component of reliability should be equal to zero is somewhat unexpected (if reliability increases this would increase the predictability of the
deployment of transport vehicles and staff, which should have some positive value for the carrier). On the other hand, we expect that this value will be rather low and that the shipper component in reliability would dominate the picture (the reverse picture as for the full VTTS).
The easiest way for Sweden to use these findings would be a direct value transfer from these two countries to Sweden. If this would not be considered sufficiently reliable, the SP studies carried out so far in freight transport and especially recently in Norway and The Netherlands provide guidance on how a freight SP study can be carried out in Sweden. Below we discuss both options, one by one.
Direct value transfer
Road
In line with the practical recommendations from the Norwegian and Dutch SP studies and the German feasibility study (Significance et al. 2012b), reliability in road transport can best be expressed in the form of the standard deviation. What is required then for valuation of reliability is a direct money value for the standard deviation or a reliability ratio (in the latter case the monetary value can be derived using the VTTS).
Current overview studies on the VTTS in freight transport (Zamparini and Reggiani, 2007; de Jong, 2008; Feo-Valero et al., 2011) contain many results for the VTTS, but not for the VTTV.
The European Project HEATCO recommended using a reliability ratio for freight transport of 1.2 (note that this refers to the sum of the cargo and transport services component). This ratio was not directly based on empirical research but came from an international expert workshop convened at Schiphol airport and reported in Hamer et al. (2005). Most of the freight SP research before 2007, that included some measure of reliability, used the probability of late delivery for this. Translating such results into a reliability ratio is very hard and requires many assumptions (de Jong et., 2009).
Outcomes for the cargo component for road transport in terms of a reliability ratio have been obtained in the Norwegian GUNVOR study and the Dutch VOTVOR study. Fowkes (2006) also obtained reliability ratios for the UK. These refer to the sum of the cargo and the transport services component and at that level his RRs are broadly comparable to the Norwegian and Dutch results. So the road freight RR (cargo
component only) that might be transferred to Sweden should be based on the RR of 1.3 for Norway and 0.9 for The Netherlands. The mix of types of goods transported by road in Sweden has a more bulky character (and lower value densities) than in Norway and The Netherlands. This makes direct value transfer a risky prospect.
If one uses the RR for the value transfer, it may not be necessary to correct the RR itself for the difference in the mix of goods transported between countries. Since the VOR is defined as the VOT times the RR, differences in the VOR that arise because of
differences in the mix of goods transported might already be covered by differences in the VOT (for the cargo; VOTs for transport services do not differ much between commodity types). However it is also possible that there are additional differences between the countries that are reflected in differences in the RR and that amplify or reduce the differences that we see in the VOTs.
All one can say is that a value at the lower end or slightly below the above-mentioned values (say 0.9, 0.8) would be rather plausible. To get a value for the Swedish road transport, one needs to do an empirical study in Sweden, and an SP study would be an obvious candidate.
Rail
For rail freight the Norwegian study (PUSAM) has provided a recommended value of expected delay to be used within the current CBA framework of the National Rail Administration. It is however possible to derive an RR by combining the results from both studies. In the Netherlands the recommendation is to use the standard deviation also for rail freight. The choice between the two measures for Sweden should to a large extent depend on the question which measure can with the least effort be implemented in the Swedish transport forecasting models.
Again, as far as we are aware, the only potentially transferable values for the RR (using the standard deviation) for the cargo component in the rail VTTV come from the Norwegian GUNVOR study (1.8 and the Dutch VOTVOR study (0.8).
Alternatively for the expected delay, the preferred study in Norway for rail is PUSAM that obtained a value of 72 NOK per tonne-hour. Rail freight is Norway contains a large share of general cargo (in containers). In Sweden there is more focus in rail transport on bulk products. The same is true for The Netherlands, but these are often different bulk products (e.g. oil products, waste) than in Sweden. An RR for Sweden close to the Dutch value of 0.8 would therefore be plausible, but empirical work in Sweden itself would be required to obtain a value one could have more confidence in. The value of 72 NOK might be transferred as well, but a somewhat lower value for Sweden is not unlikely.
For all value transfers a good idea is to do sensitivity analyses: carry out the CBA for a range of VTTVs around the most likely value.
Implications for the design of an SP freight survey in Sweden
For obtaining values for the transport service component of the VTTS, SP studies are not strictly needed: these values can also be derived from the transport costs
calculations (assuming that in the long run all staff and vehicle costs are time-varying). The cargo component of the VTTS could be calculated on the basis of interest cost calculations, but it is likely that the cargo-related VTTS will contain more components than just capital costs (such as deterioration of the goods, disruptions of the production process or being unable to serve demand due to lack of stock). An SP survey among shippers then is a feasible way to find this component (more extended cost functions, preferably estimated on RP data, could be another).
With regards to the VTTV, a considerable simplification can be achieved by assuming that the transport service component of the VTTV equals zero and that there only is a cargo component that can be identified from the behaviour of the shippers. In the Norwegian and Dutch SP studies, the transport service component was not found to be significant and it is not likely to be a large component.
For identifying the VTTV, the standard cost functions that are used in transport models are not helpful as they do not vary with reliability. One can also try extended RP-based logistics costs functions (including buffer stocks, see chapter 3) for this, or launch an SP survey among shippers.
So the purpose of a possible SP freight survey for Sweden would be twofold: to obtain the cargo component in both the VTTS and the VTTV.
Should Sweden decide to carry out a freight SP study, many things can be learnt from the Norwegian and Dutch freight SP studies: aspects that they have in common can be
used again and where the studies differ one can try to choose the feature most appropriate for Sweden and so have the best of both worlds.
Recommended features of such an SP survey would be:
Base all SP experiments on the attribute values of a transport actually carried out for/by the shipper.
Do binary choice within-mode experiments.
Start with an experiment with time and costs only, then do an experiment in which reliability is added, presented in the form of a series of equally likely transport times (also present departure and possible arrival time). Mean or most common transport time does not have to be presented separately in this experiment. A third experiment could use the length of delay with some probability versus a certain delivery time.
Explain to the shippers that they should only take into consideration the implications for the cargo itself.
Include questions about attribute attendance at the end of the questionnaire, so that these can be used in the modelling.
Collect data for at least a few hundred shippers.
Sample firms from company registers, recruit by phone, confirm by email and interview on-line (this is much less expensive than CAPI, and has proven to produce credible results).
Test different MNL model specifications in the estimation phase (absolute versus relative models, additive versus multiplicative error term models, utility space versus willingness-to-pay space).
Combine data from several experiments in the same model, by a logit scaling approach
Correct for repeated measurements by using a panel specification in the model.
2
Part Two: New methods for estimating the freight VTTV
Part Two: New methods for estimating the freight VTTV is available at VTI and planned to be published 2014 as CTS working papers/articles.