1
Hydration and swelling of amorphous
cross-2linked starch microspheres
3Joanna Wojtasz,1# Jonas Carlstedt,1,2 Peter Fyhr,3 Vitaly Kocherbitov1,2*
4
1 Biomedical Science, Faculty of Health & Society, Malmö University, SE-205 06
5
Malmö, Sweden 6
2 Biofilms Research Center for Biointerfaces, Malmö University, SE-205 06 Malmö,
7
Sweden 8
3 Magle AB, Fjälkestadsvägen 336-15, SE-291 94 Kristianstad, Sweden
9
* Corresponding Author. E-mail: vitaly.kocherbitov@mah.se 10
11
# Present address: Wallenberg Wood Science Center, Forest Products and Chemical
12
Engineering, Chalmers University of Technology, SE-412 96, Gothenburg, Sweden 13
14
Keywords: Starch microspheres; hydration of starch; glass transition; sorption calorimetry; 15
DSC; X-ray scattering 16
18
Abstract 19
Hydration of cross-linked starch microspheres, commercially available as a medical 20
device, was investigated using a multi-method approach. We found that the uptake of water is 21
accompanied by substantial swelling and changes of the polymer structure. Sorption calorimetry 22
provided information about thermodynamics of water sorption, revealed presence of isothermal 23
glass transition and absence of hydration-induced crystallization, observed in non-cross linked 24
starch material. The changes in the surface and bulk properties of microspheres at different water-25
starch concentrations were investigated using synchrotron radiation X-ray scattering and analyzed 26
using concept of fractals. The obtained information, combined with the results of differential 27
scanning calorimetry, was used to construct a phase diagram of the studied material. Finally, 28
hydration induced evolution of polymer structure revealed by the X-ray scattering was linked to 29
the changes observed during swelling with optical microscopy. 30
1. Introduction 32
Starch is a biopolymer that is highly abundant in nature where it serves as energy storage 33
in plants. It is synthesized as densely packed granules and consists of the two polysaccharides 34
amylose and amylopectin. Because of the great availability and low price, starch has found a wide 35
range of applications in almost all branches of industry, e.g., in the food, paper, packaging and 36
pharmaceutical industry. Different physical and/or chemical modifications are often employed to 37
tune the properties of starch for practical uses. An example of a modern material obtained by 38
modification of starch is starch microspheres that are used for oral, nasal and intramuscular drug 39
delivery, i.e. for transporting active compounds into the body to achieve a desired therapeutic 40
effect in the target place. Examples of such formulations can be found in the literature and may 41
contain proteins or large molecular weight organic compounds (Edman, et al., 1992, Illum, et al., 42
1987, Illum, et al., 1990, Pereswetoff-Morath, 1998, Elfstrand, et al., 2006, Rodrigues and Emeje, 43
2012). Degradable starch microspheres are also in use as a medical device for acceleration of 44
wound healing by promoting hemostasis. The microporous starch particles are applied directly on 45
the wound site where they take up fluid from the blood and create a gel which stops the bleeding 46
(Björses, et al., 2011, Malmsjö, et al., 2011, Tan and Tope, 2004). 47
The hydration properties of native starch granules as well as modified starches have been 48
widely investigated since they are very important for most applications (Svensson and Eliasson 49
1995, Carlstedt 2014, Carlstedt 2015). In native starch granules only a minor part of the polymer 50
is mobile, most of the chains are densely packed and thus isolated from bulk water (Larsen, et al., 51
2008) while the chains of the amorphous starch microspheres are more accessible for water so 52
their structure resemble hydrogels: hydrophilic three-dimensional networks, held together by 53
chemical or physical bonds. Some examples of starch-based biodegradable hydrogels may be 54
found in the literature (Elvira, et al., 2002). 55
An important phenomenon related to hydration is the glass transition in the amorphous 56
parts of starch. Glass transitions of starch can be detected by, e.g., DSC (Thiewes and Steeneken, 57
1997). They can be caused by increase of temperature and/or addition of plasticizers, i.e. small 58
molecules such as water or glycerol, which shift the glass transition to lower temperatures 59
(Lourdin, et al., 1997). Interestingly, parts of the same chain can be in a crystalline whereas another 60
part in a disordered state in semi-crystalline polymers (Thiewes and Steeneken, 1997). 61
Another important aspect of hydration is the swelling of the material. In the drug delivery 62
systems release from the microspheres is conducted in the sustained swelling-controlled manner 63
(Fang, et al., 2008). When used for stopping bleeding, it is of particular importance that the starch 64
microspheres are highly absorbing so that they can prevent the blood flow. 65
In the present work hydration of cross-linked degradable starch microspheres was 66
investigated with a multi-method approach. Methods such as sorption calorimetry, small angle X-67
ray scattering, gravimetrical swelling, rheology and differential scanning calorimetry were applied 68
to characterize interactions of the amorphous starch and water. The aim of this study is to 69
investigate hydration of the material including its high absorption capacity and swelling properties. 70
In addition, we use X-ray methods to study structural rearrangements that accompany the 71
hydration of the studied material. The obtained data are collected in a temperature vs. composition 72
phase diagram of the starch microspheres – water system. 73
2. Materials and methods 74
2.1. Materials
The starch materials were provided by Magle AB (Kristianstad, Sweden). Spray-dried acid 77
hydrolyzed potato starch (maltodextrin) was produced by Lantmännen Reppe AB (Växjö, 78
Sweden). The degradable starch microspheres (DSM) are manufactured by Magle AB 79
(Kristianstad, Sweden) by emulsion crosslinking (polymerisation) of acid hydrolysed potato starch 80
with epichlorohydrin. Prior to measurements the starch material was dried at room temperature in 81
vacuum with 3 Å molecular sieves overnight. The samples were subsequently prepared by 82
equilibration with saturated salt solutions vapor or by adding liquid water. 83
2.2.2. Salt solutions
84
Seven different saturated salt solutions were used for setting up relative humidity: LiCl, 85
MgCl2, Mg(NO3)2, NaCl, KCl, KNO3 and K2SO4 with corresponding relative humidity values
86
(RH%) 11.30, 32.80, 52.90, 75.30, 84.30, 93.28 and 97.30(Greenspan, 1976). Prior to use, the 87
saturated salt solutions were equilibrated for a few weeks at room temperature. 88
2.2. Scanning Electron Microscopy
89
The morphology of dry starch microspheres was examined with a scanning electron microscope 90
(Zeiss EVO LS10 SEM). The experiments were performed at 25°C in vacuum at an acceleration 91
potential of 2kV. The material was dried in vacuum prior to examination to ensure minimal 92
moisture content, and then deposited on a graphite covered standard sample holder. 93
The obtained micrographs were analyzed with respect to morphology and size of the 94
microspheres. The size was established as the mean value of the diameters measured horizontally 95
and vertically for each particle as a distance in pixels. The value was then converted from pixels 96
to µm using the size of the scale bar. 97
2.3. Sorption calorimetry
Hydration of starch at 25°C was investigated with sorption calorimetry. During the 99
experiment, the water activity aw and the hydration enthalpy 𝐻𝐻𝑤𝑤𝑚𝑚𝑚𝑚𝑚𝑚 are measured simultaneously
100
as a function of water content (Wadsö and Markova, 2002). As all physical and chemical processes 101
are accompanied by release or absorption of heat, sorption calorimetry provides information about 102
the processes occurring within the sample. 103
The measurements are performed in a two-chamber calorimeter cell inserted in a double-104
twin microcalorimeter (Wadsö and Wadsö, 1996). The thermal powers from the two chambers are 105
recorded and the thermal power of evaporated water recorded in the vaporization chamber is used 106
to calculate the water activity using an earlier proposed equation (Kocherbitov, 2004) 107
The partial molar enthalpy of mixing of water is calculated from the relation below: 108
𝐻𝐻𝑤𝑤𝑚𝑚𝑚𝑚𝑚𝑚 = 𝐻𝐻𝑤𝑤𝑣𝑣𝑣𝑣𝑣𝑣+ 𝐻𝐻𝑤𝑤𝑣𝑣𝑣𝑣𝑣𝑣 𝑃𝑃
𝑠𝑠𝑠𝑠𝑠𝑠𝑠𝑠
𝑃𝑃𝑣𝑣𝑣𝑣𝑠𝑠 (1)
109
Where 𝑃𝑃𝑠𝑠𝑠𝑠𝑠𝑠𝑣𝑣 and 𝑃𝑃𝑣𝑣𝑣𝑣𝑣𝑣 are the thermal powers recorded in the sorption and vaporization 110
chambers, and 𝐻𝐻𝑤𝑤𝑣𝑣𝑣𝑣𝑣𝑣 is the molar enthalpy of vaporization of pure water (44.0 kJ/mol at 25°C). 111
2.4. Optical microscopy
112
An optical microscope (Nikon OptiPhot) was employed to investigate morphological 113
changes and swelling of starch microspheres caused by addition of liquid water. Dry microspheres 114
were placed directly on glass slides and their behavior upon hydration was captured in form of a 115
movie. The recorded movies were subsequently analyzed in terms of changes in size of the 116
microspheres by comparison of the sizes in pixels before and after swelling. 117
2.5. Gravimetric swelling study
118
To analyze the swelling limit and water absorption capacity five samples of 1-5 wt% of 119
starch microspheres in water were prepared. After equilibration the suspensions were separated by 120
based of the masses of the water used to prepare the suspension and the mass of the 122 supernatant: 123 𝑚𝑚𝑤𝑤,𝑣𝑣 = 𝑚𝑚𝑤𝑤 − 𝑚𝑚𝑠𝑠𝑠𝑠𝑣𝑣 (2) 124
where 𝑚𝑚𝑤𝑤- mass of water used to prepare suspension, 𝑚𝑚𝑠𝑠𝑠𝑠𝑣𝑣- mass of the supernatant. 125
The degree of swelling expressed as the ratio of the absorbed mass to the mass of dried 126
microspheres was calculated based on the swelling study: 127
Q𝑚𝑚 = 𝑚𝑚𝑚𝑚𝑤𝑤,𝑣𝑣𝑠𝑠 =𝑚𝑚𝑠𝑠𝑚𝑚−𝑚𝑚𝑠𝑠 𝑠𝑠 (3)
128
where Q𝑚𝑚- degree of swelling, 𝑚𝑚𝑣𝑣- mass of particles, 𝑚𝑚𝑠𝑠-mass of starch used to prepare 129
suspension. 130
2.6. Rheology
131
Viscosities of suspensions of microspheres with concentrations ranging from 0.5 to 2 wt% 132
were determined with a capillary viscometer calibrated with miliQ water. A measurement is 133
performed by first pumping up the suspension into a glass capillary. Then the time required for the 134
liquid to flow, due to gravity, between two points marked on the capillary was measured. The 135
viscosity was calculated based on the Hagen-Poiseuille equation which relates the pressure drop 136
in the fluid flowing through the tube to the viscosity of the fluid (Hagen, 1839, Poiseuille, 1841) 137
∆𝑃𝑃 =8𝜂𝜂𝜂𝜂Δ𝑉𝑉Π𝑠𝑠4Δ𝑡𝑡 (4)
138
Where: η – viscosity, ΔP- the pressure drop, ΔV- volume of the fluid, Δt – time required for the 139
liquid to flow between marked points, L - length of the capillary, r –radius of the capillary. 140
For each suspension an average of 10 measurements was calculated and compared with the value 141
obtained for pure water which has a known viscosity. 142
2.7. Differential Scanning Calorimetry
Several concentrations of starch – water mixtures were analyzed with a DSC (DSC 1 Mettler 144
Toledo). Samples were placed in 40 µl aluminum crucibles, hermetically sealed and after 145
equilibration scanned in temperature ranges between -80°C and 160°C at a scanning rate of either 146
1°C/min or 10°C/min. Indium was used as calibrant and an empty aluminum crucible (40 µl) was 147
used as a reference. A dry nitrogen gas flow of 80 ml/min was applied in the furnace chamber of 148
the DSC instrument. 149
2.8. Small-angle X-ray Scattering (SAXS)
150
Structural aspects of the microspheres were studied using small-angle X-ray scattering 151
(SAXS). The experiments were performed at the MAX IV Laboratory, Lund, at beamline I911-152
SAXS (Labrador, et al., 2013). The wavelength of the beam was 0.91 Å and the sample to detector 153
distance was 1340 mm. The software Fit2d was used for data evaluation (Hammersley, 1997). 154
Background subtraction (empty solid sample holder) was performed using program written in 155 Matlab. 156 157 3. Results 158
3.1. Scanning electron microscopy
159
SEM micrographs reveal the variety of shapes and sizes of the investigated starch 160
microspheres (Figure 1). Most of the microspheres appear as solid, non-damaged, round shaped 161
particles with sharp contours and coarse surface, whereas a few appear to have a smoother surface. 162
The starch microspheres do not form aggregates. 163
164
Figure 1. SEM pictures of dry starch microspheres at various magnifications. 165
3.2. Sorption calorimetry
166
Sorption of water by the starch microspheres was studied with sorption calorimetry and 167
compared to our earlier data for acid hydrolyzed starch – an intermediate material used in the 168
production (Carlstedt, et al., 2014). The sorption isotherms show the relation between water 169
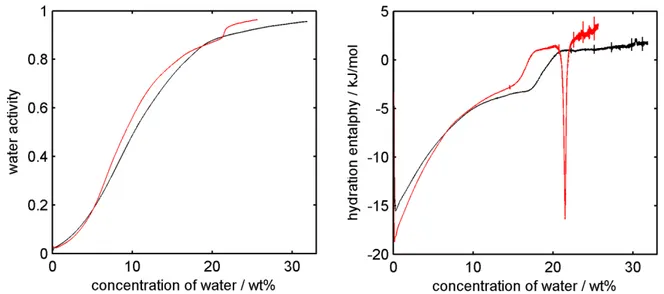
activity and amount of water absorbed by the sample, see Figure 2. 170
The enthalpy plot presented in Figure 2 shows that the hydration of starch is initially an 171
exothermic process. Moreover, a thermal event in form of a step in the enthalpy plot between 17.2 172
and 21.1 wt% of water is visible. 173
174
Figure 2. Water sorption isotherm (a) and enthalpy of hydration (b) of starch microspheres 175
(black) and acid hydrolyzed potato starch (red) obtained with sorption calorimetry at 25°C. 176
177
3.3. Optical microscopy
178
Optical microscopy was used to visualize the microspheres in the presence of different 179
amounts of water and to track the swelling of the individual particles. It was observed that the 180
microspheres in the presence of water change their shape, size and general appearance: dry 181
particles are dark while hydrated are transparent (Figure 3.). The structural changes observed upon 182
hydration of the microspheres are discussed in section 4.4. 183
184
Figure 3. Starch microspheres in the presence of water. From left top corner: 10, 20, 30, 186
41, 50, 59, 73, 82, 92 and 100 wt% of starch. 187
188
Moreover, in the presence of liquid water the microspheres undergo rapid swelling (Figure 189
4). The change of size is substantial: comparison of the sizes before and after contact with water 190
made for 20 particles showed that the diameter increase on average 2.1 ± 0.2 times. No further 191
swelling was observed after 16 s. 192
193
194
Figure 4. Swelling of starch microspheres captured by optical microscopy. Some 195
additional microspheres were transferred into the observed area by water. 196
3.4. Gravimetric swelling study
197
To further evaluate the swelling process, a gravimetric swelling study was performed as 198
described above. A linear correlation between the mass of absorbed water and the mass of starch 199
used for preparation of the suspension was found (Figure S1 in supplementary information). It 200
should be noted that the line obtained by linear regression does not cross the (0,0) point on the 201
graph because of an experimental error that is caused by some amount of water on the phase border 202
4s
0s 2s
particles is dependent on the amount of starch, i.e. the more starch there is the larger the error. 204
Thus the constant in the linear equation may be attributed only to the experimental error brought 205
by the separation method. According to the results, the swelling degree is equal to 10.6 g/g. 206
3.5. Rheology 207
The viscosities of the dilute suspensions of starch microspheres were determined with a 208
capillary viscometer. A linear relation between the relative viscosity and the concentration of 209
starch between 0.10 and 1.55 wt% was observed (Figure S2). To estimate the volume fraction of 210
swollen starch particles in dilute suspension, the Einstein equation for viscosity of a dilute 211
suspension of hard spheres was applied (Einstein, 1906): 212
𝜂𝜂𝑠𝑠 = 2.5𝜙𝜙 + 1 (5)
213
where: 𝜂𝜂𝑠𝑠 = 𝜂𝜂𝑠𝑠𝑠𝑠𝑠𝑠𝑠𝑠𝑠𝑠𝑠𝑠𝑠𝑠𝑠𝑠
𝜂𝜂𝑠𝑠𝑠𝑠𝑠𝑠𝑣𝑣𝑠𝑠𝑠𝑠𝑠𝑠 – relative viscosity, ϕ – volume fraction of swollen spheres. Obtained
214
values were plotted against the concentrations in Figure S2. 215
3.6. Differential Scanning Calorimetry
216
In order to investigate thermal events in the starch-water system differential scanning 217
calorimetry (DSC) was employed. Melting of water was observed in samples containing up to 218
70 wt% of starch microspheres; an example of the melting peak is presented in Figure 5(a). For 219
samples with starch concentrations ranging from 20 to 70 wt%, the glass transition step was 220
observed before the ice melting peak, while in more concentrated samples it was observed as a 221
single step (Figure 5(c)) or together with an additional endothermic peak (Figure 5(b)). 222
223
Figure 5. DSC scans for samples of different concentrations of starch microspheres (a) 224
40.6 wt% scanned at 1°C/min, (b) 81.69 wt% at 1°C/min, (c) 89.30 wt% at 1°C/min, (d) 225
92.45 wt% scanned at 10°C/min, 1st (red) and 2nd scan (black). 226
227
In low moisture samples (above 80 wt% of starch) an additional endothermic peak may be 228
observed (Figure 5(b,c,d)). This peak is not present in the second scan performed directly after 229
first scan (Figure 5(d)); however, it generally re-appears upon storage at room temperature. We 230
assign this peak as originating from a sub-Tg transition (see discussion section). 231
The dependence of the enthalpy of melting of ice on the concentration of water has a 232
pronounced linear character (Figure S3 in supplementary information). Based on this linear 233
dependence, the amount of non-freezing water in starch microspheres was determined to be 234
27.4 wt% or 0.38 g/g, which corresponds to on average 3.4 water molecules for each repeating 235
(a) (b)
(d) (c)
237
3.7. Small-angle X-ray scattering (SAXS)
238
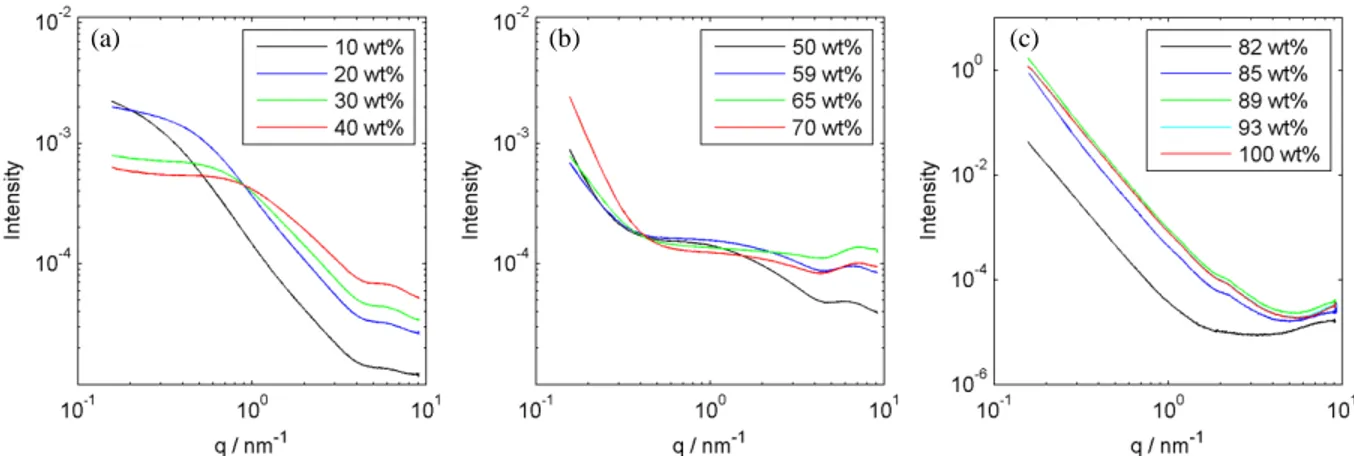
Small-angle X-ray scattering (SAXS) was used to investigate structural aspects of the 239
starch microspheres. Figure 6 shows curves obtained for mixtures of starch and water with 240
different concentrations. No clear Bragg peaks were detected in the whole concentration range, 241
however, the shapes of the curves change with concentration, which will be further discussed in 242
the Discussion section below. 243
244
Figure 6. SAXS curves for samples of 10 to 40 (a), 50 to 70 (b) and 82 to 100 wt% of 245
starch microspheres (c). 246
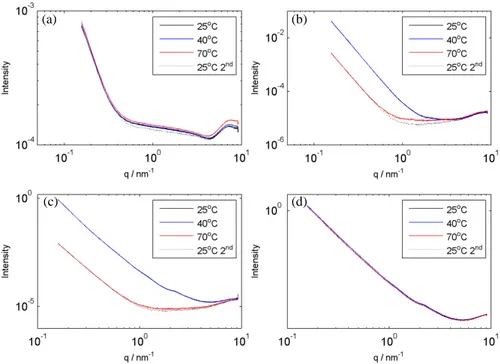
Samples were studied at 25, 40 and 70°C. As presented in Figure 7, for the samples of 82 247
and 85 wt% a decrease of intensity was observed after heating above 40°C. It was also noticed that 248
for the scans performed after cooling the sample back to 25°C, the curves coincided with the high 249
temperature curves and not with the initial ones at 25°C, suggesting an irreversible change. 250
(c) (b)
251
Figure 7. Temperature dependences of SAXS curves for 65 (a), 82 (b), 85 (c), and 89 (d) 252 wt% of starch. 253 254 4. Discussion 255 4.1. Water sorption 256
The sorption isotherms and enthalpies of hydration of starch microspheres and acid 257
hydrolyzed starch are presented in Figure 2. The enthalpy plot shows that the hydration of the 258
starch microspheres is initially an exothermal process. It should be noted that the enthalpy of 259
hydration at zero water content is close to -18 kJ mol-1, a value found for several biopolymers
260
(Kocherbitov, et al., 2004, Kocherbitov, et al., 2008, Kocherbitov, et al., 2010, Znamenskaya, et 261
al., 2012). Moreover, for starch microspheres a step in the enthalpy plot was noted. It occurs at a 262
water activity of 0.85, which corresponds to 18.9 wt% of water and indicates a glass transition - a 263
transition of a polymer from a glassy, rigid into a flexible state and is caused by the addition of 264
(a) (b)
(d) (c)
2011). Although, the glass transition is very seldom so clearly visible in sorption calorimetry, it is 266
also present in the acid hydrolyzed starch (red curve in Figure 2). For that material it appears at 267
lower water concentration and is followed by an exothermic peak, which has been attributed to 268
hydration-induced crystallization (Carlstedt, et al., 2014). 269
The sorption isotherms of both materials initially follow the same dependence but at a 270
water activity around 0.2 they start to diverge and the starch microspheres absorb more water. 271
Additionally, a step in the sorption isotherm of acid hydrolyzed starch should be noted. It appears 272
in the same water activity as the endothermic peak and is thus attributed to crystallization. In 273
summary, our data show that the introduced cross-links in the starch microspheres prevent the 274
material to crystallize and enable a higher water absorption capacity. 275
4.2 Swelling in liquid water
276
Optical microscopy revealed that the sorption of water results in a rapid and substantial 277
swelling of the starch microspheres. Quantitative evaluation of this process is a non-trivial task; 278
therefore, three different methods were used to quantify swelling: optical microscopy, gravimetric 279
analysis and viscosimetry. 280
The swelling starts immediately when starch is in contact with high humidity or liquid 281
water and, when fully hydrated, the diameter of the particle becomes 2.1 ± 0.2 times larger than 282
the dry particle, which results in 9.3 times larger volume if spherical shape is assumed. Based on 283
these numbers, the degree of swelling (mass of water per mass of dry starch) is about 5.2. The 284
details of calculation are shown in Supplementary materials. It should be noted that there is some 285
inaccuracy in the size determination of the dry particles that introduces some error to the method. 286
This comes from the fact that a microscope image of a dry particle is a projection of this particle 287
in fact smaller than the measured value, the swelling is thus larger and as a result the swelling 289
factor should be higher. 290
Another method used in this work to evaluate the water uptake was gravimetric analysis, 291
based on a linear relation between the amount of starch and the mass of absorbed water. The 292
obtained degree of swelling was 10.6. 293
The third method used in this work to calculate the degree of swelling was based on the 294
rheology data. As described above, the relative viscosity may be recalculated to volume fraction 295
of particles according to Einstein’s equation (eq. 5). From the volume fraction of particles, the 296
degree of swelling is estimated to be 10.7 (details of calculations are in Supplementary materials). 297
Summing up, the swelling is substantial and based on optical microscopy, the gravimetric 298
swelling study and viscosimetry, the degree of swelling is 5.2, 10.6 and 10.7 g/g respectively. The 299
first of the three values is less reliable because of difficulties in measuring the size of dry particles. 300
The literature data suggest that the degree of swelling is higher for porous starches and is dependent 301
on the degree of cross-linking (Gao, et al., 2014). Thus, the high water absorption capacity can be 302
considered as high porosity in the presence of water. Considering the swollen particle as a gel 303
made up of starch and water we can calculate the volume porosity of this structure: 304 𝑝𝑝𝑝𝑝𝑝𝑝𝑝𝑝𝑝𝑝𝑝𝑝𝑝𝑝𝑝𝑝 =𝑉𝑉𝑠𝑠−𝑉𝑉𝑠𝑠 𝑉𝑉𝑠𝑠 = 𝑚𝑚𝑠𝑠𝑑𝑑𝑠𝑠−𝑑𝑑𝑠𝑠𝑚𝑚𝑠𝑠 𝑚𝑚𝑠𝑠𝑑𝑑𝑠𝑠 = 87% (6) 305
where: 𝑉𝑉𝑣𝑣 – volume of the swollen particles, 𝑉𝑉𝑠𝑠 – volume of dry starch used for preparation of 306
the suspension, m –mass, d – density (subscripts have same meanings as for volumes). It should, 307
however, be stressed that this value represents porosity induced by water, in the dry state the 308
porosity is much lower. 309
The DSC data allow calculation of the amount of non-freezing water that cannot easily 312
crystallize due to presence of polymer chains. An analysis of the enthalpies of melting of ice shows 313
that the amount of non-freezing water for starch microspheres is equal to 0.38 g of non-freezing 314
water per 1 g of starch (3.4 water molecules per repeating unit of starch). This data was compared 315
with values established for native and acid hydrolyzed potato starches (0.35 and 0.34 g/g 316
respectively) showing that the amorphous material contains higher fraction of non-freezing water 317
than those that were reported to be partially crystalline (Carlstedt, et al., 2014). 318
For the concentrated samples the glass transition temperature shows a strong dependence 319
on the composition of the sample which results in a very steep line when plotted. For the samples 320
below 70 wt% of starch, the glass transition occurs in the water melting region and in the phase 321
diagram is represented by a horizontal line at -12°C (the midpoint of the transition, the onset is at 322
-18°C). It corresponds to a boundary between two two-phase regions consisting of ice + flexible 323
polymer and ice + glassy polymer. The glass transition temperature in this region is independent 324
on the amount of water since the composition of the polymer phase does not change. While going 325
along this line on the phase diagram the ratio between the two phases changes but not the phases 326
composition. 327
In low moisture samples an endothermic peak was observed for temperatures between 40 328
and 60°C. This event was not present in a second scan performed immediately after the first scan. 329
Although the peak was not present in a the second scan, it re-appeared upon storage at room 330
temperature, indicating relaxation towards equilibrium of a glassy state (Chung, et al., 2004), so it 331
might be interpreted as the sub-Tg endotherm known from other starch materials (Thiewes and
332
Steeneken, 1997). This phenomenon has been referred to as enthalpy relaxation, enthalpy recovery 333
physical aging of the material (Elfstrand, et al., 2006, Vinu, et al., 2003, Yalkowsky and 335
Dannenfelser, 1992). Another explanation is based on the starch-water interactions (Appelqvist, et 336
al., 1993). Additionally, the temperature and enthalpy of this peak in the present system expressed 337
a dependence on starch content (see phase diagram below and Figure S4, Supplementary 338
Information). 339
Based on the data obtained by DSC and sorption calorimetry a phase diagram was 340
constructed, see Figure 8. The water melting temperature was calculated by extrapolating the DSC 341
data to zero scan rate. The border between the one and the two phase regions was estimated based 342
on the swelling studies and the short vertical line for the water melting was established based on 343
the amount of non-freezing water. 344
345
Figure 8. The phase diagram for the starch microspheres – water system, • glass transition,○ -346
glass transition from sorption calorimetry, ∆-sub-Tg, ∇- melting of ice. 347
4.4 Structural changes
349
Small-angle X-ray scattering (SAXS) was used for structural studies of starch 350
microspheres. No peaks were found which indicates absence of crystalline structure. However, the 351
curves clearly show several regimes. Four regimes were selected within the plots (Figure 6), their 352
extensions vary with starch concentration. The slopes of the linear regimes were evaluated to 353
obtain the fractal dimensions. For surface and mass fractals respectively, scattering intensities 354
scale in the following way (Roe, 2000): 355
𝐼𝐼(𝑞𝑞) ∝ 𝑞𝑞−(6−𝑑𝑑𝑠𝑠)
356
𝐼𝐼(𝑞𝑞) ∝ 𝑞𝑞−𝑑𝑑𝑓𝑓 (7)
357
where: I – intensity, q - scattering vector, 𝑑𝑑𝑠𝑠 – surface fractal dimension, 𝑑𝑑𝑓𝑓- mass fractal 358
dimension. 359
The first regime at low q values is linear. This regime is clearly pronounced in samples 360
with low moisture (Figure 6(c)). This region can be attributed to the characteristics of the surface 361
of the particles. The second regime is a plateau; its position and length varies between the samples. 362
At higher q there is another regime with a pronounced slope. It is clearly visible for concentrations 363
below 50 wt% (Figure 6(a)) and the slope characterizes the state of the polymer chains. Finally, 364
the last regime (q>4 nm-1) represents scattering from individual glucose units of starch chains 365
(Carlstedt, et al., 2014). 366
The slope in the first regime (surface regime) depends on starch concentration (Figure S6a). 367
For dry substance the values of the slopes are close to -4 and the surface fractal dimension is 2, at 368
70 wt% the slope changes up to approx. -3 (fractal dimension is 3) and continues changing at lower 369
concentrations. The change of the surface fractal dimension indicates an increase in roughness in 370
In higher humidity a thin water layer around the surface provides some mobility to those chains so 372
they may protrude from the surface resulting in some roughness. In the presence of substantial 373
amounts of water the whole structure starts to change resulting in changes in the overall shape of 374
the surface (cf. Figure 3). 375
The change in the intensities in the first regime finds explanation in the different interfaces 376
and contrasts. For dry particles the starch-air interface provides good contrast and high intensities 377
in the surface regime. At higher hydration levels, when the system approaches the glass transition, 378
the particles may undergo structural rearrangements at the surfaces leading to decreased surface 379
area, which decreases the scattering intensity. 380
A transition was noted in the SAXS plots for low moisture samples as a change in the plot 381
shape between 70 and 85 wt% of starch. The change is also visible in the temperature scans 382
between 40 and 70°C (Figure 7) and corresponds to the temperature range at which both the glass 383
transition and the sub-Tg occur. Moreover, the curves do not regain their original shape when 384
cooled and in the surface regime shift to lower intensities without change in shape. This might 385
indicate that this transition is related to the sub-Tg. However, the absence of this event in more 386
concentrated samples indicates rather a glass transition. That may be also supported by the phase 387
diagram presented above. However, the glass transitions do not cause changes in the structure so 388
they should not be visible in SAXS. Therefore, the observed changes in the scattering pattern 389
correspond to structural changes that accompany the glass transition. The glass transition makes 390
structural changes possible because it triggers the mobility of the material. As the change involves 391
decreased intensity and the scattering occurs on the surface, the structural change is attributed to 392
the decrease of surface area. This rearrangement is driven by minimization of the free energy by 393
minimizing the surface area and it is possible only when the chains are in the flexible state. 394
The further decrease of intensity is attributed to elimination of a part of the interface as the 395
flexible swollen tightly packed particles adjust shapes to each other (see Figure 3). Finally, in the 396
most dilute samples the particles are fully swollen and become round again but it is not reflected 397
in the scattering curves as a consequence of low contrast at the water – hydrated particle interface. 398
The slopes of the third regime also vary substantially, showing positive dependence on 399
concentration of starch. The scattering arises from the polymer chains and the mass fractal 400
dimension is related to the Flory exponent: 401
𝑣𝑣 =𝑑𝑑1
𝑓𝑓 (8)
402
where: v- Flory exponent, 𝑑𝑑𝑓𝑓-mass fractal dimension. The Flory exponent gives information about 403
the conformation of the polymer in the solution, as it relates the molecular mass of the polymer to 404
its radius of gyration: 405
𝑅𝑅𝑔𝑔 ∝ 𝑀𝑀𝑣𝑣 (9)
406
where: 𝑅𝑅𝑔𝑔- radius of gyration, M – molecular mass. Typical conformations of a polymer in solution 407
include stiff rod (v=1), random coil (1>v>1/3) and compact globule (v=1/3)(Flory, 1949). A Flory 408
exponent equal to 0.5 reflects a random walk polymer conformation, while the value of 0.58 409
corresponds to self-avoiding chains. 410
For the most dilute samples the slopes are close to -1.7, which corresponds to Flory 411
exponent of 0.59. The slope value increases (becomes less negative) with starch concentration 412
indicating that the chains become straighter with increasing starch concentration. This behavior 413
may be attributed to intrinsic tensions in the particles, introduced by the cross-links, causing 414
straightening of the chains upon drying. 415
Correlations between SAXS and optical microscopy results can be seen. As shown, at room 416
3 shows, the dry particles are round and at concentrations below 80% they appear slightly brighter 418
and they adhere to each other which may correspond to the rearrangements discussed based on the 419
SAXS data. Subsequently, a change in the appearance of the particles occur around 50 wt% when 420
they swell and appear as separate particles. The changes were also visible on macroscopic scale; 421
the samples went from lumps into paste. It should be noted that in this concentration range a border 422
between two types of behaviors in SAXS was observed. Finally, the hydrated microspheres are 423
clustered close to each other and adjust shapes to adjacent particles which leads to the discussed 424
lack of contrast. 425
To sum up, the dry starch microspheres have a fully amorphous structure that changes in 426
the aqueous environment. In the dry state the material forms spheres with smooth surfaces. During 427
hydration, the chains undergo glass transition followed by decrease of surface area. At higher water 428
contents the chains start to protrude from the surface, which increases the roughness on a nm level. 429
Further increase of water contents changes chain conformation in the bulk from stretched to self-430
avoiding random chains. 431
432
5. Conclusions 433
Employing a multi-method approach, we have examined the properties of starch microspheres 434
and the effects of their hydration and found that: 435
• Starch microspheres swell rapidly in contact with water and increase their volume 436
substantially. The degree of swelling at room temperature determined with different 437
methods is 10.6 438
• The hydration of starch at 25°C is initially an exothermic process, and the enthalpy 439
plots suggest that the glass transition occurs at a water activity of 0.85, which 440
corresponds to 18.9 wt% of water. 441
• The glass transition temperature is -12°C at starch concentrations 0-70 wt%; above 442
that concentration it increases with a steep dependence on starch concentration. 443
• The sub-Tg endotherms were detected in DSC curves for low-moisture samples at 444
temperatures between 45 and 63°C; the dryer the sample the higher the sub-Tg 445
endotherm temperature. 446
• The amount of non-freezing water in starch microspheres is 0.38 g/g which 447
corresponds to 3.4 water molecules per repeating unit of starch, which is higher than 448
for starch materials that include some crystalline structure. 449
• The starch microspheres contain no crystalline fraction, which was confirmed by 450
SAXS. Comparison of the hydration plot of acid hydrolyzed starch and starch 451
microspheres suggests that formation of crystallites can be prevented by introducing 452
crosslinks to the material. 453
• SAXS provided information on evolution of the surface and chain properties as 454 function of hydration. 455 456 6. Acknowledgements 457
We are grateful to MAX IV Laboratory for the opportunity to perform SAXS experiments. We 458
especially thank Ana Labrador and Tomás S. Plivelic. We thank Peter Falkman for help with 459
Scanning Electron Microscopy. Financial support from Knowledge Foundation (KK-stiftelsen, 460
grant number 20110158), from Biofilms Research Center for Biointerfaces and from Gustav Th 461
Ohlsson Foundation is gratefully acknowledged. 462
463
Appendix A. Supplementary data 464
Supplementary data associated with this article can be found in the online version. 465
466
References 467
Appelqvist I. A. M., Cooke D., Gidley M. J., & Lane S. J. (1993). Thermal properties of 468
polysaccharides at low moisture: 1—An endothermic melting process and water-carbohydrate 469
interactions. Carbohydrate Polymers 20, 291-299. 470
Björses K., Faxälv L., Montan C., Wildt-Persson K., Fyhr P., Holst J., & Lindahl T. L. 471
(2011). In vitro and in vivo evaluation of chemically modified degradable starch microspheres 472
for topical haemostasis. Acta Biomaterialia 7, 2558-2565. 473
Carlstedt J., Wojtasz J., Fyhr P., & Kocherbitov V. (2014). Hydration and the phase 474
diagram of acid hydrolyzed potato starch. Carbohydrate Polymers 112, 569-577. 475
Carlstedt J., Wojtasz J., Fyhr P., & Kocherbitov V. (2015). Understanding starch 476
gelatinization: the phase diagram approach. Carbohydrate Polymers 129, 62-69. 477
Chung H., Lee E., & Lim S. (2002). Comparison in glass transition and enthalpy 478
Chung H., Woo K., & Lim S. (2004). Glass transition and enthalpy relaxation of cross-480
linked corn starches. Carbohydrate Polymers 55, 9-15. 481
Edman P., Björk E., & Rydén L. (1992). Microspheres as a nasal delivery system for 482
peptide drugs. Journal of Controlled Release 21, 165-172. 483
Einstein A. (1906). Eine neue Bestimmung der Moleküldimensionen. Annalen Der 484
Physik 324, 289-306.
485
Elfstrand L., Eliasson A., Jönsson M., Reslow M., & Wahlgren M. (2006). From Starch 486
to Starch Microspheres: Factors Controlling the Microspheres Quality . Staerke 58, 381-390. 487
Elvira C., Mano J. F., San Román J., & Reis R. L. (2002). Starch-based biodegradable 488
hydrogels with potential biomedical applications as drug delivery systems. Biomaterials 23, 489
1955-1966. 490
Fang Y., Wang L., Li D., Li B., Bhandari B., Chen X. D., & Mao Z. (2008). Preparation 491
of crosslinked starch microspheres and their drug loading and releasing properties. Carbohydrate 492
Polymers 74, 379-384.
493
Flory P. J. (1949). The Configuration of Real Polymer Chains. The Journal of Chemical 494
Physics 17, 303-310.
495
Gao F., Li D., Bi C., Mao Z., & Adhikari B. (2014). Preparation and characterization of 496
starch crosslinked with sodium trimetaphosphate and hydrolyzed by enzymes. Carbohydrate 497
Polymers 103, 310-318.
Greenspan L. (1976). Humidity Fixed Points of Binary Saturated Aqueous Solutions. . 499
Journal of Research of the National Bureau of Standards 81A, 89-96.
500
Hagen G. (1839). Über die Bewegung des Wassers in engen zylindrischen Röhren. Ann. 501
Phys. Chem. 46, 423-442.
502
Hammersley A. (1997). FIT2D: An Introduction and Overview. ESRF Internal Report 503
ESRF97HA02T,.
504
Illum L., Farraj N. F., Davis S. S., Johansen B. R., & O'Hagan D. T. (1990). Investigation 505
of the nasal absorption of biosynthetic human growth hormone in sheep—use of a bioadhesive 506
microsphere delivery system. International Journal of Pharmaceutics 63, 207-211. 507
Illum L., Jørgensen H., Bisgaard H., Krogsgaard O., & Rossing N. (1987). Bioadhesive 508
microspheres as a potential nasal drug delivery system. International Journal of Pharmaceutics 509
39, 189-199.
510
Kocherbitov V., Arnebrant T., & Soderman O. (2004). Lysozyme-Water Interactions 511
Studied by Sorption Calorimetry. The Journal of Physical Chemistry B 108, 19036-19042. 512
Kocherbitov V., Ulvenlund S., Kober M., Jarring K., & Arnebrant T. (2008). Hydration 513
of microcrystalline cellulose and milled cellulose studied by sorption calorimetry. The Journal of 514
Physical Chemistry B 112, 3728-3734.
515
Kocherbitov V. (2004). A new formula for accurate calculation of water activity in 516
sorption calorimetric experiments. Thermochimica Acta 414, 43-45. 517
Kocherbitov V., Ulvenlund S., Briggner L., Kober M., & Arnebrant T. (2010). Hydration 518
of a natural polyelectrolyte xanthan gum: Comparison with non-ionic carbohydrates. 519
Carbohydrate Polymers 82, 284-290.
520
Labrador A., Cerenius Y., Svensson C., Theodor K., & Plivelic T. (2013). The yellow 521
mini-hutch for SAXS experiments at MAX IV Laboratory. Journal of Physics: Conference 522
Series 425, 072019.
523
Larsen F. H., Blennow A., & Engelsen S. (2008). Starch Granule Hydration—A MAS 524
NMR Investigation. Food Biophysics 3, 25-32. 525
Lourdin D., Coignard L., Bizot H., & Colonna P. (1997). Influence of equilibrium 526
relative humidity and plasticizer concentration on the water content and glass transition of starch 527
materials. Polymer 38, 5401-5406. 528
Malmsjö M., Thordarson E., Apell S. P., & Fyhr P. (2011). Microspheres of hydrolysed 529
starch with endogenous, charged ligands. WO2011068455 A1. 530
Pereswetoff-Morath L. (1998). Microspheres as nasal drug delivery systems. Advanced 531
Drug Delivery Reviews 29, 185-194.
532
Poiseuille J. L. (1841). Recherches experimentales sur le mouvement des liquides dans 533
les tubes de tres petits diameter. Comptes Rendus 11, 961-1041. 534
Rodrigues A. & Emeje M. (2012). Recent applications of starch derivatives in nanodrug 535
delivery. Carbohydrate Polymers 87, 987-994. 536
Roe, R. (2000). Methods of X-ray and neutron scattering in polymer science. : Oxford 537
University Press New York. 538
Svensson E. & Eliasson A.-C. (1995). Crystalline changes in native wheat and potato 539
starches at intermediate water levels during gelatinization. Carbohydrate Polymers 26, 171-176. 540
Tan S. R. & Tope W. D. (2004). Effectiveness of Microporous Polysaccharide 541
Hemospheres for Achieving Hemostasis in Mohs Micrographic Surgery. Dermatologic Surgery 542
30, 908-914.
543
Thiewes H. J. & Steeneken P. A. M. (1997). The glass transition and the sub-Tg 544
endotherm of amorphous and native potato starch at low moisture content. Carbohydrate 545
Polymers 32, 123-130.
546
Vinu A., Streb C., Murugesan V., & Hartmann M. (2003). Adsorption of cytochrome c 547
on new mesoporous carbon molecular sieves. J. Phys. Chem. B 107, 8297-8299. 548
Wadsö I. & Wadsö L. (1996). A new method for determination of vapour sorption 549
isotherms using a twin double microcalorimeter. Thermochimica Acta 271, 179-187. 550
Wadsö L. & Markova N. (2002). A method to simultaneously determine sorption 551
isotherms and sorption enthalpies with a double twin microcalorimeter. Review of Scientific 552
Instruments 73, 2743-2754.
553
Yalkowsky, S. H. & Dannenfelser, R. M. (1992). Aquasol database of aqueous solubility. 554
Version 5, . University of Arizona; Tuscon: College of Pharmacy.
Zavareze E. d. R. & Dias A. R. G. (2011). Impact of heat-moisture treatment and 556
annealing in starches: A review. Carbohydrate Polymers 83, 317-328. 557
Znamenskaya Y., Sotres J., Engblom J., Arnebrant T., & Kocherbitov V. (2012). Effect 558
of Hydration on Structural and Thermodynamic Properties of Pig Gastric and Bovine 559
Submaxillary Gland Mucins. The Journal of Physical Chemistry B 116, 5047–5055. 560
561