Development of a new database for Auger electron and X-ray spectra
B. P. E. Tee1,∗, T. Kibédi1, B. Q. Lee1, M. Vos2, R. du Rietz1,3, and A. E. Stuchbery1
1Department of Nuclear Physics, Research School of Physics, The Australian National University, Canberra, ACT, Australia
2Department of Electronic Materials Engineering, Research School of Physics, The Australian National University, Canberra, ACT,
Australia
3Department of Materials Science and Applied Mathematics, Malmö University, Malmö, Sweden
Abstract.An energy correction method is described to account for the Breit and QED effects on Auger elec-trons and X-ray energies in the recently developed atomic relaxation model BrIccEmis. The results are com-pared with literature and new experimental data for Z= 52. Overall this improves the agreement of the cal-culated energies with the literature values. A new atomic radiation database NS_Radlist, will contain atomic transition energies from the BrIccEmis program with these energy corrections.
1 Introduction
Highly-targeted cancer therapy requires a very localized radiation source that selectively causes damage to the can-cer cells while leaving the surrounding healthy cells unaf-fected. Low-energy (< 1 keV) electrons, which have high linear energy transfer (LET) and correspond to very short interaction ranges (of the order of nm) can be used for such localized sources. Low-energy electrons can be provided by radioisotopes that emit Auger electrons as part of their electron capture and/or internal conversion decays. The possible use of Auger electrons in cancer therapy has been discussed extensively in the literature [1–3]. In order to use Auger electrons for medical applications, it is impor-tant to know their yields and energy distribution. Unfortu-nately this is not well known at present, especially at low energies (< 1 keV),
Auger and X-ray transitions follow when a vacancy is present in an inner atomic shell. The excited atom will readjust itself to a more stable state by propagating initial inner shell vacancies toward the outer shells by means of the emission of X-rays and Auger electrons. This process is known as atomic relaxation. A significant number of Auger electrons with energies in the range from a few eV to 100 keV can be produced through this process. Due to the large number of possible relaxation paths, it is conve-nient to calculate the full atomic relaxation process using a Monte Carlo approach. At the ANU, a computational model BrIccEmis was recently developed [4, 5] to evalu-ate the full atomic relaxation spectrum.
BrIccEmis extracts nuclear structure data information from the Evaluated Nuclear Structure Data File (ENSDF) [6] to determine the distribution of initial vacancies. The propagation of atomic vacancies at each step is then ran-domly selected from all available atomic transitions, us-ing the correspondus-ing transition rates as weightus-ing factors.
∗e-mail: Bryan.Tee@anu.edu.au
Propagation steps are repeated until all higher order vacan-cies are filled, or no further transition is allowed, or the va-cancies are all in the valence shell [5]. Atomic transition rates are taken from the Evaluated Atomic Data Library (EADL) database [7] and transition energies are calcu-lated at each step of the propagation for the given vacancy distributions based on the relativistic self-consistent-field Dirac-Fock method in the j j-coupling scheme using the RAINE code [8]. For conversion electrons which are emit-ted as part of the nuclear decay process, the theoretical in-ternal conversion coefficients are taken from the program BrIcc [9]. A detailed description of the BrIccEmis model can be found in [4, 5].
The BrIccEmis model has been tested by comparing the calculations with available literature values [5] and overall a fairly good agreement was found. This includes our recent electron measurements from the electron cap-ture decay of125I [10–12]. However, it was realized that the energies used in BrIccEmis are too high [5], due to the lack of quantum electrodynamic (QED) and Breit mag-netic electron interaction corrections [13] in the RAINE code. The overestimation can be 1 keV for K Auger tran-sitions at Z= 100. The simulations in BrIccEmis are very CPU intensive due to the complex nature of atomic relax-ations. Thus, in order to allow the newly calculated atomic spectra to be used quickly and effectively, a new database of atomic radiation spectra will be built.
In this paper, an energy correction method is described to improve the energies calculated by the RAINE code for use in BrIccEmis and the results are compared with the most comprehensive compilation of Auger-electron ener-gies for singly-ionized atoms [14] and the experimental data. This correction is one of the major improvements implemented in BrIccEmis to be used for the construction of a new database. This database, named NS_Radlist [15], will be suited for a wide range of applications, including dosimetry simulations.
© The Authors, published by EDP Sciences. This is an open access article distributed under the terms of the Creative Commons Attribution License 4.0 (http://creativecommons.org/licenses/by/4.0/).
EPJ Web of Conferences 232, 01006 (2020) https://doi.org/10.1051/epjconf/202023201006 HIAS 2019
2 Evaluation of Auger electron energies
An Auger transition involves the filling of an initial va-cancy in the X (sub)shell by an electron in the Y (sub)shell, and the excess energy is transferred to another electron in the Z (sub)shell, which is then emitted. The emitted elec-tron is called a XYZ Auger elecelec-tron. For a singly ionized system, a XYZ Auger energy is described using the fol-lowing equation [16]:
E(X, YZ)= E(X) − E(YZ). (1)
where E(X) and E(YZ) are the total energy of the atom with a hole in the X shell and a hole in both the Y and Z shells, respectively. The binding energy of any shell, for instance the X shell, can also be expressed in terms of total energies of the atom:
BE(X)= E(X) − E(N). (2)
where E(N) is the total energy of the atom in its neutral state. Thus from equations (1) and (2), the energy of an Auger transition can be written as [16]:
E(X, YZ)= BE(X) − BE(Y) − BE(Z) + φ. (3) Here φ = E(Y) + E(Z) − E(N) − E(YZ) is the term re-lated to hole-hole couplings. In BrIccEmis, the lack of Breit and QED corrections ultimately leads to the over-estimation of the calculated binding energies. These cor-rections have most impact on the K-shell electrons, while they are smaller for the outer-shell electrons [18, 19]. On the other hand, the QED and Breit corrections will not affect φ much, since the corrections are similar for the positive and negative terms, resulting in a partial cancel-lation. In order to account for Breit and QED corrections in BrIccEmis, the neutral binding energies from literature [9] are used and the corrections on φ are assumed to be zero. Clearly, the accuracy of the calculated energies af-ter corrections will depend on the accuracy of the binding energies in the literature. The implemented literature val-ues of binding energy are for elements in the solid phase [9, 20], referenced to the Fermi level, while the calculated values in RAINE are for atoms, referenced to the vacuum level. The solid state effect on the correction term φ can be described as [14]:
φsolid= φatom+ S.
(4) where S denotes the solid-state correction terms which de-pend only on the material and are assumed to be the same for all Auger transitions. S values for 10 ≤ Z ≤ 102 are tabulated in Ref. [14].
If energies referenced to the vacuum level of the free atom are required, the neutral binding energies from the relativistic atomic structure package Grasp2K [21] calcu-lations (with Breit and QED corrections applied) will be used in BrIccEmis. Note that in this case, there will be no solid state corrections.
0.0 300.0 600.0 900.0 20 30 40 50 60 70 80 90 100 C Atomic number KL2L3 −60.0 −30.0 0.0 30.0 60.0 40 50 60 70 80 90 100 C Atomic number M5N2N3 −30.0 0.0 30.0 60 70 80 90 100 C Atomic number N5O1O1 −60.0 −30.0 0.0 30.0 60.0 90.0 20 30 40 50 60 70 80 90 100 C Atomic number L3M2M3 −30.0 0.0 30.0 60.0 50 60 70 80 90 100 C Atomic number M5N1N1 −30.0 0.0 30.0 60 70 80 90 100
BrIccEmis − Larkins [eV]
Atomic number
N5O2O3
Figure 1. Auger electron energy differences between BrIccEmis with (red line) and without (blue line) energy corrections to val-ues from Larkins [14].
3 Results
3.1 Auger energies comparison
The calculated energies after the semi-empirical correc-tion are compared with Larkins’ tabulacorrec-tion [14] of Auger-electron energies in Fig. 1. Note that in BrIccEmis the cal-culated energies were obtained in the j j coupling frame-work while the Auger energies in Larkins’ tabulation are obtained in the intermediate coupling framework. The multiplet splitting depends on the coupling scheme used. For example, the KL2L3Auger transition is split into two lines, KL2L3(3P1) and KL2L3(1D2) in the intermediate coupling scheme, while there is only one line in the j j coupling scheme. Therefore, for the comparison, the en-ergy of an Auger transition from Larkins’ tabulation used in Fig. 1 is the average of the intermediate coupling states. It should be noted that the energies in BrIccEmis after cor-rections and Larkins’ tabulation [14] are both referenced to the Fermi level of the solid state.
As can be seen in Fig. 1, corrected energies in BrIc-cEmis are in good agreement with Larkins. A significant improvement was found in the KL2L3 energies, which is expected since the Breit and QED corrections influence the K-shell electrons most significantly. In general, the agreement between BrIccEmis and Larkins’ tabulation is within ± 20 eV for Z< 89, whereas the differences can be up to 70 eV for Z ≥ 89.
The observed differences could be attributed to the (i) multiplet splittings of energies in Larkins, and/or (ii) ac-curacy of the binding energies used in literature. Note
2
EPJ Web of Conferences 232, 01006 (2020) https://doi.org/10.1051/epjconf/202023201006 HIAS 2019
30.5
L
14
6
8
10
12
14
16
18
21.5
22.0
22.5
23.0
Energy [keV]
(c)
x3
KL
1L
1KL
1L
2KL
1L
3+ KL
2L
2KL
2L
3KL
3L
31
2
3
4
5
6
2.5
3.0
3.5
4.0
Experiment BrIccEmis (with correction) BrIccEmis (no correction)(b)
K
LMM,N
0
1
2
3
4
5
6
7
8
9
0.2
0.4
0.6
10
3
Counts
(a)
MNN
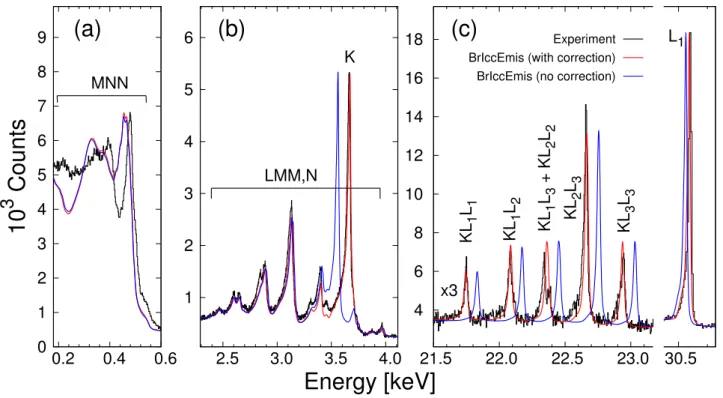
Figure 2. Auger electron spectra measured from the decay of125I. The red and blue curves indicate the calculated spectra from
BrIccEmis with and without energy corrections applied referenced to the vacuum level. (a) The MNN Auger with the K conversion (not shown) electrons, (b) the LM M and LMN Auger with K conversion electrons and (c) the KLL Auger with the L1 conversion
electrons. Note the KLL Auger peaks are multiplied by a factor of 3 and a 7 keV region between the KLL and L1peaks is omitted for
clarity. All calculated spectra are scaled to match the intensities of the conversion electrons.
that most of the binding energies in literature [9, 20] for Z> 83 are from interpolation between values for neigh-bouring elements and extrapolation from measured values in the heaviest element region. The binding energies in this region therefore lack verification with experimental data. This may explain the discrepancies observed for heavy el-ements in Fig. 1.
3.2 Comparison with experiment for Z = 52
Low-energy electron spectra from the electron capture decay of 125I to 125Te were measured at the Australian National University (ANU) using high-resolution electro-static spectrometers [10–12]. The spectrometers measured the kinetic energy of the electrons directly with no work function correction applied, hence it is expected that the observed spectra are referenced to the vacuum level. A monolayer source of125I on gold substrate was used to en-able very low energy Auger electron measurements with-out significant inelastic scattering contributions.
In Fig. 2, the KLL Auger electrons were measured together with the L1 conversion electron, and the MNN, LM Mand LMN Auger electrons were measured together with the K conversion electron. Note that the intensities of the calculated spectra from BrIccEmis in Fig. 2 were scaled to match the conversion electron peaks. The red and blue curves are the calculated spectra with and with-out energy corrections applied, respectively, referenced to the vacuum level.
3.2.1 KLL Auger group
The calculated energies of KLL Auger and L1conversion electrons have improved after applying the energy correc-tions. It should be noted that the observed multiplet split-ting structures were not shown in the calculated spectra since the interactions between electrons are considered in the j j-coupling scheme in BrIccEmis. Nonetheless, the combined intensities of the multiplets are insensitive to the choice of coupling scheme being considered. For example, the calculated intensities for the KL1L3+ KL2L2peaks re-flect the sum intensity of the two corresponding measured peaks. Given the conversion electron intensities are rela-tively well known [9], the comparison of the KLL Auger electrons with the L1 conversion electron reveals a 20% underestimation in the theoretical K Auger electron yield. This result may indicate that the K Auger transition rate from the EADL database, which is used by BrIccEmis, is underestimated for Z= 52.
3.2.2 LM M and LMN Auger group
For the LM M and LMN Auger electrons, a good agree-ment was found between all calculated energies with ex-periment. The agreement is slightly better after the energy correction, however it does not alter the Auger energies much in this case. On the other hand, note that the en-ergy of the K conversion electrons has improved signif-icantly after the corrections. The transition rates for the
3
EPJ Web of Conferences 232, 01006 (2020) https://doi.org/10.1051/epjconf/202023201006 HIAS 2019
LM Mand LMN Auger electrons in the energy region be-tween 3.2 keV to 3.5 keV are observed to be smaller than expected from the fit. However, in this case there is a pro-nounced overlap between the L Auger and the K conver-sion lines making it difficult to estimate the absolute inten-sities from those lines experimentally.
3.2.3 MNN Auger group
Both the calculated energies with and without the correc-tions could describe the main feature of the observed peaks reasonably well. Furthermore, the intensity ratio of the most intense MNN Auger (at 500 eV) to the K conversion (not shown in Fig. 2) lines was in fairly good agreement with BrIccEmis calculations. Clearly the overall agree-ment is not as good as for the KLL and LM M, N Auger spectra, reflecting the complex situations for this case as the vacancy propagates towards the valence shells and the interaction between many vacancies present is accounted for only approximately.
4 Conclusion
We reported the latest development of the BrIccEmis model, in particular the energy corrections for QED and Breit effects, and compared the results with literature. Overall the energies have been improved significantly for transitions involving primary vacancies on the K-shell, while the corrections are relatively minor for other transitions. The new atomic radiation spectra database NS_Radlist [15] will be calculated with the new version of BrIccEmis that includes these corrections.
5 Acknowledgement
This research was made possible by an Australian Re-search Council Discovery Grant DP140104417. The au-thors would like to thank J. Ekman for discussion on Grasp2K calculations.
References
[1] B. M. Bavelaar, B. Q. Lee, M. R. Gill et al., Frontiers in Pharmacology 9 (2018).
[2] B. Cornelissen, K. A. Vallis, Current Drug Discovery Technologies 7, 263 (2010).
[3] A. Ku, V. J. Facca, Z. Cai et al., EJNMMI Radiophar-macy and Chemistry 4, 1 (2019).
[4] B. Q. Lee, T. Kibédi, A. E. Stuchbery et al., Compu-tational and Mathematical Methods in Medicine 2012 (2012).
[5] B. Q. Lee, PhD thesis, Department of Nuclear Physics, Research School of Physics, The Australian National University (2017).
[6] Evaluated nuclear structure data file (ENSDF), https: //www.nndc.bnl.gov/ensdf/.
[7] S. T. Perkins, M. H. Chen, D. E. Cullen et al., Lawrence Livermore Nat. Lab., Livermore, CA. (1991). [8] I. M. Band, M. B. Trzhaskovskaya, C. W. Nestor Jr et al., Atomic Data and Nuclear Data Tables 81, 1 (2002). [9] T. Kibédi, T. W. Burrows, M. B. Trzhaskovskaya et al., Nuclear Instruments and Methods in Physics Re-search Section A 589, 202 (2008).
[10] M. Alotiby, I. Greguric, T. Kibédi et al., Physics in Medicine and Biology 63 (2018).
[11] M. Alotiby, I. Greguric, T. Kibédi et al., Journal of Electron Spectroscopy and Related Phenomena 232, 73 (2019).
[12] B. P. E. Tee, A. E. Stuchbery, M. Vos et al., Physical Review C 100, 034313 (2019).
[13] T. Kibédi, M. B. Trzhaskovskaya, M. Gupta et al., Atomic Data and Nuclear Data Tables 98, 313 (2012). [14] F. P. Larkins, Atomic Data and Nuclear Data Tables
20, 311 (1977).
[15] A. L. Nichols, E. A. McCutchan, P. Dimitriou, Tech. rep., International Atomic Energy Agency (2017). [16] F. P. Larkins, Journal of Physics B: Atomic and
Molecular Physics 9, 47 (1976).
[17] F. P. Larkins, Journal of Physics C: Solid State Physics 10, 13 (1977).
[18] K. Kozoil, C. A. Giménez, G. A. Aucar, The Journal of Chemical Physics 148, 044113 (2018).
[19] L. W. Fullerton, G. A. Rinker, Phys. Rev. A 13, 1283 (1976).
[20] K. D. Sevier, Atomic Data and Nuclear Data Tables 24, 323 (1979).
[21] P. Jönsson, G. Gaigalas, J. Biero´n et al., Computer Physics Communications 184, 2197 (2013).
4
EPJ Web of Conferences 232, 01006 (2020) https://doi.org/10.1051/epjconf/202023201006 HIAS 2019
![Figure 1. Auger electron energy di fferences between BrIccEmis with (red line) and without (blue line) energy corrections to val-ues from Larkins [14].](https://thumb-eu.123doks.com/thumbv2/5dokorg/3951418.74995/2.892.462.809.112.539/figure-electron-energy-fferences-briccemis-energy-corrections-larkins.webp)