Stock splits and changes in
ownership structures
- Evidence from Sweden
Authors: Martin Abrahamson and Robert Kalström
Masters of Science in Business and Economics
Master Thesis 15 ECTS
Gotland University: Spring semester 2009
Abstract
Stock splits are supposed to be financial cosmetics. However, this study shows that such corporate events have impact on ownership structure. This study exploits unique data from Swedish Central Security Registration regarding ownership and analyzes the ownership structures in stock splitting firms. Our data consists of exclu-sive semi-annually reported ownership structures of companies listed on Stockholm Stock Exchange. We categorize stock owners as domestic institutional investors, foreign investors and domestic individual investors. The information on ultimate ownership composition in listed companies is rare and more or less exquisite for Sweden.
Our results confirm positive abnormal returns surrounding the announcement of stock splits and stock dividends. Moreover, we find evidence on changes in owner-ship structure as well as number of shareholders. The results show evidence on de-creasing ownership concentration due to the stock split, which implies a more dis-persed ownership structure.
Acknowledgements
We would like to thank our supervisor Adri de Ridder for outstanding guidance throughout the whole process starting early October 2008. We would also like to thank Per Carleberg for valuable assistance with the statistic data collection and Fredrik Sjöstrand, the dean of Business Administration and Economics, for support throughout our work. We are also grateful for his encouragement regarding writing our thesis in English and transforming it into an article. Last but not least, a special thanks to our families who have supported us during the whole process.
Visby, June 2009
Table of Contents
1 Introduction ... 1 1.1 Problem discussion ... 2 2 Previous studies ... 4 2.1 Liquidity hypothesis ... 4 2.2 Signaling hypothesis ... 5 2.3 Ownership issues ... 6 3 Methodology ... 9 4 Empirical Findings ... 11 4.1 Abnormal return ... 11 4.2 Ownership structure ... 12 4.3 Ownership concentration ... 13 5 Conclusion ... 145.1 Suggestions for further research ... 14
Table 1 Descriptive Statistics ... 15
Table 2 Abnormal Return ... 16
Table 3 Number of Shareholders ... 17
Table 4 Average Value ... 18
Table 5 Ownership Structure ... 19
Table 6 Ownership Concentration ... 21
Bibliography
1
Introduction
The one, and only way for a company to change its stock price is by a stock split. The stock owners are assumed to be indifferent as holdings in the firm do not change, nor do the company’s cash flows change although stock splits are associated with administrative costs. Hence stock splits should be interpreted as accounting cosmetics (Han and Suk, 1998). Furthermore, stock splits are a governance tool in-tended for optimizing the stock price into a level which widens the owner base as a lower price is expected to attract more individual investors, i.e. individual investors can afford round lots, hereby the number of shareholders increase as reported by Lamoureux and Poon (1987). However, Brennan and Copeland (1988) argue that:
“In opposition to the purely cosmetic view stands the folklore that a split will in-crease the demand for a stock among small investors, which will in turn improve the stock´s liquidity, and hence presumably raise its price”. The question whether stock
splits increases the liquidity or not is not yet fully answered. Despite these facts, stock splits are commonly used, indicating that there are some effects resulting from stock splits (Gorkittisunthorn et al. 2006). These value impacts are furthermore re-lated to both the announcement date and the ex-date (Brennan and Copeland, 1988). Fama et al. (1969) suggest that stock splits signal future cash flows and that the mar-ket reaction to stock splits is a reaction to what the stock split implies; increased div-idends. This means that the market should react by increasing the price of splitting stocks upon the announcement to which extent the price corresponds to expected future dividends. Grinblatt et al. (1984) find that shareholder value increases and that the mean two-day CAR (Cumulative Abnormal Return) around the stock split-announcement is about +3,3%. The positive abnormal return reflects that some of the information is related to expected gain in future cash flows.
Lakonishok and Lev (1987) suggest that stock splits are above all intended to restore the stock price, but also to some extent, to signal information though the stock split-ting firms in their sample did demonstrate higher earnings in dividends compared to control firms.
In order to explain the effects of stock splits, the liquidity hypothesis suggest that managers split the stock in order to reduce the price into the optimum trading range, and thereby make the stock more affordable to individual investors, i.e. the stock split has implications on ownership composition. On the other hand the effect of the liquidity hypothesis is expected to decrease because of the growth of discount bro-kers (Mukherji et al. 1997). In Sweden among other countries, a round lot is equal to one stock which makes the liquidity hypothesis, at least in part, obsolete.
Institutional owners are assumed to monitor companies more effectively compared to individual investors due to benefits from analyst information (Strickland et al., 1995). As a result of the fact that institutional investors are large shareholders they have the ability to put pressure on companies to deliver increased shareholder value by exercising voting rights to a higher degree compared to individual investors. The cost of exercising voting rights is also less for large investors compared to numerous small individual investors since no counting of votes is needed and less pressure is
Lakonishok et al. (1992) find that institutional trading does not have a large impact on prices; moreover they find no significant evidence of destabilizing effects on stock prices caused by institutional trading. Furthermore, among the largest stocks which constitutes the major part of institutional holdings, Lakonishok et al. find that herding behavior and positive-feedback trading are uncommon. On the other hand, herding and positive-feedback trading did exist to some extent within a subsample of institutional investment in small stocks. Baugess et al. (2009) find evidence of differ-ences in individuals affect on the firm depending on whether they are insiders or out-siders. Even though they claim to have found evidence, Baugess et al. have already been criticized by Robinson (2009), for not contributing to the real question whether ownership affects return or not.
Mason and Shelor (1998) report a positive relationship between institutional owner-ship and split behavior. This could mean that institutional investors encourage split behavior and/or that institutional investors benefit from analyst information to which extent they can identify firms likely to split, from which the institutions can gain in-creased returns post split.
1.1 Problem discussion
The fact that low price stocks are preferred by individual investors should imply a reduction of institutional ownership after a split or stock dividend (Gorkittisunthorn et al. 2006 among others). Strickland et al. (1995), point out that if small individual shareholders shall monitor the corporate executives as efficient as institutions, it will be expensive. It might even be more expensive than the possible gain of the monitor-ing effect accordmonitor-ing to the authors.
Baker and Gallagher (1980) survey the issue why corporate executives carry out stock splits. Two of the reasons mentioned in their report are applicable in our study. The managers argued that one of their main reasons for performing stock splits was to optimize the trading volume and thereby the stock price. Another reason men-tioned was for the firm to increase their ownership base. Since the stock price affects which type of investors who will be attracted to the stock, the stock split is plausible to affect the ownership structure. If a firm contains a high concentration of institu-tional shareholders, the stock split should affect the shareholder base by decreasing the concentration of institutional shareholders.
Rubin and Smith (2009) show that when institutional ownership decreases the vola-tility increase. This should lead to a price reduction though the expected return in-creases as the volatility changes. On the other hand, Gorkittisunthorn et al. (2006) claims that the bid – ask spread is reduced (as a proportion of the price) after a stock split. These studies show that the assumption that the investors are indifferent to the split (since the value should be the same) is not fully accurate, since it affects vari-ables that have an effect on the stock price.
This study raise the question if a firm, through a stock split or stock dividend, can change the ownership structure of the company. If so, it is possible that a firm can reduce shareholder monitoring by performing stock split or stock dividend. Further-more, we analyze if announcement of such events are associated with significant changes in firm value on the Swedish market. We use information from SSE
(Stock-holm Stock Exchange) for estimating abnormal returns linked to the announcement. With the use of exclusive semi-annual ownership records we measure changes in ownership structure after the events.
This paper is structured as follows: Section 2 discusses previous research considering the announcement effects of stock splits and ownership structures. This constitutes the theoretical framework for our study. Section 3 describes the collection of data and methodology. In section 4 we present our evidence focusing on ownership struc-ture and the implications of stock splits. Section 5 concludes followed by tables.
2 Previous studies
This section briefly summarizes research in two areas; stock splits and ownership structures. A stock split increases the number of outstanding shares but do not influ-ence the market capitalization of the firm, the stock market price should decrease in proportion to the new number of outstanding shares. Since stock dividends, which rearrange the net worth accounts of the firm, also involve issues of new shares, with-out changing the market capitalization, they should have similar impact on the mar-ket as stock splits (Papaioannou et al. 2000 and Lakonishok and Lev 1987). In order to explain why firms execute stock splits primarily two groups of hypothesises are available; liquidity-, and signalling hypothesises. The ownership topic has several implications, we focus mainly on the suggestion that large owners influence the firm governance and reduce monitoring costs. However, we do not disregard the implica-tion that large owners also could influence stock prices. Our presentaimplica-tion of previous studies is limited in order to clarify our specific problem area, for a broader review of Corporate Governance issues we recommend Shleifer and Vishny (1997), “A Survey of Corporate Governance”.
2.1 Liquidity hypothesis
It is among practitioners argued that an optimum trading range exists among stocks (Baker and Gallagher, 1980). Individual investors could, due to financial wealth re-strictions, be excluded from buying expensive stocks in round lots. On the other hand, these stocks could be preferred among institutional investors due to fixed per-share transaction costs. The optimum trading range posits an equilibrium price where individual and institutional investors find the stock affordable (Lakonishok and Lev, 1987). This means that the shareholder base could be broader if the stock is priced within this range. However, this could mean that the stock split affects the ownership structure of the firm so that institutional holdings decrease and individual holdings increase post split, which has implications on the owners possibilities to monitor the agents.
Consistent with Fama et al. (1969), Lakonishok and Lev (1987) report that firms likely to perform stock splits or distribute stock dividends are firms with an unusual-ly high growth rate in returns prior to the event. In their sample, covering the years 1963 to 1982, the stock dividends appear mainly in the early years, indicating that stock dividends are declining. Moreover, stock dividends are not distributed by firms outperforming the market, as stock splitting firms, neither are stock dividends in-tended to restore stock prices. Lakonishok and Lev suggest that stock dividends may serve as a temporarily substitute for cash dividends, though stock dividends are dis-tributed by firms with relatively low priced stocks and due to the fact that the in-crease in number of outstanding shares is relatively small.
Stock splits are widely used by managers to reduce the price into the desired trading range, hereby the liquidity increases though a lower stock price is supposed to attract more investors as proposed by Baker and Gallagher (1980), i.e. a corporate event, such as a stock split, has implications on the ownership structure of the firm.
Iken-berry et al. (1996) state that the market reacts more positively to a stock split if the split makes the stock price drop to the lower interval, i.e. the stock price is below the median of comparable companies post-split.
2.2 Signaling hypothesis
A number of studies confirm that stock splits signal increased earnings consistent with the results presented in Fama et al. (1969). Pilotte (1997) reports increased earn-ings before and after stock splits during the sample period 1982 to 1989. Further-more, no reversal of earnings performance was found in the two years subsequent to the stock split announcement indicating that the positive earnings are somewhat per-manent rather than temporary. The market reaction to the split announcement and the subsequent earnings was positively related. These results support market efficiency to some extent, but bear in mind that the sample period was an era of low inflation and high economic growth, and like Pilotte claims, it is reasonable that the market reaction is to some extent optimistic during periods of long-run economic growth. Ikenberry and Ramnath (2002) present evidence that analysts underestimate the ear-nings of the splitting firm close to the split announcement. Furthermore they suggest that the market under react to news regarding stock splits. Laidroo (2009) states that the announcement quality is essential for the market reaction following the announ-cement. Moreover she claims that the higher quality of the announcement disclosure the lower the information asymmetry will be. Hereof, the agency conflicts between managers and investors might be diminished if the announcement is made with good quality.
Ikenberry et al. (1996) argue that out of their sample firms only 3 % performed their split while the price level was below the median price of the stock. Ikenberry et al. state that positive performance is generally the case before the stock split decision of a company, they also claim that a pessimistic manager is not likely to argue in favour of a stock split. McNichols and Dravid (1990) claim that the firm, by choosing their split factor, is signaling private information regarding future performance. According to Huang et al. (2006) managers ordain a stock split based on the previous positive outcome of the company, not the expected future performance. The fact that the stock price in several cases continue to rise is explained by Huang et al. as a result of the negative linkage between announcement and post-split price. This indicates that the market is more positive to trade the stock at the lower price, ceteris paribus. Huang et al. (2006) consider large companies to be less interested in stock splits than small or medium sized companies. They explain this due to asymmetrical informa-tion, and the assumed fact that a large company is efficiently monitored and thereby have less asymmetric information than a smaller company. Therefore the smaller company has more to gain from a stock split, which is shown in the difference consi-dering abnormal return. Ikenberry et al. (1996) show that a smaller company per-forms significantly better than a large firm three years post-split. They also state that the market under reacts to the split announcement, which they claim is consistent with other corporate events. Nofsinger (2001) reports that the signaling of good or bad news creates different behavior on behalf of the institutions versus the individu-als. Nofsinger claims that institutions buy on both good and bad news, while the in-dividual investor only buy on announcement of good news.
2.3 Ownership issues
Institutional owners such as financial institutions, mutual funds, insurance companies and pension funds are known to impact the market in several ways. Moreover, insti-tutional investors are often held for having a destabilizing effect on stock prices as discussed by Lakonishok et al. (1992). This is due to the large amount of stocks traded in single transactions, since the greater amounts traded creates bigger swings in demand compared to individual trading, institutional trading affects prices and thereby volatility. As argued by Lakonishok et al. this also is leveraged by institutio-nal herding behavior, which, in fact, could be greater than individual herding. Since institutional investors have access to immediate information from a wide range of sources, which by the way provide information to many investors, and the fact that institutional investors keep track of each other’s investments, institutional investors herd to a greater extent than individual investors. Dennis and Strickland (2002) re-port evidence of positive herding among the institutions, pension funds in particular. Herding might increase the market efficiency by making the market discount infor-mation faster than if herding did not exist. In these situations herding might have a stabilizing effect by correcting stock prices which deviate from fundamental values. Dennis and Strickland (2002) show that the herding behaviour of the institutions might cause the price to drop below their true values when the market news are unfa-vourable to the firm.
In contrast, institutional investors favored by immediate information could act ra-tionally by evaluating fundamentals applying negative-feedback trading i.e. buy cheap and sell high. In this case institutional investors will herd only if they are faced with information simultaneously and interpret the information the same way. One explanation to this might be the differences in investing horizons that appear to exist between the individual and the institutional investors. According to Markowitz (1991) individual investors have longer investing horizon than the institutional inves-tors and the pension funds are particularly prone to trade frequently, which may af-fect their herding behavior.
As discussed by Lakonishok et al. (1992) institutional investors also could be broad investors using a variety of strategies. Hereby, the negative-feedback investors offset the positive-feedback investors. In this situation the institutional investors does not have a destabilizing effect on the market, they are merely increasing the trading vo-lumes. Although Lakonishok et al. find weak evidence of positive-feedback trading in small stocks, the evidence on large stocks considering both herding and positive-feedback trading, is even weaker. Furthermore no evidence on a correlation between excess returns and changes in institutional holdings is confirmed. This supports, to some extent, that institutional investors does not destabilize the market. This implica-tion is supported by Bohl and Brzenszcyñski (2006) who take the issue of destabili-zation one step further by implying that institutional investors do stabilize the mar-ket.
Dennis and Strickland (2003) report that institutional ownership increase following stock splits in firms with low proportion of institutional ownership before the split. This contradicts the liquidity hypothesis and is inconsistent with idea that stock splits increase ask spreads and hereby drive away institutional investors, though bid-ask spreads are held for a major cost component since institutional investors are fre-quent traders. On the other hand, in firms with a large proportion of institutional
ow-nership pre-split, the proportion decreased post split, consistent with the liquidity hypothesis. Rubin and Smith (2009) report that, even considering if the stock has dividend or not, the evidence is clear that when institutional ownership decreases the volatility increases. Furthermore, Dennis and Strickland (2003) find that abnormal return is positive and negatively related to institutional ownership pre-split. Also, changes in liquidity were negatively related to institutional ownership before split, hereby the gain in liquidity is dependent on the extent of institutional ownership. I.e. the abnormal return indicates market efficiency to some extent though the liquidity gain is discounted.
The positive relationship between stock split behavior and institutional ownership is somewhat two-folded (Mason and Shelor, 1998). Institutional investors, benefiting from analyst information, may have the ability to pin point firms likely to perform stock splits, and hereby invest in pre-split announcement firms associated with high post-announcement earnings. On the other hand the institutions might encourage firms to enact stock splits for the reasons mentioned.
Perrini et al. (2008) report that the ownership concentration of the five largest share-holders is positively related to firm valuation (measured as Tobins Q) and that mana-gerial ownership concentration, on the other hand, decreases firm valuation. Howe-ver, the latter effect disappears in firms with dispersed ownership. These findings confirm that concentrated ownership provide more efficient monitoring compared to dispersed shareholders. The study also supports the entrenchment effect stating that when managerial ownership goes beyond a certain level the management become entrenched and hereby the stock holder value decreases.
2.3.1 Selecting the owners
According to Gompers and Metrick (2001) the firm might choose their ownership composition by changing their price level. If the firm has a relative high stock price the amount of institutional investors will be relatively high and vice versa. This as-sumption is also supported by Fernardo et al. (2004) who investigated the price level choice in IPO’s and found that stocks with relatively high introduction price had a greater share of institutional investors than stocks with a relatively low price. This implies that by changing the price the firm might want to decrease the concentration of institutional investors in favor of individual investors.
2.3.2 Agency problem
Jensen and Meckling (1976) state, despite the well known agency problem, that in-vestors keep investing billions of dollars in the companies. They furthermore claim that investors have every incentive to minimize the agency costs, but they also point out that the corporations as we know them are made from thousands of years of evo-lution and it does attract investors. Gugler et al. (2008) claim, in their LaPorta et al. (1997,1998) based comparative examination of ownership issues in different coun-tries, that legal institutions in Anglo-Saxon countries provide the shareholders with better protection against agency problems than civil law countries do.
Singh and Davidson (2003) claim that ownership composition is of little relevance to the agency costs, at least as far as managerial discretionary expenses go. They report that a high insider ownership creates an alignment between the owners and the man-agers in terms of assets utilization. Singh and Davidson also states that board compo-sition seem to have small, if any, effect on the managerial discretionary expenses and linked to this they also claim that managers with an active role within the board has no influence on agency costs. Jensen (2005) also addresses the problem concerning managerial signals to the investors, meaning that managers all over the world take too little responsibility for keeping the stock within a reasonable price. With the ex-ception of Warren Buffet, Jensen claims that managers do not recognize the danger of overvalued equity, its consequences and risk of creating bubbles.
3 Methodology
The initial data sample consists of 109 firms listed on SSE which performed stock splits or stock dividends between the years 2000 and 2008. The announcement dates are collected from press releases, year-end reports, or other public information re-leased by each company. We excluded companies that announced buyback programs simultaneously as stock splits or stock dividends and foreign companies traded on SSE. The sample for measuring abnormal returns (AR) decreased to 86 companies due to uncertainty of the announcement date or lack of historical prices, preferential-ly among the earlier events. In order to estimate the abnormal return we use market adjusted abnormal returns (equation 1), with the use of the MacKinlay (1997) proce-dure, hence the average abnormal return (AAR) is estimated as shown in equation 2. The choice of method is based on Brown and Weinstein (1985) who states that even the simplest model for estimating abnormal return is efficient. As benchmark (rmt) we
use OMXS PI, which is an all share index from SSE.
ari,t =ri,t −rm,t (1)
∑
= = n i t i t ar n AAR 1 , 1 (2)Our approach is also used for example by Pilotte (1997) in a study measuring market reaction to stock splits, and Papaioannou et al. (2000) for measuring excess returns on announcement of dividend distributions on the Greek stock market. We estimate CAR in a three day window surrounding the announcement date, day -1 to +1. The reason for extending the announcement period to the days surrounding day 0 is that public information in some cases are released after the end of the trading day, see for example Grinblatt et al. (1984). On the other hand, a significant abnormal return pre-announcement could indicate trading based on inside information.
The ownership structures in our sample firms is obtained from the Central Security Registration (Euroclear Sweden). According to Swedish law all publicly traded com-panies record their ownership structure four times per year (end of each quarter). Prior to the year 2006 ownership records were made semi-annually at the end of June and the end of December. Our study will therefore contain information based on 23 different record dates. The data consists of semi-annual ownership structure of all companies on the SSE. Foreign companies traded do not report ownership structure according to Swedish regulation for that reason they are excluded from the owner-ship measurements. We categorize owners in following categories: domestic individ-ual investors, domestic institutional and foreign investors.
The sample for measuring ownership decreased to 88 companies due to lack of data and ability to follow each company from 6 months pre-event to 12 months post-event. In order to identify possible changes in ownership structure we measure the proportion of individual, institutional and foreign ownership in the stock split-ting/dividend firms in two time periods. Event period (the 6 month period in which the announcement is made), and the post event period (the 6 month period after the
event period). Note that, due to semi-annual data, it is possible for the firms to ex-ecute the event in the post event period, this, however, is of no interest for this inves-tigation.
In our analysis of ownership concentration we use the Herfindahl index and Hartzell-Starks index (Hartzell and Hartzell-Starks, 2003). In our research we use both indexes as indi-cation of possible changes in ownership concentration. Herfindahl index is calculated for cash flow rights as well as voting rights. Hartzell-Starks index is calculated by dividing the largest five holdings with the total institutional holdings. We measure differences in cash flow rights and in voting rights for each firm. By doing so we identify if a specific group of investors prefer to keep their cash flow rights or if corporate influence in terms of voting rights are preferred. In cases of dual-class shares in the sample we focus on the B-share, the reason for this is our assumption that the B-share normally is traded more. Our sample companies differ, as shown in the appendix, between our investigation of announcement effect and ownership structure, but since our sample is relatively small we choose to include companies even if they are only applicable in one of our two-parted investigation.
4 Empirical Findings
Section 4 presents and analyzes the empirical findings based on the stock split-ting/dividend firms on SSE. This section is divided in three areas, abnormal return, ownership structure and ownership concentration.
4.1 Abnormal return
Table 2, panel A reports evidence on existence of abnormal returns around the an-nouncement of stock splits and stock dividends. In the three-day window around the announcement date the cumulative average abnormal return (CAAR) is 2,14% (t-statistics=2,96). Note that panel A shows truncated sample due to extreme values in AAR, for the total sample, extreme values included, CAAR is 2,72 (t-statistics=2,55).
Although the stock dividend sample is small there is a difference between the ab-normal returns in stock splitting firms and stock dividend firms. The stock dividend AAR’s are higher and driven by extreme values in a relatively small sample. Howev-er, as indicated by the relatively high standard deviation, this subsample contains stocks where the returns deviates from the mean to a high extent, in fact 60% of these stocks have a CAR of 3,3% or more and the rest, has negative CAR.
The positive abnormal return in the three-day window around the announcement is consistent with the findings in previous studies. Pilotte (1997) reports a mean market adjusted abnormal return in a two-day window around stock split announcement of 3,24%. Han and Suk (1998) report similar observations, with a total sample abnormal return of 2,32%. Grinblatt et al. (1984) present a two day announcement return of 3,41% and a mean two day market (benchmark) return of 0,10 % in a sample con-taining both stock splits and stock dividends. Moreover, Grinblatt et al. report similar results in their subsample consisting of pure stock split/dividend announcements. This is of importance to note though firms often announce stock splits/dividends in year-end reports which also contains other valuable information. Our findings sup-port Fama et al. (1969) arguing that announcements of stock splits indicate good news in terms of increased shareholder value, i.e. dividends. Furthermore it is possi-ble that firms decide to split their stock due to superior information regarding future earnings.
Overall, our findings verify that the immediate market reaction to stock splits and stock dividends is positive, and support the signaling effect. The fact that most firms announced the events in year end reports, i.e. simultaneously as other information, imply that the announcement could be contaminated by other information. Since our sample is quite small it would be of little use to purify a subsample of stock split/dividend announcement only in order to control for contaminated information.
4.2 Ownership structure
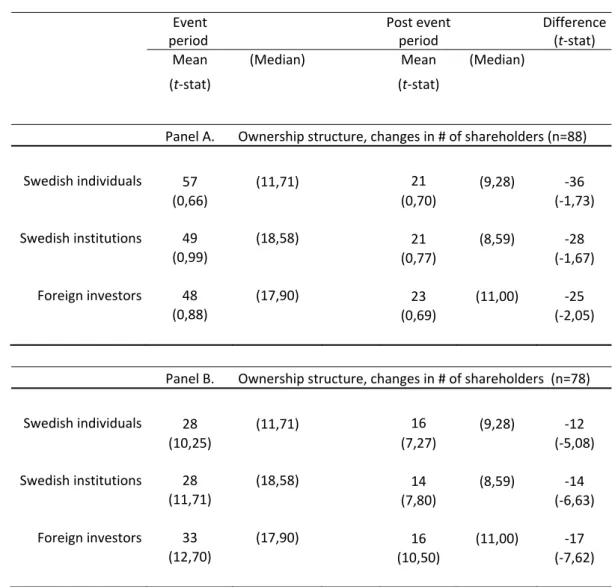
Table 3 panel B shows that stock splits and stock dividends significantly increase the number of shareholders among each category of owner consistent with Baker and Gallagher (1980) and Lamoureux and Poon (1987). The increase (28-33%) in each category in the event period is statistically significant and significantly higher com-pared to the post event period. This supports that the ownership base broadens during the event period. Table 4 reports average holdings by each category in share value. As indicated by panel B Swedish institutions hold the greater part of share value in the sample firms. This implies that Swedish institutions hold a greater proportion of shares with a relatively high stock price, since table 5 show a more evenly distributed ownership structure. These results are consistent with previous research, for example Gompers and Metrick (2001).
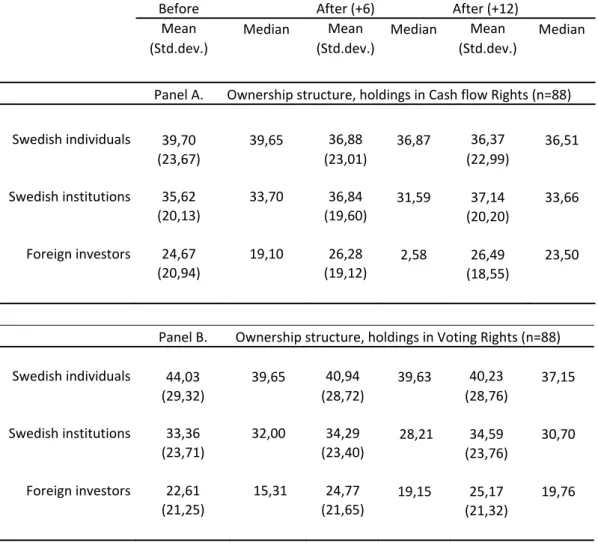
Table 5 reports ownership structures in the sample firms before and after the events. As indicated by average holdings in cash flow rights (panel A) and average holdings in voting rights (panel B), Swedish individuals hold a greater proportion of holdings before the events in comparison with Swedish institutions and foreign investors. Panel C (D) shows that the average change in cash flow right (voting rights) holdings for Swedish individuals is -2,83% (-3,09%) during the event period whilst both Swe-dish institutional and the foreign holdings increase during the same period. This indi-cates that a proportion of individual shareholders sell holdings post split. This holds also for the post event period where the average change in individual holdings con-tinue to decrease, -0.50% in cash flow rights and -0,71% in voting rights, whilst both Swedish institutional and foreign holdings increase, 0.30% and 0,20% in cash flow rights and 0,30% and 0,41% in voting rights, respectively. Important to note is that the greatest increase in holdings is found among the foreign investors (panel C and D), 1,61% in cash flow rights and 2,16% in voting rights, both statistically signifi-cant. The fact that foreign holdings increase to a relatively high extent may be ex-plained by the positive interpretation of the event, supporting Fama et al. (1969). The differences between the time periods indicate that a significant event effect on own-ership structure exists.
The fact that Swedish institutional and foreign ownership increase when individual ownership decrease, as shown in table 5 panel C and D, is not necessarily inconsis-tent with the idea that lower priced stocks attracts individual investors due to the sig-nificant increase in number of individual shareholders as shown in table 3. Taking this under consideration our research support Gompers and Metrick (2001) and Fer-nardo et al. (2004) stating that individuals prefer cheaper stocks since individual ownership increase in absolute terms. However, in relative terms, institutional and foreign investors increase their holdings while individual holdings decrease. The fact that institutional and foreign holdings increase support Fama et al. (1969) as well as Dennis and Strickland (2003) stating that investors may interpret stock splits as fu-ture earnings.
4.3 Ownership concentration
In order to examine the ownership concentration, and whether or not the concentra-tion changes post-split, we use standard ownership concentraconcentra-tion indexes. We pre-sent this as descriptive data measuring the ownership concentration in terms of Her-findahl index applied on cash flow rights and voting rights. The Hartzell-Starks index is used to identify possible changes in ownership concentration linked to the largest owners. Table 6 present descriptive data regarding the ownership concentration. Panel A shows Herfindahl and Hartzell-Starks indexes for the reported ownership composition date, whilst panel B contains estimated changes within each time period. Since both panels have been truncated for extreme values individually, panel A and B does not necessarily contain the exact same firm which impacts the means.
In table 6 panel A we present descriptive statistics for three record dates, before the event, 6 months and 12 months after the events. As shown Herfindahl as well as Hartzell-Starks indexes decreases after the events. Panel B shows a significant de-crease in ownership concentration after the event. It also shows a significant differ-ence between the event period and the post event period, which makes it possible to identify the event effect on ownership concentration. A decrease in Hartzell-Starks index implies that the top 5 owners are weakened after a stock split. This evidence is consistent with Baker and Gallagher (1980) who state that one of the main reasons to perform a stock split is to broaden the ownership, and thereby decrease the owner-ship concentration. Even though the Herfindahl-indexes differ between cash flow rights and voting rights, we argue that both of the indexes have similar development during the event period and also during the post event periods, since the average changes show a similar pattern.
The changes in the Herfindahl indexes show that the ownership concentration de-creases after a stock split. This might be a wanted managerial effect, since manage-rial power increases when ownership is more dispersed ceteris paribus. The effi-ciency in monitoring the company will decrease as the ownership concentration gets more dispersed, which is shown by Perrini et al. (2008), thereby the owners are weakened and managers empowered. Taking Rubin and Smith (2009) under consid-eration it is possible that one effect on companies which perform stock splits might be to actually decrease volatility, since the institutional ownership increases after a stock split. In an earlier study, Lakonishok et al. (1992) argue that institutions have a destabilizing effect on stock prices because of the bigger swings since institutions trade greater amounts of stocks compared to individuals.
As Mason and Shelor (1998) point out, the connection between stock splits and insti-tutional ownership can be two-folded. Our results are consistent with those of Mason and Shelor as we have identified an increase in institutional ownership from the time period before the split until the reported ownership composition post-event. Whether this increase is due to institutional preferences for investing in stock splitting firms or institutional impact on the firms to perform a stock split is not shown in our study.
5 Conclusion
Consistent with previous research we find evidence of positive abnormal returns (+2,14%) around the announcement of stock splits and stock dividends. This sup-ports the signaling effect.
After investigating the stock splitting firms at SSE, using ultimate ownership struc-ture, we found evidence that the number of owners increase in all categories after the event has been executed. Our results show that ownership composition changes after a split. Individual investors decrease relative to institutions and foreign investors, both as holdings in cash flow rights and holdings in voting rights. These results are consistent with previous research since firms are held for using stock splits as a way to increase their ownership base. We also found evidence that ownership concentra-tion decreases, since concentraconcentra-tion measured as Hartzell-Starks index as well as Her-findahl index gave the same picture of declining concentration after the stock split. This evidence can be seen as a result of company management’s effort to reduce ownership empowerment of the company and make the monitoring by the owners less effective, and thereby increase their position as company sovereigns.
5.1 Suggestions for further research
Since we, due to database access, used semi-annual data regarding the ownership composition it would be of interest to have a more extended post event period and also to further analyze our findings in a more global context. A relevant extension which would broaden our results is whether the institutions invest in firms likely to split or if the institutions are convincing the companies to perform stock splits in order to gain from possible post-split returns. Even though we have not studied long-run performance it could be of interest to control our sample for long-long-run earnings performance both before and after the split, following for example Pilotte (1997). Moreover it is relevant to control for company size in a stock split sample when mea-suring changes in ownership structures, this could shed light on the issue of investor preferences in stock splitting firms.
Table 1 Descriptive Statistics
Tabel 1 shows event statistics divided into event categories for the total sample. Note that the column “Number of (#) Stock splits + Stock dividends” consists of compa-nies that performed both stock split and stock dividend at the same time.
Year # splits # Stock dividends # Stock splits + Stock dividends # Announcement January‐June # Announce‐ ment July‐ December # X‐date January‐ June # X‐date July‐ December Descriptive statistics, total population (n=109) 2000 19 7 3 28 1 25 4 2001 5 3 0 8 0 7 1 2002 1 0 0 1 0 0 1 2003 3 0 0 2 1 2 1 2004 6 1 0 7 0 5 2 2005 15 1 1 15 2 13 4 2006 21 0 2 22 1 16 7 2007 15 0 0 15 0 14 1 2008 6 0 0 6 0 6 0 ∑ 91 12 6 104 5 88 21
Table 2 Abnormal Return
Table 2 shows descriptive statistics for average abnormal returns (AAR) and cumula-tive average abnormal returns (CAAR) in a three-day window surrounding the event. Panel A shows the total (truncated) sample and panel B and C stock splits and stock dividends respectively.
Day AAR Std.dev. CAAR
(t‐stat) (t‐stat) Panel A. Abnormal return (n=82) ‐1 0,20 2,82 0,20 (0,63) 0 1,39 3,96 1,59 (3,18) +1 0,55 3,14 2,14 (1,59) ‐1 to +1 2,14 (2,96) Panel B. Abnormal return, splits (n=71) ‐1 0,28 3,17 0,28 (0,76) 0 1,43 5,06 1,71 (2,38) +1 0,28 3,84 2,00 (0,62) ‐1 to +1 2,00 (2,31) Panel C. Abnormal return, dividends (n=15) ‐1 1,18 7,17 1,18 (0,59) 0 2,18 4,30 3,36 (1,96) +1 2,77 8,26 6,13 (1,30) ‐1 to +1 6,13 (1,34)
Table 3 Number of Shareholders
Table 3 shows ownership changes in percent, presented as number of shareholders. Panel A shows the number of shareholders divided in chosen categories and the measured difference between the two periods. Panel B shows the truncated sample.
Event period Post event period Difference (t‐stat)
Mean (Median) Mean (Median)
(t‐stat) (t‐stat) Panel A. Ownership structure, changes in # of shareholders (n=88) Swedish individuals 57 (11,71) 21 (9,28) ‐36 (0,66) (0,70) (‐1,73) Swedish institutions 49 (18,58) 21 (8,59) ‐28 (0,99) (0,77) (‐1,67) Foreign investors 48 (17,90) 23 (11,00) ‐25 (0,88) (0,69) (‐2,05) Panel B. Ownership structure, changes in # of shareholders (n=78) Swedish individuals 28 (11,71) 16 (9,28) ‐12 (10,25) (7,27) (‐5,08) Swedish institutions 28 (18,58) 14 (8,59) ‐14 (11,71) (7,80) (‐6,63) Foreign investors 33 (17,90) 16 (11,00) ‐17 (12,70) (10,50) (‐7,62)
Table 4 Average Value
Table 4 panel A shows mean holdings by each category of investor in million (Mn) SEK. Panel B shows truncated values.
Before After (+6) After (+12)
Mean Median Mean Median Mean Median
(Std.dev.) (Std.dev.) (Std.dev.)
Panel A. Average holdings by each category in Mn SEK (n=88) Swedish individuals 0,32 0,21 0,27 0,16 0,24 0,14 (0,56) (0,53) (0,37) Swedish institutions 66,38 21,80 75,50 31,50 85,19 33,88 (118,16) (130,27) (152,45) Foreign investors 4,71 3,23 4,45 2,73 4,40 3,03 (4,61) (4,30) (4,45) Panel B. Average holdings by each category in Mn SEK (n=82) Swedish individuals 0,26 0,21 0,21 0,16 0,20 0,14 (0,22) (0,19) (0,21) Swedish institutions 53,42 21,80 61,84 31,50 69,47 33,88 (71,45) (87,55) (95,70) Foreign investors 4,39 3,23 4,23 2,73 4,18 3,03 (3,66) (3,82) (3,91)
Table 5 Ownership Structure
Table 5 shows ownership structure before and after the event. Panel A (B) shows percentage holdings in cash flow rights (voting rights) for each category. Panel C (D) shows changes in holdings by cash flow rights (voting rights) during the measured time periods.
Before After (+6) After (+12)
Mean Median Mean Median Mean Median
(Std.dev.) (Std.dev.) (Std.dev.)
Panel A. Ownership structure, holdings in Cash flow Rights (n=88) Swedish individuals 39,70 39,65 36,88 36,87 36,37 36,51 (23,67) (23,01) (22,99) Swedish institutions 35,62 33,70 36,84 31,59 37,14 33,66 (20,13) (19,60) (20,20) Foreign investors 24,67 19,10 26,28 2,58 26,49 23,50 (20,94) (19,12) (18,55) Panel B. Ownership structure, holdings in Voting Rights (n=88) Swedish individuals 44,03 39,65 40,94 39,63 40,23 37,15 (29,32) (28,72) (28,76) Swedish institutions 33,36 32,00 34,29 28,21 34,59 30,70 (23,71) (23,40) (23,76) Foreign investors 22,61 15,31 24,77 19,15 25,17 19,76 (21,25) (21,65) (21,32)
Event period Post event period Difference (t‐stat)
Mean (Median) Mean (Median)
(t‐stat) (t‐stat) Panel C. Ownership structure, changes in Cash flow Rights (n=88) Swedish individuals ‐2,83 (‐0,91) ‐0,50 (‐0,20) 2,33 (‐12,62) (‐2,74) (6,27) Swedish institutions 1,22 (1,01) 0,30 (‐0,07) 0,92 (7,11) (1,34) (4,25) Foreign investors 1,61 (0,40) 0,20 (0,36) 1,41 (5,64) (1,04) (4,26) Panel D. Ownership structure, changes in Voting Rights (n=88) Swedish individuals ‐3,09 (‐0,68) ‐0,71 (‐0,20) 2,38 (‐11,44) (‐3,01) (‐4,59) Swedish institutions 0,93 (0,52) 0,30 (‐0,08) 0,63 (4,50) (1,47) (3,52) Foreign investors 2,16 (0,24) 0,41 (0,36) 1,75 (8,32) (2,01) (3,00)
Table 6 Ownership Concentration
Table 6 shows descriptive data visualizing the ownership concentration surrounding the split. Panel A shows the actual calculations whilst Panel B shows the changes between the studied time periods. Herfindal cash flow rights (CR) and voting rights (VR) are defined as the sum of the squared fractions for all shareholders multiplied by 100. The Hartzell-Starks index is calculated as the top five institutional owners divided by 1- total holdings by institutions.
Before After (+6) After (+12)
Mean Median Mean (Median) Mean (Median)
(Std.dev.) (Std.dev.) (Std.dev.)
Panel A. Ownership concentration indexes (n=84) Herfindahl–CR 8,25 6,62 7,47 6,18 7,22 5,56 (5,65) (5,14) (5,43) Herfindahl –VR 15,73 9,83 14,83 9,77 15,04 8,83 (14,91) (14,24) (15,48) Hartzell‐Starks index 0,97 0,75 0,84 0,66 0,81 0,64 (0,82) (0,63) (0,59) Event period Post event period Difference (t‐stat)
Mean (Median) Mean (Median)
(t‐stat) (t‐stat) Panel B. Changes in ownership concentration indexes (n=84) Herfindahl –CR ‐0,80 (‐0,11) ‐0,32 (‐0,08) 0,48 (‐9,87) (‐3,08) (‐5,43) Herfindahl –VR ‐0,83 (‐0,02) ‐0,34 (‐0,04) 0,49 (‐4,74) (‐0,88) (‐4,83) Hartzell‐Starks index ‐0,10 (‐0,03) ‐0,02 (‐0,00) 0,08 (‐6,00) (‐3,33) (‐6,30)
Bibliography
Baker, Kent H., Patricia L. Gallagher, 1980. Management’s View of Stock Splits.
Financial Management 9, 2, p. 73-77.
Bauguess, Scott W., Sara B. Moeller, Fredrik P. Schlingemann, Chad J. Zuter, 2009. Ownership Structure and target returns. Journal of Corporate Finance 15, p. 48-65.
Bohl, Martin T., Januzs Brzeszscyñski, 2006. Do institutional investors destabilize stock prices? Evidence from emerging markets. Journal of International
Fi-nancial Markets, Institutions & Money 16, p. 370-383.
Brennan, Michael J., Thomas E. Copeland, 1988. Stock Splits, Stock Prices, and Transaction Costs. Journal of Financial Economics 22, p. 83-101.
Brown, Stephen J., Mark L. Weinstein, 1985. Derived Factors in event studies.
Jour-nal of Financial Economics 14, 3, p. 491-495.
Dennis, Patrick, Deon Strickland, 2002. Who Blinks in Volatile Markets: Individuals or Institutions? Journal of Finance 57, p. 1923-1950.
Dennis, Patrick, Deon Strickland, 2003. The effect of stock splits on liquidity and excess returns: Evidence from shareholder ownership composition. Journal of
Financial Research 26, 3, p. 355-370.
Fama, Eugene F., Lawrence Fisher, Michael C. Jensen, Richard Roll, 1969. The Ad-justment Of Stock Prices To New Information. International Economic Review 10, p. 1-27.
Fernardo, Chitru S., Srinivasan Krishnamurthy and Paul A. Spindt, 2004. Are share price informative? Evidence from ownership, pricing, turnover and perform-ance of IPO firms. Journal of Financial Markets 7, p. 377-403.
Gompers, Paul, Andrew Metrick, 2001. Institutional Investors and Equity Prices.
Quaterly Journal of Economics 116, p. 229-259.
Gorkittisunthorn, Maneeporn, Seksak Jumreornvong, Piman Limpaphayom, 2006. Insider ownership, bid-ask spread, and stock splits: Evidence from the Stock Exchange of Thailand. Internal Review of Financial Analysis 15, p. 450-461. Grinblatt, Mark S., Ronald W. Masulis, Sheridan Titman, 1984. The Valuation
Ef-fects of Stock Splits and Stock Dividends. Journal of Financial Economics 13, p. 461-490.
Gugler, Klaus, Dennis C. Mueller, B. Burcin Yurtoglu, 2008. Insider ownership, ownership concentration and investment performance: An international com-parison. Journal of Corporate Finance 14, p. 688-705.
Han, Ki C, David Y. Suk, 1998. Insider ownership and signals: Evidence from stock split announcement effects. Financial Review 33, p. 1-24.
Hartzell, Jay C., Laura T. Starks, 2003. Institutional investors and executive compen-sation. Journal of Finance 58, p. 2351-2374.
Huang, Gow-Cheng, Kartono Liano, Ming-Shiun Pan, 2006. Do stock splits signal future profitability? Review of Quantitative Finance and Accounting 26, p. 347-367.
Ikenberry, David L., Graeme Rankine, Earl K. Stice, 1996. What Do Stock Splits Really Signal? Journal of Finacial and Quantitative Analysis 31, 3. p. 357-375. Ikenberry, David L., Sundaresh Ramnath, 2002. Underreaction to Self-Selected
News Events: The case of Stock Splits. Review of Financial Studies 15, 2, p. 489-526.
Jensen, Michael C., William H. Meckling, 1976. Theory of the firm: Managerial be-havior, agency costs and ownership structure. Journal of Financial Economics 3, p. 305-360.
Jensen, Michael C., 2005. Agency Costs of Overvalued Equity. Financial
Manage-ment 34, 1, p. 5-19.
Laidroo, Laivi, 2009. Association between Ownership Structure and Public An-nouncements´ Disclosures. Corporate Governance: An International Review 17, p.13-34.
Lakonishok, Josef, Baruch Lev, 1987. Stock Splits and Stock Dividends: Why Who and When. Journal of Finance 42, 4 p. 913-932.
Lakonishok, Josef, Andrei Shleifer and Robert W. Vishny, 1992. The impact of insti-tutional trading on stock prices. Journal of Financial Economics 32, p. 23-43. Lamoureux, Christopher G., Percy Poon, 1987. The Market Reaction to Stock Splits.
Journal of Finance 42, 5, p. 1347-1370.
LaPorta, Rafael., Florencio Lopez-de-Silanes, Andrei Shleifer, Robert Vishny, 1997. Legal determinants of external finance. Journal of Finance 52, p. 1131-1150. LaPorta, Rafael., Florencio Lopez-de-Silanes, Andrei Shleifer, Robert Vishny, 1998.
Law and finance. Journal of Political Economy 106, p. 1113-1155.
MacKinlay, Craig A. 1997. Event Studies in Economics and Finance. Journal of
Economic Literature 35, p. 13-39.
Markowitz, Harry M. 1991. Individual vs. institutional investing. Financial Services
Research 1, p. 1-8.
Mason, Helen B., Roger M. Shelor, 1998. Stock Splits: An Institutional Investor Pre-ference. Financial Review 33, p. 33-46.
McNichols, Maureen, Ajay Dravid. 1990. Stock Dividends, Stock Splits, and Signal-ing. Journal of Finance 45, p. 857-879.
Mukherji, Sandip, Yong H. Kim, Michael C. Walker, 1997. The effect of stock splits on the ownership structure of firms. Journal of Corporate Finance 3, p. 167-188.
Nofsinger, John R., 2001. The impact of public information on investors. Journal of
Banking and Finance 25, p. 1339-1366.
Papaioannou, George J., Nickolaos G. Travlos, Nickolaos V. Tsangarakis, 2000. Valuation Effects of Greek Stock Dividend Distributions. European Financial
Management 6, 4, p. 515-531.
Perrini, Francesco, Ginevra Rossi, Barbara Rovetta, 2008. Does Ownership Structure Affect Performance? Evidence from the Italian Market. Corporate Governance
International Review 16, 4, p. 312-325.
Pilotte, Eugene, 1997. Earnings and Stock Splits in the Eighties. Journal of Financial
and Strategic Decisions 10, 2, p. 37-47.
Robinson, David T., 2009. Size, ownership and the market for corporate control.
Journal of Corporate Finance 15, p. 80-84.
Rubin, Amir, Daniel, R. Smith, 2009. Institutional ownership, volatility and divi-dends. Journal of Banking & Finance 33, 4, p. 627-639.
Shleifer, Andrei and Robert W. Vishny, 1997. A Survey of Corporate Governance.
Journal of Finance 52, 2, p. 737-783.
Singh, Manohar, Wallace N. Davidson III, 2003. Agency costs, ownership structure and corporate governance mechanisms. Journal of Banking and Finance 27, p.793-816.
Strickland, Deon, Kenneth W. Wiles, Marc Zenner, 1995. A requiem for the USA Is small shareholder monitoring effective? Journal of Financial Economics 40, p. 319-338.
Appendix: Sample Companies
Org.nr. Company name Split/Divid end factor X‐date Announc. Split/FE Year 2000 5564825833 ADCORE AB (Fd. INF. HIGHWAY, CONNECTA 02‐24) S 10:1 2000‐01‐26 1999‐12‐21* 5562913185 ADERA AKTIEBOLAG (PUBL) S 5:1 2000‐02‐28 2000‐01‐17* 5565286886 FRAMTIDSFABRIKEN AKTIEBOLAG* S 8:1 2000‐03‐06 1999‐10‐15 5563214096 AFFÄRSSTRATEGERNA I SVERIGE AB (PUBL) S 2:1 2000‐04‐03 2000‐02‐21 5560499690 TELELOGIC AB (PUBL) S 10:1 2000‐04‐19 2000‐02‐24* 5565422382 GLOCALNET AKTIEBOLAG (PUBL) S 10:1 2000‐05‐12 2000‐03‐14* 5565323929 C TECHNOLOGIES AB (PUBL). S 10:1 2000‐05‐15 2000‐03‐30* 5565334397 NET INSIGHT AB (PUBL) S 5:1 2000‐05‐15 2000‐03‐23 5564109758 TECHNOLOGY NEXUS AB (PUBL) S 5:1 OBS. S 3:1 2000‐05‐15 2000‐03‐22 5561987289 IBS AB (PUBL) S 5:1 2000‐05‐19 2000‐03‐17 SE0000147480 Alcatel Alsthom Comp. G.E.* S 5:1 2000‐05‐22 2000‐02‐04 5560624859 SCANDIACONSULT AKTIEBOLAG (PUBL) S 4:1 2000‐05‐22 2000‐02‐21* 5564000353 BOSS MEDIA AKTIEBOLAG S 5:1 2000‐05‐23 2000‐04‐12* 5565199998 ASPIRO AB S 5:1 2000‐05‐26 2000‐05‐05* 5565418869 SWITCHCORE AB (PUBL) F + S 5:1 2000‐05‐29 2000‐03‐16* 5562490192 SOFTRONIC AKTIEBOLAG (PUBL) F + S 4:1 2000‐08‐06 2000‐02‐04 5565293205 HIQ INTERNATIONAL AB (PUBL) S 10:1 2000‐06‐13 2000‐04‐24* 5562208511 RESCO AKTIEBOLAG (PUBL) S 5:1 2000‐06‐13 5564007200 NOCOM AB (PUBL) F 4:1 2000‐05‐15 2000‐03‐13* 5020173083 FÖRSÄKRINGSAKTIEBOLAGET SKANDIA* F1:1 2000‐05‐16 2000‐03‐07 5560128489 HOIST INTERNATIONAL AKTIEBOLAG (PUBL)* F 2000‐05‐17 5563981066 READSOFT AB (PUBL) F 2:1 2000‐05‐25 2000‐02‐29 5560648304 SECTRA AKTIEBOLAG F + S 3:1 2000‐11‐08 2000‐06‐05 5564277993 PRICER AKTIEBOLAG (PUBL) F 2000‐08‐01 2000‐02‐24* 5564364890 SENEA AKTIEBOLAG (PUBL) F 2000‐11‐20 2000‐07‐20* 5562586882 Q‐MED AKTIEBOLAG (PUBL) F 2000‐07‐28 2000‐04‐17 5562097146 ENEA DATA AKTIEBOLAG (PUBL) S 25:1 2000‐06‐28 2000‐02‐02* 5565112058 FEELGOOD SVENSKA AB (PUBL) S 8:1 2000‐06‐28 2000‐05‐04* 5563500916 NEW WAVE GROUP AB (PUBL) S 2:1 2000‐07‐28 2000‐02‐21 Year 2001 5561757047 LJUNGBERGGRUPPEN AB (PUBL) F 1:1 2001‐04‐19 2001‐02‐13 5560896572 PROFFICE AKTIEBOLAG S 4:1 2001‐04‐23 2001‐02‐14 5564479912 POOLIA AB (PUBL) F 1:1 2001‐04‐21 2001‐03‐08 96136007 ABB LTD S 4:1 2001‐05‐07 2001‐02‐19 5562297480 BEIJER ALMA AB (PUBL) S 2:1 2001‐05‐15 2001‐02‐14 5560004615 SKANSKA AB (PUBL) S 4:1 2001‐06‐18 2001‐02‐21+ 5560142357 CLOETTA FAZER AB (PUBL)* F 2001‐06‐20 2001‐02‐15 5560358672 CLAS OHLSON AKTIEBOLAG (PUBL) S 4:1 2001‐10‐11 2001‐06‐14 Year 2002 5563500916 NEW WAVE GROUP AB (PUBL) S 2:1 2002‐07‐30 2002‐02‐19Year 2003 5563921971 MEKONOMEN AKTIEBOLAG (PUBL) S 2:1 + 2003‐03‐06 2003‐02‐18 5563748309 NIBE INDUSTRIER AB (PUBL) S 4:1 2003‐06‐13 2003‐02‐14 5564085032 GETINGE AB (PUBL) S 4:1 2003‐11‐25 2003‐10‐07 Year 2004 5560639147 INVESTMENT AB ÖRESUND (PUBL) S 3:1 2004‐04‐16 2004‐01‐22 5560479742 INVIK & CO AB (PUBL) S 10:1 2004‐04‐28 2004‐03‐12 5560936949 SKISTAR AKTIEBOLAG (PUBL) S 2:1 2004‐04‐29 2004‐03‐05 5564382629 GUNNEBO AKTIEBOLAG (PUBL) S 2:1 2004‐06‐05 2004‐02‐04 5560972233 Kabe Husvagnar AB ser.B F 1:1 2004‐07‐06 2004‐04‐28 5563500916 NEW WAVE GROUP AB (PUBL) S 2:1 2004‐07‐28 2004‐02‐18 5560358672 CLAS OHLSON AKTIEBOLAG (PUBL) S 2:1 2004‐05‐10 2004‐06‐16 Year 2005 5564954682 RNB RETAIL AND BRANDS AB (PUBL) S 2:1 2005‐04‐05 2005‐03‐18 5560721523 L. WALLENSTAM BYGGNADS AB (PUBL) S 5:1 2005‐06‐05 2005‐02‐22 5565451217 KUNGSLEDEN AKTIEBOLAG (PUBL) S 2:1 2005‐05‐13 2005‐02‐16 5560142720 ATLAS COPCO AKTIEBOLAG (PUBL) S 4:1 2005‐05‐17 2005‐02‐02+ 5564108917 TELE2 AB (PUBL) S 4:1 2005‐05‐19 2005‐02‐16 5560219650 AKTIEBOLAGET WESTERGYLLEN (PUBL) S 2:1 2005‐05‐20 2005‐03‐03+ 5561904771 HEXAGON AKTIEBOLAG (PUBL) FE. + S 3:1 2005‐05‐26 2005‐02‐11 5564272812 MEDA AKTIEBOLAG (PUBL) S 5:1 2005‐05‐26 2005‐03‐30 43555184 UNIBET GROUP PLC S 4:1 2005‐01‐06 2005‐04‐26 5563921971 MEKONOMEN AKTIEBOLAG (PUBL) S 2:1 2005‐02‐06 2005‐02‐17 5562268143 NEFAB AKTIEBOLAG (PUBL) S 4:1 2005‐07‐06 2005‐02‐14 5560972233 KABE AB (fd.KABE HUSVAGNAR AKTIEBOLAG (PUBL)) F 1:1 2005‐07‐06 2005‐03‐31 5564688991 JC AKTIEBOLAG S 2:1 2005‐08‐08 2005‐04‐08 5563500916 NEW WAVE GROUP AB (PUBL) S 2:1 2005‐08‐08 2005‐02‐10 5561704015 ELEKTA AB (PUBL) S 3:1 2005‐10‐17 2005‐08‐23 5560418005 GAMBRO AB (PUBL) S 2:1 2005‐04‐11 2005‐02‐10* 5560936949 SKISTAR AKTIEBOLAG (PUBL) S 2:1 2005‐12‐20 2005‐10‐04 Year 2006 5564526514 AB LINDEX (PUBL) F+ S 6:1 2006‐03‐01 2005‐11‐15 5564954682 RNB RETAIL AND BRANDS AB (PUBL) Split: S 2:1 2006‐03‐01 2006‐01‐24 5565735650 HAGSTRÖMER & QVIBERG AB (PUBL) Split S 2:1 2006‐10‐04 2006‐02‐02 5560639147 INVESTMENT AB ÖRESUND (PUBL) Split: S 2:1 2006‐04‐13 2006‐01‐20 5564755550 CASTELLUM AB (PUBL) Split: S 4:1 2006‐04‐25 2006‐02‐21 5560083585 RATOS AB (PUBL) F, Split 3:1 2006‐04‐20 2006‐02‐23+ 5562297480 BEIJER ALMA AB (PUBL) Split: S 3:1 2006‐04‐26 2006‐02‐10 5563158541 PROTECT DATA AB Split: S 2:1 2006‐04‐26 2006‐03‐08 5561206474 AB ÅNGPANNEFÖRENINGEN (PUBL) Split: S 2:1 2006‐05‐02 2006‐02‐02 5565667119 BTS GROUP AB (PUBL) Split: S 4:1 2006‐08‐05 2006‐03‐08 5565451217 KUNGSLEDEN AKTIEBOLAG (PUBL) Split: S 3:1 2006‐09‐05 2006‐02‐15 5560361668 AKTIEBOLAGET CUSTOS (PUBL) Split: S 2:1 2006‐05‐18 2006‐02‐15+
5564688991 JC AKTIEBOLAG Split: S 2:1 2006‐05‐22 2006‐02‐16 5560491523 WIHLBORGS FASTIGHETER AB (PUBL) Split: S 2:1 2006‐05‐23 2006‐02‐10 5560690751 VBG AB (PUBL) Split: S 4:1 2006‐05‐06 2006‐03‐13 5560711060 SECO TOOLS AB (PUBL) Split: S 5:1 2006‐08‐06 2006‐02‐08 5560003468 SANDVIK AB (PUBL) Split: S 5:1 2006‐08‐06 2006‐02‐08+ 5562586882 Q‐MED AKTIEBOLAG (PUBL) Split: S 4:1 2006‐12‐06 2006‐03‐30 5563748309 NIBE INDUSTRIER AB (PUBL) Split: S 4:1. 2006‐06‐14 2006‐05‐12 5560452103 JM AB (PUBL) Split: S 4:1 2006‐06‐26 2006‐02‐22 5560163429 SSAB SVENSKT STÅL AKTIEBOLAG (PUBL) Split: S 3:1 2006‐06‐26 2006‐02‐09+ 5560298654 AB TRACTION (PUBL) Split: S 3:1 2006‐06‐28 2006‐02‐23 5563115939 AKTIEBOLAGET HAVSFRUN (PUBL) Split: S 10:1 2006‐11‐08 2006‐02‐15 Year 2007 5565735650 HQ AB Split, S 2:1 2007‐04‐10 2007‐03‐02 5561757047 LJUNGBERGGRUPPEN AB (PUBL) Split, S 4:1 2007‐04‐17 2007‐02‐23 5560434200 AKTIEBOLAGET INDUSTRIVÄRDEN (PUBL) Split, S 2:1 2007‐04‐25 2007‐02‐15 5565282752 NOBIA AB (PUBL) Split, S 3:1 2007‐04‐25 2007‐02‐08 5560126293 SVENSKA CELLULOSA AKTIEBOLAGET (PUBL) Split, S 3:1 2007‐05‐07 2007‐01‐30+ 5564272812 MEDA AKTIEBOLAG (PUBL) Split, S 2:1 2007‐05‐28 2007‐02‐20 5560408113 G & L BEIJER AB (PUBL) Split, S 2:1 2007‐05‐29 2007‐02‐09 5560051467 BROSTRÖM AKTIEBOLAG (PUBL) Split, S 2:1 2007‐05‐31 2007‐03‐28 5560502113/556 0491523 FABEGE AB (PUBL) Split, S 2:1 2007‐05‐31 2007‐02‐08 5560263237 INVESTMENTAKTIEBOLAGET LATOUR (PUBL) Split, S 3:1 2007‐06‐01 2007‐03‐13+ 5565562781 MALMBERGS ELEKTRISKA AKTIEBOLAG (PUBL) Split, S 2:1 2007‐06‐12 2007‐02‐15 5561904771 HEXAGON AKTIEBOLAG (PUBL) Split, 3:1 2007‐06‐11 2007‐02‐13 5560877838 ACAP INVEST AB Split, S 2:1 2007‐06‐13 2007‐03‐28 5560128547 SÄKI AB (PUBL) Split, S 5:1 2007‐06‐25 2007‐02‐15+ 5560614330 PEAB AB (PUBL) Split, 2:1 2007‐09‐25 2007‐04‐04 Year 2008 5562869957 HL DISPLAY AKTIEBOLAG (PUBL) Split, S 4.1 2008‐04‐24 2008‐01‐24 5560073495 AKTIEBOLAGET SKF (PUBL) Split+inlösen 2008‐05‐07 2008‐01‐31+ 5565562807 BALLINGSLÖV INTERNATIONAL AB (PUBL) Split, S 3:1 2008‐05‐27 2008‐02‐08 5560573981 HEBA FASTIGHETS AKTIEBOLAG (PUBL) Split, S 3:1 2008‐05‐28 2008‐02‐21 5565878054 ALFA LAVAL AB Split, S 4:1 2008‐06‐05 2008‐02‐06 5563226157 RAYSEARCH LABORATORIES AB (PUBL) Split, S3:1 2008‐06‐25 2008‐02‐05
Σ FE (stock dividend) alternatively (Split and
stock Dividend) S/FE=18 Sample= 109 Companies marked * are excluded from our research. Companies marked * after Announcement date are included in ownership calculations but excluded from ar calculations. Companies with + after announcement date are included in ar calculations but excluded from ownership calculations S= Stock split F=Stock Dividend