To Explore and Verify in Mathematics
Doctoral dissertation by Tomas Bergqvist
Doctoral Thesis No 21, Department of Mathematics, Ume˚a University, 2001.
To be publicly discussed in lecture hall MA 121, Ume˚a University, on Thursday, November 1, 2001 at 10.15 for the degree of Doctor of Philosophy.
Abstract.
This dissertation consists of four articles and a summary. The main focus of the studies is students’ explorations in upper secondary school math-ematics.
In the first study the central research question was to find out if the students could learn something difficult by using the graphing calculator. The students were working with questions connected to factorisation of quadratic polynomials, and the factor theorem. The results indicate that the students got a better understanding for the factor theorem, and for the connection between graphical and algebraical representations.
The second study focused on a the last part of an investigation, the verification of an idea or a conjecture. Students were given three conjec-tures and asked to decide if they were true or false, and also to explain why the conjectures were true or false. In this study I found that the students wanted to use rather abstract mathematics in order to verify the conjectures.
Since the results from the second study disagreed with other research in similar situations, I wanted to see what Swedish teachers had to say of the students’ ways to verify the conjectures. The third study is an interview study where some teachers were asked what expectations they had on stu-dents who were supposed to verify the three conjectures from the second study. The teachers were also confronted with examples from my second
study, and asked to comment on how the students performed. The res-ults indicate that teachers tend to underestimate students’ mathematical reasoning.
A central focus to all my three studies is explorations in mathemat-ics. My fourth study, a revised version of a pilot study performed 1998, concerns exactly that: how students in upper secondary school explore a mathematical concept. The results indicate that the students are able to perform explorations in mathematics, and that the graphing calculator has a potential as a pedagogical aid, it can be a support for the students’ mathematical reasoning.
Keywords: Explorations, mathematical reasoning, empirical investiga-tions, graphing calculators, conjectures.
Summary
This dissertation consists of five parts, four articles and a summary. In the summary a description of the the theoretical framework used in the articles is presented, together with an introduction to the research area and short presentations of the four articles. The summary ends with a discussion of the results of the studies and of possible implications for the Swedish school. The four articles are:
I Gymnasieelever unders¨oker ett matematiskt begrepp med graf-r¨aknare (Bergqvist, 1999a).
II How students verify conjectures (Bergqvist, 2000). III How students verify conjectures: Teachers expectations
(Bergqvist, 2001a).
IV Secondary school students using graphing calculators. Revised version (Bergqvist, 2001b).
Contents
1. Introduction 4
2. Theoretical framework 6
2.1. Investigations in mathematics education 6
2.2. Mathematical reasoning and proof 8
2.3. The didactical contract 13
3. Relevant related research 15
3.1. Calculators in upper secondary school mathematics 15
3.2. Proof in mathematics education 23
3.3. Research on mathematical reasoning 28
3.4. The teaching gap 29
4. Short abstracts of my four studies 32
4.1. Gymnasieelever unders¨oker ett matematiskt begrepp med
grafr¨aknare 33
4.2. How students verify conjectures 35
4.3. How students verify conjectures: Teachers expectations 35 4.4. Secondary School Students Using Graphing Calculators.
Revised version. 36
5. Discussion 37
A teacher affects eternity; he can never tell where his influence stops. Henry Adams (1907).
1. Introduction
In spring 1998 I visited a class at an upper secondary school. The students were working with tasks from the textbook. Since I knew the teacher, I was walking around in the class, prepared to answer questions from the students. One girl raised her hand and asked me for help. She showed me a question of this kind:
Find the values of a and b in the function f (x) = x3+ 2ax + b if f (1) = 5 and f0(0) = 2.
When I started asking her what kind of function she had and what f (1) = 5 could mean, she said “Stop! Just tell me what to do. Exactly how to get the right answer. Nothing else!” She made it very clear to me that she wanted to know exactly what method to use in order to solve this specific question, nothing else. I told her that I would not give her the solution, she would have to think for herself for a while first. She then told me to leave, so I walked away. About one minute later she called upon the attention of her regular teacher, and asked him the same question. He told her what method to use to get correct answer, she did what she was told to do, and she got the right answer. Everyone was happy. Except me, maybe.
This little story convinced me that there must be possibilities to change school mathematics, in a way that makes students more interested in mathematical reasoning and mathematical ideas, and teachers less inter-ested in just provide correct methods to the students.
The student in the example was working in a very practical and also (possibly) a very successful way. She got instructions how to solve the problems and she memorised the methods. The teacher who showed her the methods also constructed the exams, so she did probably very well at the exams too. However, from my point of view she wasn’t doing much mathematics. It is probably possible to get high grades in mathematics in upper secondary school, without doing much mathematics at all. In the literature one can find many indications that what students remember from their calculus is that you move the exponent down in front of the x and then you write a new exponent which is one less than the original. I believe that the method of differentiation of polynomials could be learned in primary school as well.
But are students in upper secondary school really able to do something else? To learn more about this question I designed a small pilot project:
Secondary school students using graphing calculators. (Bergqvist, 1998).
Three pairs of students were given the following open ended question: Describe how the expression
x2+ bx + c
changes when the values of b and c varies. Summarise your results
in a short report.
Figure 1. Question to the students.
The students used the graphing calculator to investigate quadratic polyno-mials of the given kind. They seemed to use the graphs in order to enhance the discussions, and to examine ideas of what would happen when the val-ues of b and c varied. The students looked at a few graphs at a time to see the difference between two graphs. They also came up with guesses of different effects the changes of b and c could have. One example of this is when one pair looked at the graphs of the two functions y = x2+ 2x + 1 and y = x2+ 4x + 1 in the same window. They could see that one of the
functions was ‘lower down’ and they said “a lower value of b gives a lower graph”. This is not true, something the students found out when they examined the situation more closely. The conflict that appeared when the students found that their idea did not fit what they saw on the calculator was very clear.
By presenting a short (but maybe not so simple) question to the stu-dents, I initiated a lot of student activity which, according to the stustu-dents, was very unusual for them. This was very interesting and also very in-triguing. Could this be a way to get students to increase the amount of discussions around mathematical concepts and ideas?
When I now look back at my five years as a research student, I think that the pilot study presented above has played a very important role in the development of my research focus. That is also one reason for the revision of the report from the pilot study. The revised report can now be found as article no. IV in this dissertation.
2. Theoretical framework
In this section I will present the framework that has guided me through my research. in order to better understand the environment in which the research has taken place, I start with a short description of mathematics in upper secondary school in Sweden.
This dissertation deals with mathematics at one of the many dif-ferent educational programs in Swedish upper secondary school, the Natural science program (in Swedish: Naturvetenskapsprogrammet). Approximately 15 % of the time is supposed to be mathematics. Besides the core subjects (Swedish, English, Mathematics, Civics etc), the focus of the education is on advanced mathematics, phys-ics, chemistry and biology. The education is for three years, and the students get access to most technical and scientific educations at the university. The mathematics in the program is mainly meant to sup-port future studies at the university and it is supposed to cover the following mathematical themes:
• Arithmetics • Algebra • Geometry • Probability • Statistics
• Precalculus (functions, trigonometry etc.) • Calculus (with differential equations)
The mathematical focus of this dissertation is precalculus and cal-culus, mainly in the second year of the three-year programme (the students’ eleventh school year).
2.1. Investigations in mathematics education. What can students really do when they get the opportunity to investigate and use their imagination in mathematics? How can this be described? This was some of the central questions I had when I started the study Gym-nasieelever unders¨oker ett matematiskt begrepp med grafr¨aknare (Ber-gqvist, 1999b, article no. I). Are students able to state conjectures when they work with unfamiliar concepts in mathematics? If they can, what happens next? Can they test it also?
In the work with these questions, it was very natural to look into the work of Schoenfeld (1985). He describes the process of problem solving as a set of chunks called episodes. There are six different episodes, and Schoenfeld describes them like this (pp. 297-300, words in italics are quotations):
Reading: The reading episode begins when a subject starts to read the problem statement aloud. It includes the time spent ingesting the problem conditions and may continue through any silence that may follow the reading - silence that may indicate contemplation of the problem statement, the (non-vocal) rereading of the problem, or blank thoughts. It continues as well through vocal rereadings and verbalisations of parts of the problem statement.
Analysis: In analysis an attempt is made to fully understand a problem, to select an appropriate perspective and reformulate the problem in those terms, and to introduce for consideration whatever principles or mechanisms might be appropriate. The problem might be simplified or reformulated.
Exploration: Exploration, on the other hand, [compared to ana-lysis] is less well structured and is further removed from the original problem. It is a broad tour through the problem space, a search for relevant information that can be incorporated into the analysis-plan-implementation sequence.
Planning: To device a plan for the solution of the problem. Implementation: Solution of the problem according to the
plan.
Verification: The nature of the episode is obvious.
One interesting result from Schoenfeld’s research is the apparent dif-ference in performance in problem solving between students and ex-pert mathematicians, even when the mathematical focus is far away from the experts normal body of knowledge. The students used more than half the time to the implementation of some methods, while the expert was mixing analysis, planning, implementation and verifica-tion in a very different way. Schoenfeld shows clearly that strategies and working methods are of vital importance in problem solving.
In article no. I (Bergqvist, 1999b) I let students investigate a mathematical concept, the factor theorem. There are several differ-ences between mathematical investigations and problem solving, but some parallels can be seen. The investigations I have observed in my research can be divided into three main parts:
• Visualisation • Conjecture • Verification
Using visualisations is to let the objects be observed, using concrete representations, in order to identify different possible connections between the objects. One example can be a function, which can be described by an algebraic expression, a table, or a graph. The graph is of course the most obvious example of a visualisation, and here is the graphing calculator a natural tool. The analysis and exploration episodes in Schoenfeld’s description are carried out through visual-isations.
Stating a conjecture. A conjecture is an assumption or an idea which could become a result or part of a result. It will mostly derive from visualisations, together with other observations and previous know-ledge. To state a conjecture could be a result of Schoenfeld’s explor-ation, and a part of the planning episode.
Verification is an investigation of a conjecture. This can be done in many different ways, and also based on more or less stable reasons. To test an example, to see if the conjecture works for other types of objects, to try to find counterexamples or to prove a conjecture using deductive methods, are all examples of verification activities. Veri-fication would of course answer to Schoenfeld’s veriVeri-fication episode.
2.2. Mathematical reasoning and proof.
Mathematical Reasoning in School Mathematics.
What is mathematical reasoning really? The expression can be found in many different articles and documents (for example Skolverket, 2001; Ernest, 1989; Stiegler and Hiebert, 1999). What is meant when the syllabus for mathematics in upper secondary school in Sweden (2001) talks about mathematical reasoning? It says:
The school shall strive for the students to develop their ability to follow and carry out mathematical reasoning, and to show their thoughts verbally and in writing. (p. 1)
Reasoning can be interpreted as several different activities:
• Logical reasoning in a traditional sense, following practices from research mathematics meaning deductive proof.
• Discussions about mathematical concepts or ideas, commu-nication aiming towards the understanding of a situation. • Finding the appropriate solution strategy in a specific
situ-ation.
• Problem solving, to use mathematics in a new situation. The Swedish syllabus states the goals for the educations, the orient-ation of the work in the school, but not how these goals are supposed to be reached. The way to reach the goals are left to the expertise of the teachers. This is a positive situation because the teachers must reflect over their own teaching. However, it can also be problematic since the goals not are stated clearly.
NCTM Principles and Standards for School Mathematics (NCTM, 2000) have a section called ‘Reasoning and Proof Standard for Grades 9 - 12’:
Instructional programs from prekindergarten through grade 12 should enable all students to
-• recognise reasoning and proof as fundamental as-pects of mathematics;
• make and investigate mathematical conjectures; • develop and evaluate mathematical arguments and
proofs;
• select and use various types of reasoning and meth-ods of proof.
These four points are followed by eight pages of discussions and ex-amples to illustrate what proof and reasoning should look like in upper secondary school. Several examples are presented, and differ-ent aspects of proof and reasoning are considered. One example is the following discussion concerning indirect proofs:
Because conjectures in some situations are not condu-cive to direct means of verification, students should also have some experience with indirect proofs. And since iterative and recursive methods are increasingly common, (. . . ) students should learn that certain types of results are proved using the technique of mathem-atical induction. (p. 344)
This is written in a very different, almost opposite, tradition com-pared to the Swedish syllabus. The Standards say clearly what is meant by ‘Reasoning and Proof’. It is also very clear that reasoning and proof should be a normal part of the mathematics education. “Mathematics should make sense to students” is a central idea in the document. One problem with the Standards is that the teacher might feel restricted only to use methods and ideas mentioned in the document.
Mathematical Reasoning and Proof in my Research.
In two of my studies I have used a hierarchy of proof levels construc-ted by Balacheff (1988) (original in French: Balacheff, 1987) in order to classify and analyse student activities.
The levels, listed below, are not proofs in a strict mathematical meaning, but rather something that is recognised as such by the stu-dent. In the presentation I have used the concept of a linear function which in school mathematics often is defined a bit looser than in un-dergraduate mathematics. A linear function is here a function that can be written as y = kx + m. The levels are:
Level 1: Naive empiricism.
To be convinced that a conjecture is true, and to argue that it is true after verifying some cases. Example:
Conjecture: All linear functions intersect the y-axis.
I tested four different linear functions and it was true every time.
Level 2: The crucial experiment.
Two different versions of this level was discussed by Balacheff. The first version is an experiment designed to make a choice between two possibilities. The result should clearly show
which one of the two conjectures that must be rejected. Note that this does not say that the other conjecture is true. The second version means testing the conjecture in a spe-cial case and drawing the conclusion that “if it works even for this it will always work”. The difference from Level 1 is mainly that the students are aware of the problem of gener-ality. Only the second version was identified in my research. Example (second version):
Conjecture: All linear functions intersect the y-axis.
I tested the function y = 1000x− 1000. Even that one in-tersect the y-axis, in spite of the fact that it is vertical in the calculator window. Then I’m sure that all linear functions intersect!
Level 3: The generic example.
To show the truth by manipulating an object which is used as a representative of all similar objects. The proof is indicated by the effect of the operations. Example:
Conjecture: All linear functions intersect the y-axis.
y = 2x + 3 is a linear function. To intersect the y-axis means that x is 0. In this functions we get y = 3 when x = 0. This can be done for all linear functions.
Level 4: The thought experiment.
An abstract member of a class is discussed. The proof is in-dicated by looking at the properties of the objects, not on the effects of operations on the object. Example:
Conjecture: All linear functions intersect the y-axis.
A linear function is described by a polynomial of degree 1. Such a polynomial is defined for all x, including x = 0. There-fore all linear functions intersect the y-axis.
Balacheff argues that Level 1 and 2 are pragmatic proofs, based on statements of facts, and that Level 3 and 4 are conceptual proofs, based on reasons. In his study he found evidence that there exists a break between these two main types of proof.
It is important to remember that these levels deal with the working method that is being used, not with how correct or successful the
students are. A student activity can be classified to be at Level 4, without being fully correct or complete.
When he had constructed his four levels, Balacheff performed a study on some students (13-14 years of age). The students were asked to answer a question in geometry. They got the following instruction:
You are to write a message which will be given to other pupils of your own age which is to:
provide a means of calculating the number of diagonals of a polygon when you know the number of vertices it has.
(p. 220)
The predominant answer to the question was n/2, where n is the number of vertices in the polygon, which is correct only for a quad-rilateral. (Since a polygon can have an odd number of diagonals, the solution is incorrect.) One pair out of thirteen managed to find the correct formula, n(n− 3)/2.
In his study, Balacheff found examples of all four levels. Naive empiricism (Level 1) was found in many situations. The student Christophe supported the conjecture f (n) = 2n, since it was true for n = 7 (the only case where the conjecture is true). The crucial experiment (Level 2) was observed in both versions. The first version was observed when two students had different conceptions, “as a weapon in discussions of validity between the pupils from the same pair” (p. 224). The second version was found when students where checking an idea against a specific polygon, with the specific goal of testing it. The generic example (Level 3) was in three cases found in order to test the conjecture that the number of diagonals could be calculated using the formula f2(n) = (n− 3) + (n − 3) + (n − 4) +
. . . + 2 + 1. In all these three cases the generic example convinces a doubting partner. The thought experiment (Level 4) was found when two students tried to formulate an argument in support of the conjecture that from each vertex there will be n− 3 diagonals. They discussed in a general way that you must subtract 3 from the number of vertices since there will not be any diagonals to the two adjacent vertices and not to the vertex itself.
To characterise mathematical reasoning the way I have been doing in my research, to use Balacheff’s levels, covers only one aspect of the concept. One other way to look at mathematical reasoning is presented in Section 3.3.
2.3. The didactical contract. The concept, coined by Brousseau 1984 (Brousseau, 1997), has turned out to be a very powerful lens when it comes to look at various kinds of educational or didactical situations. The idea of an invisible agreement in a classroom makes it possible to look at situations in the classroom in new ways.
A normal teaching situation would be that a teacher presents a good problem. The student engages in the problem, and if the stu-dent can do something with the problem, learning occurs. When there is a problem, if the student avoids the problem, or doesn’t solve it, the teacher has an obligation to help. The relationship that now forms, the rules for what the two involved persons are supposed to do, is a type of a contract. The part that deals with the mathem-atical content is called the didactical contract.
Brousseau argues that it is impossible to give explicit details of the contract, since it deals with outcomes of education, and there are no known ways to guarantee that students will learn a specific concept. The following general consequences are offered:
• The teacher is supposed to create sufficient conditions for the appropriation of knowledge and must “recognise” this appro-priation when it occurs.
• The student is supposed to be able to satisfy these conditions. • The didactical relationship must “continue” at all costs. • The teacher therefore assumes that earlier learning and the
new conditions provide the student with the possibility of new learning. (p. 32).
Brousseau also says that the most important part is not the contract in itself, but the “hypothetical process of finding a contract” (p. 32). The didactical contract is also always invisible. Balacheff (1999) writes:
Everything happens as if there was a contract, but that contract can never be agreed upon and whenever it is efficiently agreed upon, it cannot be enforced. (p. 27)
Balacheff argues that the concept of the didactical contract is almost like a paradox, there must always exist a contract, but if it is spelled out, it must fail.
Blomhøj (1994) describes the very clear game between the teacher and the student that takes place in an individual supervising situ-ation. He mentions several explicit characteristics of the didactic contract in mathematics:
• The teacher is supposed to explain the methods and algorithms that are presented in the book.
• The teacher is supposed only to pose questions which the stu-dents are able to solve using those methods and algorithms. • A task is solved, when the easiest question in it is answered. • Answers to the questions should be short, i.e. a number, a
graph or, if absolutely necessary, a sentence.
• The students will demand marking of solved exercises.
• The assessment is based only on how successful the students are in the solving of the given exercises.
• The students will do their best to try to solve the exercises. (p. 37)
When the teacher has explained the methods and algorithms of the day, she/he will help students individually. In the communication, the student is busy trying to catch signals from the teacher, to read the hints that the teacher is giving, to find out “if the number 17 in the text should be above or under the fraction bar ”1 (p. 38). At
the same time, the teacher is trying to interpret signals from the student, signals which can be read as signs of understanding. “That kind of signs is the teacher’s alibi to believe that the student now has sufficient prerequisites to engage in the solution of the exercise, and the teacher can proceed to the next student with a clean conscious”2
(p. 38). The risk is here that the teacher believes that the student’s
1Author’s translation 2Author’s translation
correct actions are founded in an understanding of the mathemat-ics, when the student only is reacting on signals from the teacher. Altogether, this would mean that the only way for learning to take place is if the contract is broken. The student must engage in the problems, and seize control of the activity.
3. Relevant related research
3.1. Calculators in upper secondary school mathematics. Tech-nology (mainly calculators and computers) as a tool in mathematics is seldom in dispute. When it comes to the use of the same technology in education, however, the case is not as clear. Discussion concerning the risk of causing the students to loose all mental calculations skills and becoming ‘button-pressers’, who can’t solve anything by using paper and pencil, arises in the press at regular intervals. Interesting is here the following quote:
If men learn writing, it will implant forgetfulness in their souls; they will cease to exercise memory because they will rely only on that which is written, calling to remembrance no longer from within themselves, but by means of external marks. (Plato, 380 BC)
In research, nowadays, the discussion seldom concerns the existence of calculators and computers, but rather what role they should play in mathematics education. Grugnetti and Jaquet (1996) say:
It is no longer a question of accepting or rejecting the new technology, but rather of determining its place in the teaching of mathematics and of trying to evaluate its effects on teaching practices and on student learn-ing. There are however questions which concerns the necessary conditions for this process of integration and the obstacles which confront it. (p 629)
The change in the use of calculators and the role of calculators have also been discussed by several researchers. Dick (1996) says:
Graphs generated by technology can be used to effect-ively communicate and discuss the meaning of the de-rivative rather than using the dede-rivative as a tool for
graphing. Graphing has become a means rather than an ends i calculus! (p. 38)
Pomerantz (1997) has a similar opinion:
In the past, students studied advanced mathematics (calculus) to learn how to draw graphs accurately. Now computer-generated graphs can be used to study im-portant mathematical concepts” (p. 16).
Pomerantz also discusses and tries to counter some of the ideas about calculators in mathematics that many people seem to hold. She calls that part of her article “dispelling the myth” (p. 6), where the myths are
(1) Calculators are a crutch: They are used because students are too lazy to compute the answers on their own; they do the work for the students.
(2) because calculators do all of the work for the student, he/she will not be stimulated or challenged enough.
(3) ‘If I didn’t need to use technology to learn math, then neither does my child. After all, I turned out just fine.’
(4) The use of calculators prevents students from effectively learn-ing the basic mathematics they will need when they enter the workforce.
(5) People will become so dependant on calculators that they will be rendered helpless without one. (e.g.: What if the battery dies or some student has to perform a computation when no calculator is available?)
One answer to the myths that Pomerantz offers is that the calculator can only do routine skills, no thinking without the user. Another answer is that the calculator, “when properly used”, can enhance the learning of mathematics. I find this list of myths rather interesting, I recognise many of the arguments from discussions with parents and mathematics teachers, and her answers are to a rather large extent the same as I tend to use. Even if there are findings in research that support the answers, more research is needed to stabilise the argumentation.
So, what has happened in research concerning technological aids in mathematics the last twenty years? In Section 3.1.1 I will look at two reviews of calculator research. In the earlier years (1981 - 1995), one part of the research was comparative studies (see for example Quesada and Maxwell, 1994; Ruthven, 1990; Mesa, 1997), aiming at determining the effects of the use of calculators or computers in teaching (see Penglase and Arnold, 1996, for further references). I will here (in Section 3.1.2) give two examples of this kind of study. Later research has more and more turned towards qualitative studies, aimed at describing the possibilities and problems in the use of edu-cational technology (see for example Healy and Hoyles, 1999; Doerr and Zangor, 2000). Section 3.1.3 contains two examples of this kind of studies.
The last few years, the interest for CAS (Computer Algebra Sys-tems) and SC (Symbolic Calculators) has increased, and today many of the studies that are performed deal with this issue (Heid et al., 2000; Kutzler, 2000). One might expect the third wave of the same kind: first to see what students can do, the comparacies with students without CAS and finally qualitative studies to examine possibilities and different strategies in the use of the technology.
3.1.1. Reviews on calculator research. Ruthven (1996) offers a clear review over research on calculators in mathematics education. He focuses on calculators, since computers are too expensive. He talks about “computational technologies which are already widely avail-able to students as an individual resource” (p. 441). However, he argues that in time the costs for portable computers will fall, and “it will become increasingly realistic to envisage the portable computer as a personal resource” (p. 441). Today, five years later, computers for all students is still not an option in most schools. In Sweden the development has gone in the other direction: five years ago all stu-dents on the natural science program in Ume˚a was given a graphing calculator as a free educational material, but today the students are supposed to buy their own calculator.
In his survey, Ruthven points at several researchers who have tried to analyse what impact the calculators have on the teaching of math-ematics. Up to 1990, the general conclusions was that the use of the arithmetic calculator in primary and lower secondary school was “little more than marginal” (p. 443). Ruthven also mentions the strong reservations from different directions (parents, employers and politicians among others). The fear that the calculator will cause the students to become lazy, that they will lack number sense and that they will be unused to writing mathematics when it comes to public examinations.
After 1990 the amount of calculators in school had gone up dra-matically (from 10 % to 75 % in 10 years), but still the use of the calculators in the teaching was limited. The reason for this was, according to Ruthven, the teachers lack of confidence in calculator use. Ruthven mentions several calculator projects where the teachers have been guided towards a more developed model of teaching, and the general experience from these studies is that it takes a long time for teachers to develop confidence in using calculators in their teach-ing, and even longer time to use them outside specific, well prepared, teaching activities.
When the graphing calculator became available in school (around 1990), the research started all over again. What is the impact? Is it good or bad? What do the students do with the graphing calculators? Ruthven performed a study (Ruthven, 1996) in an attempt to answer the last of these questions. He found that
the calculators were primarily used in three distinct ways: to support routine calculations and graphing; to mediate a numeric and/or graphic treatment of a new idea prior to a symbolic one, or parallel to it; and to stimulate open-ended activities intended to promote mathematical exploration and reflection. (p. 448)
But how effective is the use of graphing calculators i mathemat-ics education? Is that question possible to answer in a clear way? Dunham and Dick (1994) looked at seven studies, and found three where the use of graphing calculators had a positive impact, three
studies where no differences was found, and one study where there was a negative impact.
Dunham and Dick also looked at what kind of changes in student performance the researchers found. The report students who use graphing technology (compared to students who do not), in general
• have a better ability to interpret graphs.
• can connect the graphs to other representations to a larger extent
• are better problem solvers
Another effect of the use of graphing calculators in the classroom is that the demands on the teacher changes. The loss of teacher control that some studies report as an effect of an increased use of investiga-tions and explorainvestiga-tions in the classroom, is an indication that teachers will need to be more flexible in their teaching. “They can no longer only follow a script of the day’s lesson” (p. 443). The conclusions Dunham and Dick draw from their investigation are that the graph-ing calculator is a powerful tool in mathematics education, a tool which has a positive effect on the learning of mathematics. They also say that it is too early to draw any conclusions concerning the teaching of mathematics.
Another very clear and thorough review of graphing calculator research is offered by Penglase and Arnold (1996). They found that research results have indicated positive effects in several areas:
- understanding of function and graphing concepts - reading and interpreting graphs
- relationship between functions and graphs - spatial visualisation skills
- understanding of mathematical modelling
However, they also found that the research could not tell whether the graphing calculator was effective for developing understanding of transformations of functions or for combining algebraical and graph-ical knowledge of functions and graphs.
Penglase and Arnold are very critical to many comparative studies, meaning that often “the effects of the calculators cannot be distin-guished from that of the instructional program” (p. 63). They finish their review by pointing out that the potential of the graphing cal-culator in education is clear, but “it is one thing to use a tool, but quite another to use it effectively” (p. 85).
3.1.2. Comparative studies. The first example is a quantitative study by Quesada and Maxwell (1994), where 710 students participated. The study took place during a three-semester period, which means that smaller parts of the participants were active in each semester. The method used was an experimental group versus a control group. The control group was taught in the traditional way, while the exper-imental group was using a graphing calculator (Texas TI-81 and Ca-sio G-7000), and a new textbook designed for teaching with graphing utilities. All students took the same tests (at least 90 % correspond-ence). In addition to the written tests, all students in the experi-mental group answered a survey about their thoughts on the use of the calculator.
The results of the study show significantly better results in the experimental group than in the control group. The average mean was 14.21 points higher (maximum 105 points) in the experimental group. In the article the authors discuss possible underlying factors: • The students in the experimental group were aware of their
participation in the experiment.
• The exams may have been biassed towards the experimental group, since it was prepared by one of its teachers.
• The groups were using different textbooks. The one used in the experimental group contained many new ideas.
• The fact that different teachers taught the various groups raises the possibility that the effects were due to the instruct-ors rather than the treatment. (pp. 212 - 213)
The open-ended questions to the experimental group indicated three main positive effects: “(i) facilitates understanding, (ii) provides
the ability to check answers, and (iii) saves time on tedious calcu-lations” (p.212). The most common negative aspect was that the students might become too dependant on the graphing calculator.
A number of students were also interviewed, and among them, some expressed that the calculator was a mean not only to check answers, but also to look at problems graphically, before using algebra to solve them. Students also expressed the concern that they might get problems in the next course (calculus).
The authors end their article by marking that “it is not clear what causes the improvement in scores when the graphing calculator is used” (p. 214). This statement can in a way summarise the prob-lems with this kind of research studies. There are so many possible factors that can affect the students and the results of comparative tests, so it is very hard to isolate a single one. The fact that the use of the graphing calculator is supposed to effect the methods and maybe also the mathematical content, is one reason that this kind of studies are hard to find in more recent research.
The ADM-project was a Swedish analogy to the study by Quesada and Maxwell. In the study, Bj¨ork and Brolin (1995) looked at the effects of decreasing the amount of time used for graphing by hand, maximisation problems using differentiation, solving equations and calculation of determined integrals by hand. The time was instead put on the use of a graphing calculator or a corresponding computer program called Matematikverkstad3. The students were supposed to
use a specially designed booklet, covering the following topics: • Graphing functions and extreme-value problems. • Numerical solutions of equations.
• Setting up and solving integrals. • Problem solving.
• Test.
In the end of the study the students were given a test. The same test was also given in 70 randomly selected control classes (each consisting
of 20 - 30 students). The results show a significant better perform-ance by the experimental classes on problem solving and questions designed to test understanding. In the case of routine tasks there were no statistical difference between the experimental group and the control group.
The researchers then draw the conclusion that the use of graphing technology can enhance the quality of mathematics education. Again there is a problem of isolating a single factor in a whole new design, but this problem is not addressed by the authors.
3.1.3. Qualitative studies. Lauten et al. (1994) looked at five stu-dents during one semester 1991, with a mathematical focus on func-tions and limits. According to the authors this was one of the first studies with students who had the calculator as a normal part of their learning situation. They used the outcomes of clinical interviews as a basis for their analysis. After the initial interviews, the research was focused on one student, Amy. The authors claim that the study indicates that Amy had a dynamic notion of functions, and that she even might see a curve as animated in some way. Amy clearly used an image of x and y as particles, moving along the curve, where the particles never reached the limit point. In the end they suggest some further research areas, especially concerning changes over time, in the ways students use the calculator.
Dahland and Lingefj¨ard (1996) looked at how students, in a test situation, tell a reader how the calculator was used, and how the results was interpreted. A test with six questions was given in four classes (approximately 600 analysed student solutions). In the answer to the first question in the test, the students normally informed the reader that the calculator had been used to draw one or two graphs, or that the Newton-Raphson method had been used, without further description of the work. The second question was to draw the graph and describe the function y = x2x−13 . This was in most cases answered only by a graph and a short sentence similar to “The graphing cal-culator has been used” (p. 45). However, many errors in the copying
of the graph were made. The authors come to the conclusion that students (and teachers), need to develop a double competence: to use the calculator and be aware of benefits and drawbacks, and to have a basic mathematical knowledge to be able to interpret results from the graphing calculator. As a conclusion, the authors argue that the traditional methods will change but the mathematical core must remain unchanged.
3.2. Proof in mathematics education.
3.2.1. What is proof ? Hersh (1993) addresses this question, and in his discussion of the concept he distinguishes between “proof among professional mathematicians” (p. 389) and “proof in our classrooms” (p. 396). He says that
The role of proof in the classroom is different from its role in research. In research its role is to convince. In the classroom, convincing is no problem. Students are all too easily convinced. Two special cases will do it. [. . . ] What a proof should do for the student is provide insight into why the theorem is true. (p.396)
He argues that the purpose of proof in education is understanding. Although we cannot really understand what it is ‘to understand’ something, we can recognise understanding when we see it. Therefore we can also teach in order to foster ‘understanding’. Hersh finishes his article with the following statement:
Mathematical proof can convince, and it can explain. In mathematical research, its primary role is convin-cing. At the high-school or undergraduate level, its primary role is explaining. (p. 398)
3.2.2. Proof in school. Many researchers agree that proof must be a part of mathematics education (Coe and Ruthven, 1994; Hanna and Jahnke, 1999). The main reason to use proof in mathematical education can not be to show that a theorem is true. Proving that Pythagoras’ theorem is true has been done thousands of times by the best thinkers in mathematics during the last few millennia. It would
be rather ridiculous to doubt that theorem. So why do we prove things in school?
Hanna and Jahnke (1996) says:
Proof is an essential characteristic of mathematics and as such should be a key component in mathematics edu-cation. (p. 877)
And:
A proof that we propose to use in the classroom must be well structured, and almost any proof could presumably be restructured to make it more teachable. Yet proofs do differ greatly in their inherent explanatory power, and it is useful to make a distinction between proofs that prove and proofs that explain. (p. 903)
Proofs that explain. To use proofs in this way would be a good way both to make use of proofs in school mathematics and to show students how to benefit from discussions around proofs. In under-graduate education a simplification of what a lesson consists of would be definitions, theorems and proof. I think that education in upper secondary school can learn from undergraduate mathematics and vice versa, not to replace anything, but to supplement each other.
Several attempts to classify students’ different approaches when they are supposed to prove some mathematical statement has been done. The classifications are of different kinds, and Hoyles (1997) describes the different dimensions that have been used. “From prag-matic involving recourse to actions to conceptual arguing and rela-tionships, (van Dormolen, 1977 and Balacheff, 1988); from weak to strong deduction (for example Bell, 1976; Coe & Ruthven, 1994); ac-cording to different modes - enactive, visual and manipulative (Tall, 1995), or proof schemes (Harel & Sowder, in press).” (p. 7, see Hoyles (1997) for references.) Hoyles finds in her survey that students in gen-eral have rather weak understanding of what proof really is and what it is used for. She points at three different student misconceptions or difficulties:
(2) A deductive proof is still only evidence.
(3) It is hard to understand under what premises a proof will hold, and to follow a logical argumentation throughout a proof. Hoyles also gives references in support for this list (p. 7). However, to a very large extent, these studies are focused on students in lower secondary school (12 - 15 years of age). There are examples of studies on older and more advanced students, but there are few studies and the results are still much in line with the list above.
In the light of the argumentation and research results in this sec-tion, the results in my article How Students Verify Conjectures (2000) appear almost strange. I found that most students used conceptual argumentation and obviously were aware that a few examples is not a proof. See article number II and III for further discussions.
3.2.3. Students conceptions of proof. Above are examples of how, at least some, researchers in mathematics education look at the concept of proof. Equally important are students’ beliefs or conceptions of proof.
Chazan (1993) studied if an extensive use of hands-on measuring in geometry class would hinder students’ ideas about proof. He argues that this is not the case, even if he found that many students (in his study) had beliefs that were not compatible with the common idea of what a proof is. He observed two sets of beliefs, which have been found in earlier research:
(1) Evidence is proof. That an empirical argument is sufficient as ‘proof’ is often found in research ((Balacheff, 1988; Hoyles, 1997)). An example from geometry is when students believe that if you take a triangle, cut of the vertices and show that they together form a straight line, you have a proof that the sum of the angles in a triangle is 180◦.
(2) Deductive proof is just evidence. Students don’t accept the generality of a deductive proof, “deductive proof provides no safety from counterexamples” (Chazan, 1993, p. 372).
To change the situation he proposes that teachers, by clearly show-ing different ways of knowshow-ing in mathematics, can help the students to better understand why mathematics claims to be a “unique and important human endeavour, different from other human activities (e.g. empirical science).” (p. 385). That way we can also help stu-dents to understand why deductive proof is so highly valued by the mathematical community.
Healy and Hoyles (2000) looked at how students chose among a collection of written proofs, when they were asked to
i choose the one they would use themselves to answer the ques-tion and
ii choose the one they believed their teacher would give the best mark.
Interesting is that the choice that were “the most popular for the students’ own approaches turned out to be the least popular when it came to choosing for best mark, and vice versa” (p. 407). They also found indications that “most students were aware that empirical ar-guments has limitations” (p. 410). A connection to Hersh’s descrip-tions of the dual function of proof can be made: Healy and Holyes argues that the reason that students avoid algebraical approaches is their limited possibility to explain using algebra. Few students in the study chose algebraic arguments, and even fewer could construct them. They conclude with the following important question:
If students do not see algebra as a language with which they can explain phenomena in mathematics classrooms in which explanations are highly valued, what motiv-ation can there be for those who can successfully con-struct informal arguments to learn how to reexpress them algebraically? (p. 425)
3.2.4. Classification of proof and proof-like activities. Dreyfus is giv-ing a review over different approaches to study students’ conceptions of proof as one part of his article “Why Johnny can’t prove” (1999). He says:
Mathematics educators have attempted to classify stu-dents’ developing notions of proof. Balacheff (1988), for example, distinguishes pragmatic proofs and intel-lectual proofs, subdividing each into several subclasses; and Harel and Sowder (1998) propose a large set of schemes intended to make a classification of collage students’ proof-like productions possible. (p. 94)
The expression proof-like productions fits very well to the kind of student activities I have been examining in my studies. I have used Balacheff’s classification in my research (for a description of his hier-archy of proof levels, see Section 2.2). Here I will compare the levels presented by Balacheff with the proof schemes constructed by Harel and Sowder.
Harel and Sowder (1998) have created a rather complex tree-struc-ture to illustrate their three categories (with several subcategories). The three main schemes are:
External conviction proof schemes: The ground for a proof is something outside the mathematical content.
Empirical proof schemes: The conclusion is founded on facts and examples.
Analytical proof schemes: Logical deduction of some kind. Each of the three categories has several subcategories. For the first category, external conviction proof schemes, three subcategories are proposed. The doubts of an argument are removed by following a ritual (‘It looks like a proof. . . ’), obeying an authority (‘the teacher said so’ or ‘it says in the book’) or the symbolic form (the proof is written without understanding the meaning of it).
The second category, empirical proof schemes, is divided in two parts: the inductive proof scheme, which is when students argue that a conjecture is true on the basis on quantitative evaluation in one or some cases, and the perceptual proof scheme, when students use mental images (based on observations) but fail to see what happens when the images change (transforms).
The third (and final) category, analytical proof schemes, has two main subcategories: transformational and axiomatic proof schemes. Transformational means that the argumentation “involves operations on objects and anticipations of the operations’ results” (p. 258). A person possesses the axiomatic proof scheme if she or he is aware that axioms and other undefined terms are in the bottom of a mathemat-ical justification.
The system of proof schemes proposed by Harel and Sowder con-tains seventeen subcategories on different levels. The large number of possibilities create a problem when it comes to understand their ideas, and for some of the subcategories I find it hard to see why the examples justify that specific subcategory.
Balacheff has four different levels, which all in some way have to do with level of abstraction and awareness of abstraction in the reas-oning. The empirical proof schemes by Harel and Sowder roughly match Balacheff’s pragmatic proofs (Level 1 and 2), while the ana-lytical proof schemes in many ways match Balacheff’s conceptual proofs (Level 3 and 4). Of course there is not an exact match, ex-amples which contradict this can certainly be found. To me the closest connection is between Harel and Sowder’s transformational proof scheme and Balacheff’s the generic example, since both base the assertion of a statement on operations and anticipation of results of operations.
As a final comment Harel and Sowder claims that “key to the analytical proof schemes is the transformational proof scheme” (p. 276), and that education of students towards transformational proof schemes must begin in early age.
3.3. Research on mathematical reasoning. It is difficult to find definitions of what should be included in the concept mathematical reasoning. One way to avoid the problem is to say that all mathem-atical activities are mathemmathem-atical reasoning, and that the reasoning can be of different types and also of different quality. In Section 2.2 I discussed the way I have looked at quality in mathematical reason-ing. Lithner (2000) studies another aspect of quality in mathematical
reasoning, when he discusses whether the base for the reasoning lies in the mathematics involved or in (perhaps mathematically superficial) experiences from the learning environment. He bases his clarification of the concept on P´olya’s idea of plausible reasoning. Lithner defines two kinds of reasoning where one kind rests on the mathematical properties involved, and the other on experiences from the learning environment. The first, Plausible Reasoning (abbreviated PR), is characterised as reasoning which
(i) is founded on mathematical properties of the components in-volved in the reasoning, and
(ii) is meant to guide towards what probably is the truth, without necessarily having to be complete or correct.
The second kind, reasoning based on Established Experiences (ab-breviated EE), is reasoning which
(i) is founded on notions and procedures established on the basis of the individual’s previous experiences from the learning en-vironment, and
(ii) is meant to guide towards what probably is the truth, without necessarily having to be complete or correct.
In his research Lithner shows that the students’ global strategy choices are guided to a large extent by EE: “to apply methods they know from similar tasks”(p. 187). Only a few situations are found where students use PR, and those situations are very local and “are all too limited to address or resolve the student’s main difficulties” (p. 187).
Other research on mathematical reasoning can be found in re-lated areas, for example research on proof (Balacheff, 1988; Laka-tos, 1976; Chazan, 1993) and research on investigations (Schoenfeld, 1996; Krainer, 1993).
3.4. The teaching gap. One part of the TIMSS study, Third Inter-national Mathematics and Science Study, was a video study which compared the mathematics teaching of eight-graders in USA, Ger-many and Japan. The results from the study are described in the book “The Teaching Gap” by Stiegler and Hiebert (1999). The res-ults are in a way quite alarming and show great differences between
the three countries. One invited researcher summarised the findings like this:
“In Japanese lessons, there is the mathematics on the one hand, and the students on the other. The students engage with the mathematics, and the teacher medi-ates the relationship between the two. In Germany, there is the mathematics as well, but the teacher owns the mathematics and parcel it out to students as he sees fit, giving facts and explanations at just the right time. In U.S. lessons, there are the students and there is the teacher. I have trouble finding the mathematics; I just see interactions between students and teachers.” pp. 25-26
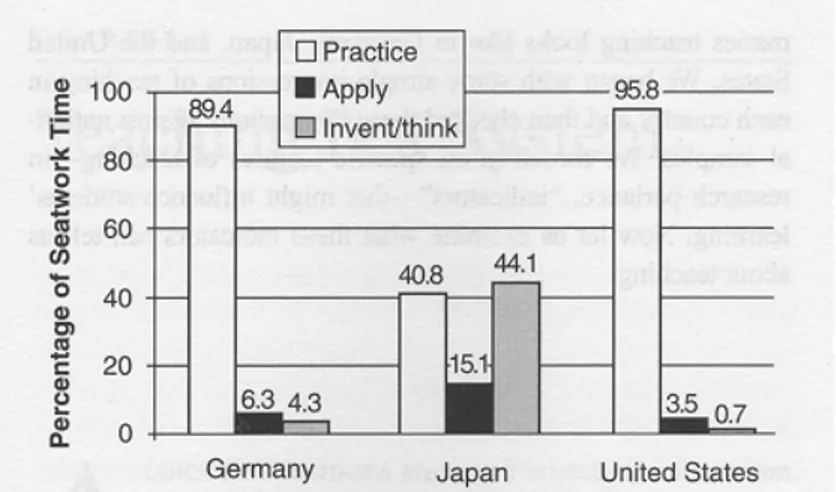
In each country, many mathematics lessons in grade eight were videotaped. The final sample included 100 lessons in Germany, 50 lessons in Japan and 81 lessons in USA, all randomly selected. Several interesting differences were found. One was in the presentation of how much time the students spent on different kinds of tasks in their seatwork. Seatwork is here what the students are doing on their own in the classroom.
Figure 2. Average percentage of seatwork time spent in three kinds of tasks (p. 71).
The activities were divided into three categories: “Practising routine procedures, apply concepts or procedures in new situations, and in-vent something new or analyse situations in new ways” (p. 70). In Figure 2 the difference between Japan and the two other countries is very striking. To have 95.8 % of the time spent on practising routine procedures as in USA, is probably not a good situation.
Another focus in the study was on the quality of the mathematical content. A group of four experienced university mathematics teachers analysed the lessons, making a subjective judgement of what they thought was relevant for student learning. The group did not know which lessons came from which country. What they found can be seen i Figure 3.
Figure 3. Percentage of lessons rated as having low, medium, and high quality of mathematical content (p. 65). The experienced mathematicians and mathematics teachers in the group judged that “American students were at a clear disadvantage in their opportunities to learn, at least as indicated by the content of their lessons” (p. 65).
The results found in the study indicate that American students have a clear disadvantage when it comes to learn mathematics. The results of the TIMSS study of eight graders (Skolverket, 1996) show that Japan was one of the top countries while USA was below average,
something that supports the view that the teaching in USA in in great need of improvement.
The authors do not propose a new way of teaching mathematics in the United States. They claim that “improving teaching, as we have said, is a cultural change and thus must happen in small steps” (p. 167). They argue that the change will take a long time, and that all teachers must work together to improve the mathematics teaching.
“The star teachers of the twenty-first century will be teachers who work every day to improve teaching - not only their own but that of the whole profession” (p. 179).
4. Short abstracts of my four studies
I started my PhD-studies in 1995. I was full of expectation and after 7 years of teaching at upper secondary school I wanted to change the teaching of mathematics completely. I believed that the graphing calculator was the key to better teaching and learning. The calcu-lator would make it possible to visualise mathematics in new ways, and the connections between different representations were the most important part of upper secondary school mathematics.
I soon found out that it wasn’t that easy.
Between 1995 and 1997 I planned and carried out several pilot studies aimed at showing the positive effects of the calculator. The results, when I got any, did not say much. At this point I asked myself “What are the students really able to do in mathematics?” To answer this question I planned a new pilot study, the study mentioned in Section 1. The results from the study indicated that the students could use the calculator to learn new mathematics and to examine their own ideas and conjectures.
Now I wanted to look more into these results. Are students really able to learn something difficult by using the graphing calculator? To learn about this I designed Study no. I, “Gymnasieelever unders¨oker
ett matematiskt begrepp med minir¨aknare” which translates to “Sec-ondary school students examining a mathematical concept using a graphing calculator”.
The other important indication from the pilot study was that the students could use the calculator to examine ideas and conjectures. How well can they do that? This led me to Study no. II, “How students verify conjectures”.
The results from study no. II, that most students tried to verify the conjectures at a relatively high level of abstraction, surprised me a little. Would other teachers also find it surprising? What are the teachers’ view of how students work with mathematics? So, I designed an interview study, Study no. III, “How students verify conjectures: Teachers expectations”.
Now it was time to look back at my research. All three studies followed on the pilot study. When I examined the pilot study I was not so pleased with the report. However, after a few looks at the video tapes, I decided that I wanted to revise the analysis and write a new report, since I found the data very good. The result of the revision can be found as Study no. IV, “Secondary School Students Using Graphing Calculators. Revised version”.
4.1. Gymnasieelever unders¨oker ett matematiskt begrepp med grafr¨aknare. In this study4 I used a series of questions concerning the factor theorem (sometimes referred to as a direct deduction from the remainder theorem). The theorem says that for all polynomials, p(x), it holds that:
p(x) = (x− a) · q(x) ⇔ p(a) = 0
where q(x) is another polynomial. From the left to the right this means that if a polynomial p(x) has a factor, (x− a), then x = a is a zero to the polynomial, i.e. p(a) = 0. From the right to the left the theorem means that if a polynomial p(x) has a zero at x = a, then the polynomial has a factor, (x − a), meaning that p(x) = (x− a) · q(x) The meaning of the theorem from the left to the right is
easier to understand. The study was aiming for the students to gain understanding of the theorem from the right to the left.
In each session, two students were working together with a teacher (myself). The students were presented a series of questions about factorisation of quadratic polynomials, where the difficulty of the questions increased all the time. The difference in difficulty was both numerical and concerning level of generality. The first question was to find polynomials f (x) and g(x) if f (x)· g(x) = x2 + x− 6, and
the last question was to write an instruction on how you are to fac-torise a general quadratic polynomial. The students were told to draw all graphs on the calculator, the quadratic polynomial and the two functions f (x) and g(x) (can be seen as straight lines) in the same window. Many students reacted directly when they saw that the straight lines intersected the x-axis at the same places as the quadratic polynomial. They said things like “Look! The zeroes!” or similar statements.
The research question in the study was:
Are students able to learn something difficult, which normally is treated in a purely algebraic way, by
- working visually, i.e. using graphical representa-tions of funcrepresenta-tions
- using a graphing calculator
- investigating the mathematical concept together with the teacher?
All students in the study could do this, in more or less advanced ways. Interesting observations in the study are that students with high grades5in mathematics were most able to state conjectures and to use
deductive reasoning. The students with medium grades6appeared to
benefit the most from the use of the calculator while the students with the lowest grades7in mathematics only could solve the exercises, and
not explain anything about the mathematics involved.
I believe that I have found some support in the study, that in-vestigations using graphing calculators can give students a better
5MVG, translates to very well approved 6VG, translates to well approved 7G, translates to approved
understanding of factorisation and the factor theorem. Students can also get a better understanding for the connection between graphical and algebraical representations of functions.
4.2. How students verify conjectures. When I saw how the stu-dents were working with investigations, I became fascinated by how the students tried to verify their conjectures. Most of the time, they only looked at one extra example and then they were satisfied. Was this all they could do, or are students able to do more than just look at examples? I decided to take a closer look at verification, the third step in the description of investigations in mathematics (see Section 2.1). At the same time, I got in contact with an article by a French researcher, Balacheff (1988). He had constructed a hierarchy of proof levels (see Section 2.2) that might be possible to use in order to analyse how students verify conjectures. I also found it possible to use the concept of the didactical contract (see Section 2.3) in the analysis.
Five pairs of students participated. They got three conjectures to verify, and were told to say if the conjectures were true or false, and write an explanation of why they were true or false. There were two research questions in the study: How do students verify conjectures? and Can the didactical contract explain the students’ strategy approach?
The results indicated that the students tried to verify the conjec-tures at a high level according to the proof levels by Balacheff. Out of the fourteen classified situations, eight were at the highest level. In several situations the students showed very clearly that they wanted to use abstract or advanced mathematics. However, they seemed to need more practice.
4.3. How students verify conjectures: Teachers expectations.
The results in the previous study, that the students tried to verify conjectures at such a high level, surprised me as a teacher. I wanted to know if the results would be as surprising for other teachers in Sweden. In order to answer that question, I planned an interview
study where I would ask some teachers questions connected to the results of study no. II.
Eight teachers were interviewed, six male and two female teachers. Each session was divided into three parts, the first part was to ask the teachers what they thought students might do. In the second part I presented the results from the previous study, and invited the teachers to comment the students’ performance. The third part was a more general discussion around the type of student activities that could be found in study no. II.
The research question in the study was How do teachers expect students to work when trying to verify conjectures? The findings were that the teachers in the study tended to underestimate the students’ reasoning levels, and that the teachers seemed to think that only a few students in a class can use high level reasoning.
4.4. Secondary School Students Using Graphing Calculators. Revised version. When I in spring 2001 looked back at the pilot study mentioned in Section 1, I found the data very intriguing, but the presentation of the study (Bergqvist, 1998) not so good. I de-cided to make a new analysis of the video recordings, using some of the knowledge and experiences I now had. The new article, no. IV in this dissertation, is based on the theoretical framework presen-ted in article no. I (and in Section 2.1) concerning investigations in mathematics.
The article describes how the students worked in an investigation of a quadratic expression, x2 + bx + c, mainly using the graphing
calculator. The results from the study show that the students in the study used the calculator to visualise the expression as graphs and that they were able to state conjectures concerning the behaviour of the graphs. The students also used the calculator to verify their conjectures, at least for themselves. The verifications were always very superficial, in the sense that the students only checked one or two extra examples.
The implications of these results are that the graphing calculator could be an important part in the educational system. The calculator could be used to more than just calculations, it might be used as a
means to understand new concepts and to develop the teachers’ and students’ creativity.
5. Discussion
In my four studies I have found indications of some problems that seem to be related to mathematical reasoning in the mathematics education at upper secondary school in Sweden. Teachers seem to believe that many students are unable or at least very limited when it comes to mathematical reasoning. At the same time, students are interested in using fairly advanced mathematical reasoning. This discrepancy might also be self-supporting in the sense that teachers who believe that the students are unable to carry out mathematical reasoning might not want to use mathematical reasoning in exercises and discussions. I have also found that some teachers think that only a small group of students in a class can use mathematical reasoning of a more advanced type, the rest are unable to use it. This division of a class in a small group who can and a large group who cannot use mathematical reasoning of a higher quality could also add to the resistance. Teachers in Sweden are encouraged to spend a lot of time on students who are on the limit of passing the course, because it is very important for a school to have a very small percentage of student failure. If a teacher believes that the class is divided into two groups and they focus a lot on the weak students, they will probably not include high quality mathematical reasoning in their teaching.
The result that many students in the study wanted to use rather advanced or abstract mathematics differs from what most other re-searchers have found (Balacheff, 1988; Chazan, 1993, and others). Hoyles (1997) found that results from a number of studies indicate that most students on the one hand prefer empirical argument over deductive reasoning, and on the other hand think that proof is just evidence. However, she also discusses the problem of the great di-versity of how and when proof is introduced in different countries. Other differences can also be found, like the mathematical focus in the studies. Some of the studies Hoyles refers to, look at students working with proof in geometry, where examples might be a more
common way to describe concepts than what it is in calculus. An-other difference between my studies and most An-other studies is the age of the students. Balacheff (1988) worked with 13-year-old students and Hoyles (1997) presents a study with 15-year-old students. In my studies the students were older, 17 years of age.
I have also found indications in support of the notion that the graphing calculator has a potential as a pedagogical aid (Dick, 1996; Pomerantz, 1997). Students seem to benefit from the use of a graph-ing calculator as a support for their reasongraph-ing. The calculator works in two ways:
- as a tool; it is used to carry out calculations or look at graphs in ways that otherwise would become a serious obstacle for the student, and
- as a catalyst; it helps the student to analyse the problem and to spark ideas concerning possible solutions.
I found that students often use the calculator to visualise mathemat-ics, for example looking at graphs of functions, and also to examine special features such as stationary points and zeroes. Most students in my studies seemed confident in the handling of the calculator, and some of them also expressed that they saw the calculator as a nor-mal and important part of their mathematical environment. These findings are close to what other researchers have found (Selinger and Pratt, 1997; Movshovitz-Hadar et al., 1994; Doerr and Zangor, 2000). Smart (1995) let some students explore parabolas and reports that “The reports they [the students] handed in showed that not only had they seen patterns on their calculator screens, they were able to write coherently about the mathematics they had developed” (pp. 205-206).
Letting students in upper secondary school explore mathematical concepts or objects, using the graphing calculator in relevant situ-ations, can be a way to increase the amount of high quality mathem-atical reasoning. This way it might be possible to reduce the apparent unbalance in the Swedish school, where the teaching and learning of routine skills appears to dominate the students every-day work to a
very large extent. I must point out that practising routine skills must take a lot of time in school, but it must not be the only important activity for the students.
It is not an easy task to change a long tradition of mathematics teaching, but I believe that it can be done. It is possible that a small change can give visible effects. A transfer of 10 % of the time from practice of routine skills to explorative activities might be a way to start the change.