PRODUCTION OF METHANE FROM
MICROALGAE BIOFILMS GROWING IN
WASTEWATER TREATMENT PLANTS IN THE
CANARY ISLANDS
Giovana O. Fistarol
Mario Rosato
Nerieida M. R. Rodríguez
Mauela A. Bastidas
Paulo Sérgio Salomon
Eva Cancelo Gonzalez
Guillermo Garcia-Blairsy
Reina
Marine Biotechnology Centre, University of Las Palmas Gran Canaria
ABSTRACT
Two recurrent topics among the scientific community are the use of microalgae in wastewater treatment plants as a biological agent for nutrient removal, and, more recently, the use of microalgae for biofuel production. In this study we have analysed the possibility of coupling these two processes, using microalgae that naturally form biofilms on wastewater treatment tanks to produce methane. The proposal is to develop a low cost, environmental friendly methodology, with the economical and environmental advantages of enhancing the removal of nutrients from wastewater, and producing sustainable biofuel. A methane assay using microalgae biofilms from the primary and secondary treatment tanks from a wastewater treatment plant (WWTP) on the Canary Islands (EDAR-del Sureste, Gran Canaria, Spain) showed that, when this substrate is added to a suitable methanogenic bacteria, in this case marine sludge from a fish farm, it gives a methane yield of 0.104 Nm3 kg-1 VS. We also checked the in situ biomass yield of the biofilm (3.16 g AFDW m-2 d-1 and 7.71 g AFDW m-2 d-1, for the primary tank and secondary tank respectively), and the growth of this biofilms in photobioreactors (PBR). When grown in PBR, the algae composition of biofilm from the primary tank becomes dominate by a unicellular chlorophyta and produces 0.24 kg AFDW m
-3 d-1 of biomass; while biofilm from the secondary tank becomes dominated by the
filamentous chlorophyta Stigeoclonium, and has a biomass yield of 0.48 kg AFDW m-3 d-1. The biofilms growing the WWTP of the EDAR del Sureste, in Gran Canaria, are a free naturally available source of biomass, and we have shown in this study that this biofilm, besides being used as a natural agent for nutrient removal in a WWTP, it has also the potential of being used as a low cost, green source of biomass for methane production.
KEYWORDS
Biogas; methane production; microalgae; wastewater treatment plant. https://doi.org/10.15626/Eco-Tech.2010.096
1 INTRODUCTION
The rapid increase in the human population in the last century, and the continuous increase of the global demand for energy since the industrial revolution combined with the use of fossil fuels have caused a series of environmental problems (climate change, green house effect, pollution and depletion of water resources), which the human race has now to face and find appropriate solutions. Finding solutions that could tackle more than one environmental problem at the time would be highly attractive, both at the environmental as at the economical point of view.
Eventually, the use of fossil fuels will have to be substituted by renewable, carbon-neutral sources of biofuel. However, the first generation of biofuels produced from plant sugars (ethanol) and lipids (biodiesel) have comparatively bad energy balance, besides displacing agricultural land before designated to food crops [1, 2]. The use of microalgae (which has the potential of fast growth and be cultivated on non-arable areas or directly in water bodies) for biofuel production (by the conversion of the whole plant, as done for the second generation biofuels) is far more promising [1, 2, 3,4].
Integrated approaches, i.e., the production of algal biomass with more than one purpose, increase the economic value of this commodity. Two of the most prominent niches are its use for wastewater treatment and biofuel production [5]. Microalgae enhance the removal of nutrients, organic contaminants, heavy metals, and pathogens from wastewater, at the same time they furnish an interesting raw material for the production of high-value chemicals or biofuel [6].
Therefore, the objectives of this study were to analyse the possibility of using microalgae biofilms that naturally grow on wastewater treatment tanks to produce methane, coupling the use of this algae as nutrient removal agent to the production of a low cost, sustainable biofuel. Besides studying the possibility of
directly using the algal biofilm from the treatments tanks, we also studied the possibility of growing these algae in PBR, the growth rate, and what species would dominate the community under these conditions.
2 MATERIALS AND METHODS 2.1 Sampling of the algal material
The algal materials used in the methane production tests were biofilms that naturally grow on the wall of the tanks of a wastewater treatment plant (WWTP). The WWTP was the EDAR (Estacion de Depuracion de Agua Residual) del Sureste, Mancomunidad Intermunicipal del Sureste de Gran Canaria, managed by Acciona Agua, and the algal biofilm was collected from the primary (from now onwards refereed to as T1 – tank 1) and secondary (T2) treatment tank. These tanks have an inside wall (71 and 78 cm inwards from the external wall, respectively), with an upper part, where wastewater is always running over, of 33 and 29 cm respectively. The biofilm grows, and was collected from this upper part of the inside wall from both T1 and T2. Samples were collected with a shovel, passed through a net (50 µm mesh-size) and put on sampling bottles.
After sampling, the algal material was brought to the laboratory at the Marine Biotechnology Centre (ULPGC), where samples were taken for algal isolation, for inoculation on
photobioreactors (PBR), and to measure dry weight (ash-free dry weight – AFDW) of the material. The remaining biomass was frozen to be used in methane production test.
2.2 Isolation and identification of algal material
The initial isolation of the algal biofilm was done at the Botanical Institute at University of Cologne. The samples from T1 were first separated by colour (two distinct colours were observed in the biofilm: red and green). Biofilm grown on T2 presented visually only a green coloration. Standard isolation techniques were then applied (e.g. dilution, low-intensity ultrasonication, inoculation in six different culture mediums). Algal identification was made by microscopic observation using an inverted microscope. Identification was made up to genus level, whenever it was possible.
2.3 Growth of the Biofilms in Photobioreactors
An inoculum of the samples from T1 and T2 was taken to grow the algae in photobioreactors (PBR) of 1.5 l, vertically arranged, under direct sunlight. Besides the possibility of directly using the algal biofilm that naturally grows on the treatments tanks, we wanted to study the possibility of growing these algae in PBR, the growth rate, and what species would dominate the community under these conditions.
Five different treatments were applied:
• 1. Biofilm from T1 grown with culture medium: the algae were inoculated in four 1.5 litre PBR, containing 1.3 l of fresh-water MBA1 medium [7]. The algae were grown under directly sunlight and natural conditions in a green house with no roof at the Marine Biotechnology Centre, ULPGC, in the Canary Islands.
• 2. Biofilm from T2 grown with culture medium: algae from T2 grown at the same conditions as above.
• 3. Biofilm from T1 grown with water collected from the primary treatment tank: we inoculated the algae from the biofilm grown in T1 with water collected directly from T1, after a previous treatment to reduce turbidity (1. decantation by gravity, 2. treatment with Ca(OH)2 and decantation, 3. flocculation with FeCl3, and 4. correction of pH).
• 4. Biofilm from T1 grown with water collected from the secondary treatment tank: we inoculated the algae from the biofilm grown in T1 with the water from T2. No treatment was necessary here, since this water had low turbidity (13.01 NTU, average turbidity value for this tank; data EDAR del Sureste, Acciona Agua).
• 5. Biofilm from T2 grown with water collected from the secondary treatment tank: we inoculated the algae from the biofilm grown in T2 with water collected directly from T2.
1 MBA is a culturing medium developed during the studies of the project ALGADIESEL
(Marine Biotechnology Centre, ULPGC), which was formulated to cover all nutrients necessities of algae, at the same time that it kept the same standard nutrients ratio as in most culturing medium (16:1, N:P). It was also developed to make a low cost culturing medium. This was made by using fertilizers (NPK) as the source of nitrate, phosphate and Magnesium, instead of analytical reagents.
We followed the algal growth in these PBR by monitoring fresh weight (FW) or optic density (OD), depending on the algae present. Fresh weight was measured by harvesting total culture biomass with a 20 µm mesh-size net, weighting the biomass, and returning it to the culture medium. Optical density was measured in a spectrometer at 680 nm, diluting it when necessary so the values would range between 0,2 and 0,8. The values of FW and OD were converted to dry weight (ash-free dry weight, AFDW). The growth rate and biomass yield of each treatment was calculated.
The algae from the two first treatments are, up to now, being kept growing in PBR in order to collect biomass to perform a methane potential assay with the algae that dominated the community in the PBRs.
2.4 Methane potential bioassays
Methane potential bioassays were carried using the Automated Methane Potential Test System (AMPTS), developed by Bioprocess Control AB (BPC), Sweden. The AMPTS makes on-line measurements of bio-methane flows of any biological degradable substrate (both solid and liquid form) at the laboratory scale, and consists of a water-bath with controlled temperature, and 15 bottles were the biodigestion occurs, of 15 CO2-fixing bottles (one for
each digestion bottle), and of a volume measuring device connected to each digestion bottle, which makes on-line measurements. The AMPTS follows the same measuring principles as conventional methane potential tests, making the results comparable with standard methods. Methane released from the digestion bottles is analyzed using a wet gas-flow measuring device with a multi-flow cell arrangement (15 cells, one for each bottle). This measuring device works according to the principle of liquid displacement and can monitor an ultra low gas flow, where a digital pulse is generated when a defined volume of gas flows through the device. It only registers methane flow, since several gas fractions, such as CO2 and H2S, are removed by the alkali solution in the CO2-fixing bottles. A data acquisition system is used
together with the flow cells in order to record, display and calculate data [8].
The assays were conducted by mixing, separately, the algal biofilm from T1 and T2 with cow manure, in duplicate bottles. The cow manure received the following previous treatment: it was pasteurized (70ºC for 2 hours in order to eliminate non-methanogenic bacteria), then these bacteria substrate was left for 20 days at room temperature and vented from time to time to release the gases that these bacterial substrates were still producing gases (from the original nutrients that it contained). After this conditioning, this substrate has been used every since in methane potential bioassays. Controls were made by adding only bacterial substrate (cow manure) to the digestion bottles.
Furthermore, the algal biofilm from T1 was also mixed with sludge from a marine fish farm, previously treated in the same way as the cow manure (i.e., pasteurized at 70ºC for 2 hours, left 20 days, and used every since in methane potential bioassays). Another methane bioassay where the algal biofilm from T2 will also be mixed with the marine sludge is scheduled. Also, a control was made were only marine sludge bacteria were added to the digestion bottles. The results of the MP bioassay are expressed in Nm3 of methane per kg of volatile solids (VS)
(Nm3 kg-1VS). Nm3 means that the volume of methane (m3) produced was normalized by standard temperature and pressure. VS is exactly the same thing as the ash-free dry weight (AFDW), i.e., is the dry weight minus the inorganic part. All our biomass values (of fresh weight or optical density) where transformed to AFDW, i.e., VS. We chose to use the VS
nomenclature and express our values in Nm3 kg-1VS because this is the most common unity found in the literature to express methane potential. For comparisons, values expressed in Nm3 kg-1VS can also be expressed in Nlitres g-1 VS, since it is a direct conversion.
pH was measured at the beginning and at the end of the assays, which lasted for 30 days. Also salinity was measured in the bottles, since we added marine sludge bacteria. This was made to check for possible inhibiting factors.
2.5 Biomass yield and methane potential of the biofilms from the treatment tanks
After the initial biomass sampling at the WWTP, two more samplings were conducted to measure and calculate the biomass yield of the tank, and the methane potential of the tanks. To measure the biomass yield of the tanks, an area of 957 cm2 (33 x 29 cm), and 928 cm2 (32 x 29 cm) was collected from T1 and T2, respectively, on two occasions. The same area was collected in each occasion, with an interval of 7 days between each sampling, and thus, the increase in the biofilm biomass could be measured. The FW biomass was measured, and the values converted to dry weight (AFDW), given the biomass yield (in g AFDW m-2 d-1). With the area of the internal wall of the tank (the upper part, where we collected the biofilm), we calculate the biomass yield per day of each tank (in g AFDW d-1). With these data and
with the data from the methane production tests, we calculated the methane potential of the tank.
3 RESULTS AND DISCUSSION
3.1 Algal taxonomic identification and isolation
The taxonomic identification showed that the algae present in the two initial fractions of T1 (separated visually based on the colours) were basically the same. Thus, the results are
presented as a unique set for T1. The main difference between the two initial samples was that the algae present in the red fraction was constituted by aggregates of filaments (mostly
cyanobacteria) that broke during the isolation process, and that were very difficult to identify due to size (specially of unicellular algae) and because of the high amounts of bacteria present, indicating that this fraction was degrading. Biofilm from T2 was always treated as a unique sample.
Primary treatment tank (T1)
The algal biofilm growing on the primary treatment tank was dominated by filamentous cyanobacteria. Unicellular cyanobacteria and chlorophyta were also present, but were less abundant. The algae present were as follows:
• Cyanobacteria:
- Oscillatoriales (filamentous): Oscillatoria, Leptolyngbya, Phormydium, Limnothrix - Chroococcales (unicellular): Synechococcus, Chroococcus
• Chlorophyta:
- Chlamydomonadales: Chlamydomonas - Chlorellales: Chlorella, Oocystis - Sphaeropleales: Scenedesmus
Secondary treatment tank
The filamentous chlorophyta Stigeoclonium dominated the biofilm on the secondary tank, which gave the green colour that could be observed visually. It was also observed the
presence of filamentous and unicellular cyanobacteria, unicellular chlorophyta, and also some diatoms (Bacillariophyta), but in less quantity. The algae present were as follows:
• Cyanobacteria:
- Oscillatoriales (filamentous): Oscillatoria - Chroococcales (unicellular)
• Chlorophyta:
- Chaetophorales (filamentous species): Stigeoclonium - Chlamydomonadales: Chlamydomonas
- Chlorellales: Oocystis • Bacillariophyta:
- Fragilariales: Synedra Algal isolation
The first attempts to isolate the algae were mostly unsuccessful due to the high quantities of bacteria present, which took over the algae when in culture. Some cultures with isolated
Stigeoclonium were successful, and are in the process of increasing biomass for further
purification. Further attempts to isolate the algae will be conducted. After the algae have been isolated, and enough biomass has been acquired, we intend to test each isolate for its methane potential. In this way, we could estimate the percentage with which each of the algae present were contributing for the production of methane from the biofilm. Furthermore, the algae with the highest potential will be grown in PBR to increase the production of its biomass, and to be used in further tests.
3.2 Growth of the algal biofilms in photobioreactors (PBR)
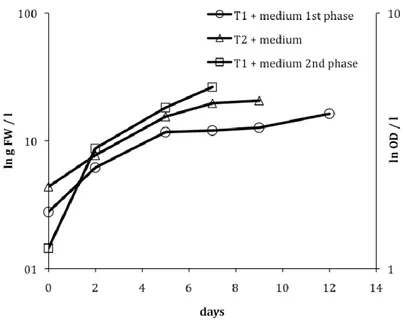
From the five treatments used (see M&M), the algae only grew in the treatments were culture medium was added (i.e., Biofilm T1 + medium and Biofilm T2 + medium) (see Figure 1). The growth of the biofilm in the PBR for these two treatments was as follows:
Biofilm T1 + medium:
The growth of the biofilm from T1 in culture medium was divided in two phases: first, the culture was dominated by filamentous cyanonacteria, as it occurred in situ in the primary wastewater treatment tank; afterwards, in a second phase, unicellular Chlorophyta (Scenedesmus and Chlorella) dominated the culture. The growth curve for these two different phases is shown in Figure 1, and growth rate, and biomass yield are shown on Table 1. For the first phase, the growth was monitored by measuring fresh weight, and the growth of second phase, which was dominated by unicellular algae, was monitored by optical density. Biofilm T2 + medium:
Filamentous Chlorophyta (Stigeoclonium) dominated the algal community in the PBR inoculated with the biofilm from T2, as it did in the treatment tank. Its growth curve is shown in Figure 1, and the growth rate, and biomass yield is shown on Table 1.
Figure 1. Growth curve for the treatments Biofilm T1 + medium (phase 1 (o) and phase 2 ( )), and for Biofilm T2 + medium (Ì). The curve of Biofilm T1 + medium phase 1 and Biofilm T2 + medium is showed in log scale for the ln g of fresh weight per litre; and for Biofilm T1 + medium phase 2 the curve is showed in log scale for the ln of the optical density per litre.
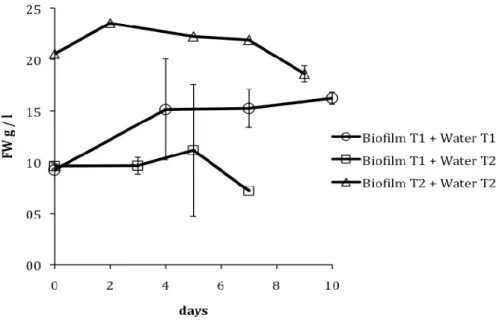
In the treatments were water from the treatments tanks was added to the algae (i.e., Biofilm T1 + water T1, Biofilm T1 + water T2, Biofilm T2 + water T2), the culture maintained itself for about 7 days in stationary phase, and start to decrease in biomass (see Figure 2). Even during these 7 days, microscopic observations showed that most of the cells of the culture did not have chlorophyll a anymore and were dying.
Figure 2. Growth curve (in g of fresh weight per litre) of the algae for the treatments were water from the treatments tanks were added (i.e., Biofilm T1 + water T1, Biofilm T1 + water T2, Biofilm T2 + water T2).
The algae could not grow in these waters probably due to the lack of available nutrient (data not shown, since inorganic nutrient analysis is not one of the parameters analysed at the WWTP). The growth of the algae in the treatments were culture medium (with nutrients) was added, support the hypothesis that the lack of nutrient limited the growth of the algae grown directly with water from the treatments tanks. The fact that the biofilm, both in T1 as in T2 naturally grows in the tanks, only with the water from the tanks can be explained by the fact that, in the tanks, wastewater is constantly running over the tank wall, where the biofilm grows, bringing, therefore, constantly new load of nutrient, which can, in this case, support algal growth.
Since both resources were available for free use (both the algal biofilm and the water from the tanks) we wanted to test if we could use both to produce algal biomass, with the minimum resource input, and which could be used for biogas production. However, as shown, the growth of the algae with wastewater in PBR was not viable. But, nevertheless, we still could grow the algae with MBA culture medium, under directly sun light. MBA culture medium is a very cheap medium, made with commercially available fertilizer as source of NO3 and PO4,
and which requires no vitamin addition, thus making the growth of these algae still economically viable. Furthermore, the biomass yield obtained from these cultures when grown in the PBR with medium was very high (see Table 1). An average annual productivity of microalgae biomass in a tropical region can be around 1.5 kg m-3 d-1 of fresh weight [9, 10]. The Biofilm from T1 + medium (1st phase) gave a biomass yield of 1.78 kg m-3 d-1 (fresh
weight), and the Biofilm from T2 + medium, a biomass yield of 2.65 kg m-3 d-1 (fresh weight), almost 2x higher than the average microalgae productivity for tropical regions. The biomass of Biofilm from T1 + medium (2nd phase) is not expressed in fresh weight, since its growth was measured by optical density. The biomass yield of all three treatments is expressed in standard ash-free dry weight in Table 1. Nevertheless T1 + medium (2nd phase) has a biomass yield (in dry weight) even higher than during the first phase. However, the
growth of the unicellular microalgae that dominated during the second phase might not be so economically viable, since more expensive harvesting techniques (such as centrifugation) have to be applied to collect the algal material. Thus, the growth of the filamentous algae that dominated the Biofilm from T1 + medium (1st phase) and Biofilm from T2 + medium treatments, both of which gave a high biomass yield might be the better options.
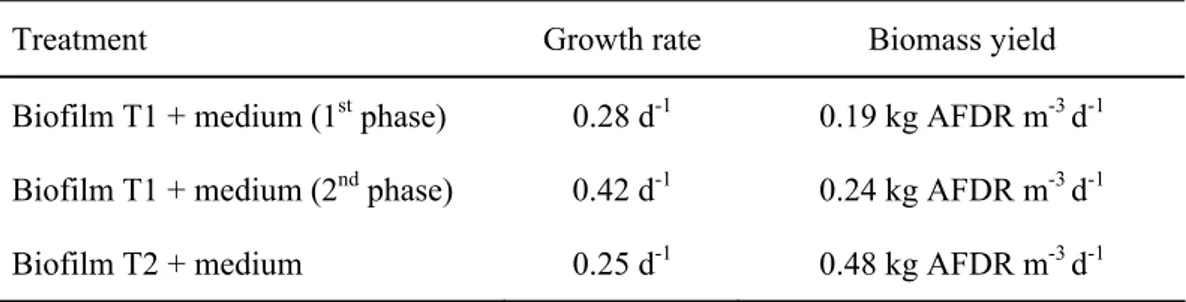
Table 1: the growth rate and biomass yield (in ash-free dry weight) for the algal biofilm from T1 and T2 inoculated with culture medium and grown in photobioreactors. The result is shown for the two phases of culture growth for the treatment Biofilm T1 + medium.
Treatment Growth rate Biomass yield
Biofilm T1 + medium (1st phase) 0.28 d-1 0.19 kg AFDR m-3 d-1
Biofilm T1 + medium (2nd phase) 0.42 d-1 0.24 kg AFDR m-3 d-1
Biofilm T2 + medium 0.25 d-1 0.48 kg AFDR m-3 d-1
We should notice that the biomass yield, which is given per litre per day, is variable, since the growth of the algae is not linear (it follows the standard growth curve with a lag, an exponential, stationary, and senescent phase). Thus, depending on when the biomass is harvested the biomass yield can be different. The values presented here are the average biomass yield for exponential phase and intervals between 2 and 5 days. A constant data to estimate biomass is the growth rate, which is always calculated during the exponential growth. For maximum biomass harvesting, the culture should be maintained in exponential growth.
To make the use of microalgae for biofuel production to be economically viable, it is necessary to use a low cost method of cultivation and harvesting. Therefore, studies that have used improved culture mediums, pre-treatments to increase the methane production, and algae that require expensive harvesting techniques may have demonstrated high methane yields [1], but may not be economically viable.
3.3 Methane potential of biofilm from Tank 1 and 2
Methane potential assays
Methane production was observed in the three treatments made (Biofilm T1 + cow manure; Biofilm T2 + cow manure; and Biofilm T1 + marine sludge) (see Table 2, column 2). However, quite high methane production was also observed in the cow manure control. This production was higher than the production observed in the Biofilm T1 + cow manure treatment, and also a little higher than the production in of the bottles from the Biofilm T2 + cow manure treatment. Thus, when correcting the value for the production of the control, the methane potential (MP Nm3 kg-1 VS) of the treatments with bacteria substrate from cow manure was negative. The second bottle of the Biofilm T2 + cow manure treatment had a production a little higher than in the control, but in average, the methane production was negative (see Table 2). Nevertheless, there was high methane production in the Biofilm T1 + marine sludge treatment, with a MP of 0.104 Nm3 kg-1 VS.
Table 2. Volume of methane (l) produce, and methane potential (MP) for each replicate of each treatment. Column 4 shows the average MP for each treatment with their respective standard deviation (SD). The volume of methane produced is transformed in MP by subtracting the volume produced by the control and normalized by the grams of ash-free dry weight (i.e., VS) added to each bottle.
Treatment Vol. Methane
produced (Nl) MP (Nm
3 kg-1 VS) Average ± SD MP
(Nm3 kg-1 VS) Biofilm T1 + cow manure 0.201 -0.071 -0.071 ± 0.00 Biofilm T1 + cow manure 0.204 -0.071
Biofilm T2 + cow manure 0.847 0.013 -0.009 ± 0.03 Biofilm T2 + cow manure 0.665 -0.030
Biofilm T1 + marine sludge 1.438 0.117 0.104 ± 0.02 Biofilm T1 + marine sludge 1.119 0.091
Cow manure control 0.769 Marine sludge control 0.031 Marine sludge control 0.034
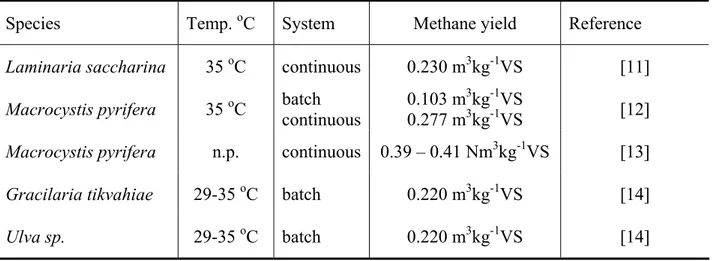
The marine sludge seams to be a more stable substrate, and since the methane production in the marine sludge control was low, we could better observe the methane potential of the algal biofilm in this treatment, which was comparable to values of methane production of macroalgae, especially comparing with similar batch experiments (see Table 3).
Table 3. Methane yield for some macroalgae in continuous and/or batch systems. n.p. = data not provided
Species Temp. oC System Methane yield Reference
Laminaria saccharina 35 oC continuous 0.230 m3kg-1VS [11]
Macrocystis pyrifera 35 oC batch continuous 0.103 m
3kg-1VS
0.277 m3kg-1VS [12]
Macrocystis pyrifera n.p. continuous 0.39 – 0.41 Nm3kg-1VS [13]
Gracilaria tikvahiae 29-35 oC batch 0.220 m3kg-1VS [14]
Ulva sp. 29-35 oC batch 0.220 m3kg-1VS [14]
The fact that the treatments with biofilm + cow manure produced less methane than in the control, indicates that there should be something inhibiting the process in these treatments,
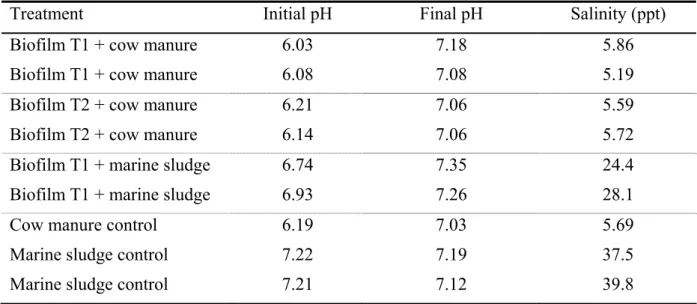
since, even if methane would not have been produced by the digestion of the algal material, it should have, at least, produced the same amount of methane as in the control. We measured the pH in the digestion bottles at the beginning and at the end of the test, since low pH may inhibit the methanogenic process (see Table 4). Although the pH in the treatment with marine sludge was a little bit higher than in the other treatments (the seawater, which was present in the marine sludge, has buffer properties, keeping the pH more stable in these treatments), there was no great differences, especially between the treatments with cow manure and its control. Thus, there must have been another factor inhibiting the reactions in those treatments, which has still to be investigated.
However, if we observe that the anaerobic digestion of the algal biofilm from tank 1 produced methane when added to the marine sludge bacteria, we can see that this material has potential for use for methane production, it is only dependent on the type of bacteria substrate that is added to it, and on controlling possible inhibiting factors. It also indicates that the algal biofilm from T2 can have similar potential if mixed with bacteria from marine sludge. One methane bioassay where the algal biofilm from T2 will also be mixed with the marine sludge is scheduled. And afterwards, a further step of the research is to test other different marine substrates, and to improve the test conditions, to test if we can increase the methane production.
Table 4. Initial and final pH in every test bottle and salinity.
Treatment Initial pH Final pH Salinity (ppt) Biofilm T1 + cow manure 6.03 7.18 5.86 Biofilm T1 + cow manure 6.08 7.08 5.19 Biofilm T2 + cow manure 6.21 7.06 5.59 Biofilm T2 + cow manure 6.14 7.06 5.72 Biofilm T1 + marine sludge 6.74 7.35 24.4 Biofilm T1 + marine sludge 6.93 7.26 28.1
Cow manure control 6.19 7.03 5.69
Marine sludge control 7.22 7.19 37.5 Marine sludge control 7.21 7.12 39.8
Biomass yield and methane potential of algal biofilm from tank 1 and 2
Table 5 shows the in situ biomass yield (ash-free dry weight) for the biofilm in tank 1 and 2, and the production of each tank, calculated based on the area of the tank and the biomass yield.
Table 5. In situ biomass yield of the algal biofilm growing on tank 1 and on tank 2 of the wastewater treatment plant; the total biomass production of each tank per day (considering the area where the biofilm grows), and the methane potential (MP) per day of each tank
(considering each tank biomass production, and the methane potential of 0.104 Nm3 kg-1 VS, which is the methane potential found in the methane assay for the treatment Biofilm T1 + marine sludge.
Treatment Biomass yield of biofilm (g AFDW m-2 d-1) Tank biomass production (g AFDW d-1) MP of tank (Nm3 d-1)
Tank 1 3.16 40.13 0.004
Tank 2 7.71 106.41 0.011
A biomass yield of T1 and T2 (which in fresh weight was 0.063 kg m-2 d-1, and 0.154 kg m-2 d-1, respectively) is not very high if compared with the annual average productivity of microalgae biomass for tropical region (= 1.5 kg m-3 d-1 of fresh weight, [9, 10]). However, we should consider that this was the biomass yield on a surface (area), and not on volumes (m3) as it is shown for the annual average productivity. Nevertheless, because the tanks have a low biomass yield, the amount of methane that can be produced using directly the tank’s biofilm is not very high. Considering the growth rate and biomass yield that can be obtained when growing these algae in PBR, this seems to be a better alternative to produce higher amounts of biomass.
The biofilms growing the WWTP of the EDAR del Sureste, in Gran Canaria, are a free naturally available source of substrate. Nowadays, this biomass is being periodically removed from the tanks and discarded. This available material could be used, if not as a sole source of substrate for biogas production, at least in combination with other material (as the biomass produced in the PBR), since it implicates in no production cost, thus a better use of this material would only be beneficial.
Microalgae have been used in wastewater treatment plants to enhance the removal of nutrients, organic contaminants, heavy metals, and pathogens from the wastewater [6, 15]. Therefore, the use of this biomass means a low cost, environmental friendly process, with the economical and environmental advantages of enhancing the removal of nutrients from wastewater, and producing sustainable biofuel.
4 CONCLUSIONS
The biofilms naturally growing on the walls of the wastewater treatment tanks of the EDAR del Sureste, in Gran Canaria are formed by a consortium of algae dominated by filamentous cyanobacteria (T1) and chlorophyta (T2). These biofilm can be grown in PBR with a basic culturing medium producing high yields of biomass (higher than the average microalgae biomass yield for tropical regions). Due to the reduced area that the biofilms have to grow in the treatment tanks, the biomass yield that the tanks produce is not very high. Nevertheless, the methane potential of these biofilms is equivalent to those of macroalgae species (0.104 Nm3 kg-1 VS). Here we have demonstrated that it is possible to grow the filamentous algae present in the biofilms from T1 and T2 in PBR, with low cost, and producing high biomass yields. Thus the growth of the algal biofilm in PBR can be used to as an alternative method to produce biomass. Furthermore, the free available algal biofilm could be used in combination with the biomass produced in PBR for methane production. Therefore, we have shown in this study that microalgae, besides being used in WWTP as a natural agent for nutrient removal, have also the potential of being used as a low cost, green source of biomass for methane production.
ACKNOWLEDGEMENTS
The authors would like to thank Eva Maria Garcia Romero and the personnel from the WWTP EDAR del Sureste, Mancomunidad Intermunicipal del Sureste de Gran Canaria; Agueda Angulo Montesdeoca, for helping with the algae cultivation in PBR; Moneiba Suarez Lozano, for helping with biofilm sampling; and Barbara Surek and Michael Melkonian at the Botanical Institute, University of Cologne for helping with the algae isolations, and use of the Institute’s facilities.
REFERENCES
1. Mussgnug, J.H., Klassen, V., Schlüter, A., Kruse, O., 2010. Microalgae as substrate for fermentative biogas production in a combined biorefinery concept. J. Biotechnol. In Press, Corrected Proof, Available online 4 August 2010.
2. IEA, 2010. Sustainable Production of Second-Generation Biofuels (Report). URL:
http://www.iea.org/papers/2010/second generation biofuels.pdf.
3. Rittmann, B.E., 2008. Opportunities for renewable bioenergy using microorganisms.
Biotechnol. and Bioengineering 100, 203–212.
4. Stephens, E., Ross, I.L., King, Z., Mussgnug, J.H., Kruse, O., Posten, C., Borowitzka, M.A., Hankamer, B., 2010. An economic and technical evaluation of microalgal biofuels.
Nature Biotechnology 28, 126–128.
5. Richmond, A., 2004. Biological principals of mass cultivation. In: A. Richmond (Ed.) Microalgal Culture: biotechnology and applied phycology. Blackwell Science, Oxford, 125-177.
6. Muñoz, R., Guieysse, B., 2006. Algal-bacterial processes for the treatment of hazardous contaminants: a review. Water Research. 40(15), 2799-2815.
7. Proyecto ALGADIESEL, 2009. Informe final del proyecto “Producción de Microalgas Marinas Lipogénicas en Fotobiorreactores Tubulares”. Diciembre 2009.
8. Bioprocess control, 2009. AMPTS-2009-01- Automatic Methane Potential Test System. Operator’s and Maintenance Manual.
9. Chisti, y., 2007. Biodiel from microalgae. Biotechnol. Adv. 25, 294-306.
10. Sánchez Mirón, A., Contreras Gómez, F., García Camacho, F., Molina G., Chisti, Y., 1999. Comparative evaluation of compact photobioreactors for large-scale monocultures of microalgae. J. Biotechnol. 70, 249-270.
11. Hanssen, J.F., Indergaard, M., Ostgaard, K., Baevre, 0. A., Pedersen, T.A., Jensen, A., 1987. Anaerobic digestion of Laminaria spp. and Ascophyllum nodosum and application of end products. Biomass, 14, l-13, as cited by: Gunaseelan, V.N., 1997. Anaerobic Digestion of biomass for methane production: a review. Biomass and Bioenergy 13(1/2): 83-114.
12. Chynoweth, D. P., Srivastava, V. J., 1980. Methane production from marine biomass. Paper presented at International Symposium on Biogas, Microalgoe and Livestock Wastes, Taipei. Taiwan. Institute of Gas Technology. IL. 15-l 7 September. 1980, as cited by: V.N. Gunaseelan., 1997. Anaerobic Digestion of biomass for methane production: a review. Biomass and Bioenergy 13(1/2): 83-114.
13. Chynoweth, D. P., Turick, C. E., Owens, J. M. Jerger, D.E., Peck, M.W., 1993.
Biochemical methane potential of biomass and waste feedstocks. Biomass and Bioenergy 5(1): 95-111, as cited by: Yokoyama, S., Jonouchi, K., Imou, K., 2007 Energy Production from Marine Biomass: Fuel Cell Power Generation Driven by Methane Produced from Seaweed. World Academy of Science, Engineering and Technology, 320-323. URL:
http://www.waset.ac.nz/journals/waset/v28/v28-58.pdf .
14. Habig, C., De Busk, T.A., Ryther, J.H., 1984. The effect of nitrogen content on methane production by the marine algae Gracilaria tikvahiae and Ulva sp. Biomass, 4, 239-251, as cited by: Gunaseelan, V.N., 1997. Anaerobic Digestion of biomass for methane production: a review. Biomass and Bioenergy 13(1/2): 83-114.
15. Raja, R., Hemaiswarya, S., Ashok Kumar, N., Sridhar, S., Rengasamy, R., 2008. A perspective on the biotechnological potential of microalgae. Critical Reviews in