Modeling a large scale train network
Carl RydholmPer Vingå
Lund University, Faculty of Engineering Division of Production Management
A well operating train line requires thorough planning. Developing timetables is a crucial part of the planning process, but equally important is having good material plan and personnel plan. These three parts all depend on each other, a good timetable is not automatically good for the material plan and the personnel or vice versa. Producing a good combination of plans is a time consuming process that has to be performed every time a new timetable is needed either because of prolonged maintenance or other interferences, or new requirements in number of departures. The process of timetabling is mostly manual with few aids available. This article describes the process of developing simulation tools aimed to aid the planer in his or her daily work of creating new timetables. Two simulation models are developed to test if a suggested timetable is feasible and robust. The models can also be further developed in order to include both material plan and personnel plan.
Background
This article is based on the results of the master’s thesis Rydholm and Vingå (2014) at Lund University, carried out in collaboration with Arriva DK. The company is the Danish branch of Arriva Group which is one of the largest public transport companies in Europe with more than 50 000 employees. In 2003, two years after the Danish railway monopoly was dissolved Arriva DK started operating trains in Jutland. Today Arriva operates seven interconnected train lines on Jutland corresponding to about 17% of the total railroad traffic in Denmark (Arriva 2014).
Timetabling at Arriva DK today is a manual process mostly relying on experience and with few computerized aids. The fact that most of the tracks between stations are single tracks, only allowing trains to meet on stations, makes the process even more complicated.
Railroad traffic is faced with several difficulties such as harsh weather and accidents that lead to uncertainties in the operation. Major disturbances will put any timetable out of balance, but a good timetable should be robust and be able to withstand smaller disturbances in the everyday operation.
Objective
The objective with the thesis is to help Arriva develop two simulation models of Arrivas train network in Jutland, one deterministic model and one stochastic model. The purpose of these models is to aid the timetabling process.
The deterministic simulation model is designed to test if a timetable is feasible provided that there is no uncertainty and variation in the system. In other words, all trains will depart and arrive on time according to the timetable if there are no trains scheduled on the same track at the same time.
The stochastic simulation model is designed to test and compare the robustness of different timetables by including everyday variations and disturbances in the transport time and the time spent on stations.
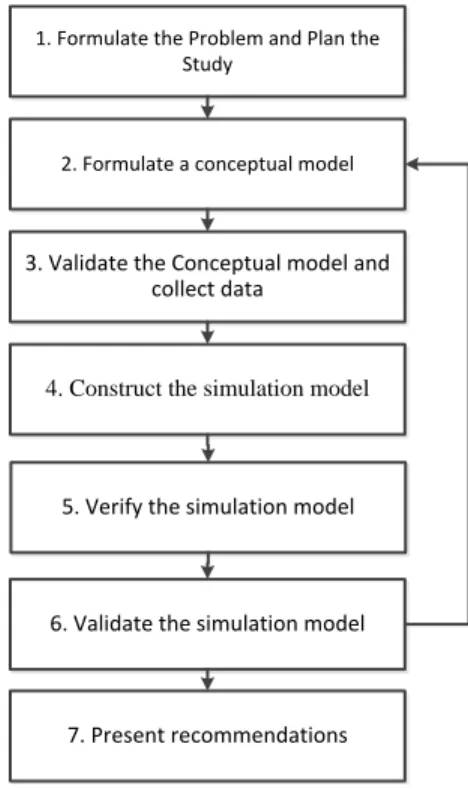
Method for simulation model development There are several different ways to conduct a simulation study. The method used to develop the simulation models in this project is a modified version of the process presented in (Hillier & Lieberman 2010). The method has been modified to focus only on the development of the simulation models and leave out the actual simulation study, see Figure 1.
Figure 1 - Process for developing the simulation models
The process starts with interviewing personnel at Arriva to formulate the problem of the study. The next step is to create a conceptual model as a foundation for the simulation models. The conceptual model is created by analyzing structural data about the train network and
listing necessary assumptions for both simulation models. The conceptual model is validated by discussing the assumptions that have been made and also inspecting the models logical structure. To create the actual simulation models data about arrivals, departures and number of passengers from all stations are collected and analyzed as well as the actual timetable. The simulation models are created in ExtendSim, a simulation software with graphical interface and programmable building blocks for continuous and discrete event simulation. After building the simulation models they are tested to ensure that they are working correctly. They are also validated to ensure that the results are reasonable. The validation process is described in detail on the next page.
Model design
The deterministic simulation model simulates the train network during a day with no variation or uncertainty, and therefore it is essentially a matter of reconstructing the railroad infrastructure with a set of inputs and outputs for data.
The stochastic simulation model uses the same foundation as the deterministic model but the most essential parts are modified to account for uncertainty in transport time between stations and time spent on stations. The stochastic model can be viewed as a generalization of the deterministic model.
Accounting for uncertainty in the system There are essentially two areas of uncertainty in the system. Variation in transport time and variation in time spent on stations. There are many reasons why these times vary: weather, accidents, crowding on stations etc. One factor that undoubtedly affects the amount time a train has to stop on a station is the number of passengers that enter or leave the train. It is 1. Formulate the Problem and Plan the
Study
2. Formulate a conceptual model
3. Validate the Conceptual model and collect data
4. Construct the simulation model
6. Validate the simulation model
7. Present recommendations 5. Verify the simulation model
favorable to analyze how the time spent on station depend on how many passenger enters of leaves the train, because then you are able to see what will happen if for example the number of passengers increases by 10%. The time spent on station is therefore broken down into two parts:
1. How many passengers enters and leaves the train
2. The time spent on the station
depending on the number of passengers
The number of passengers varies significantly over the course of the day and is taken into account in the simulation model.
Historical data from Arriva DK is analyzed in order to derive probability distributions for transport time, number of passengers and time on station.
There are other factors than the number of passengers that affect how long the train stays on the station. The main reason is that there are other trains on the track. These factors are not considered in the probability distributions; instead they are managed by the logic of the simulation models.
Validating the simulation models
The deterministic simulation model is validated by running a simulation with the timetable that is currently in use. Since the timetable is already in use at Arriva, it should be feasible and free from free from conflicts. To make sure that the logic of the model is working, conflicts are created on purpose, which results in late trains that can be seen in the output data of the simulation model.
Validating the stochastic model requires more work. In order to see if the simulation model provides plausible results a reference data set
has to be derived from the original data provided by Arriva DK. The reference data set consist of mean and standard deviation values for regularity and delay per station, transport times, passengers and time spent on stations.
Results of the validation
Validation shows that the timetable has no conflicts when running the deterministic simulation model. When conflicts are added on purpose the model registers the late trains as was intended. In conclusion the model seems to be valid.
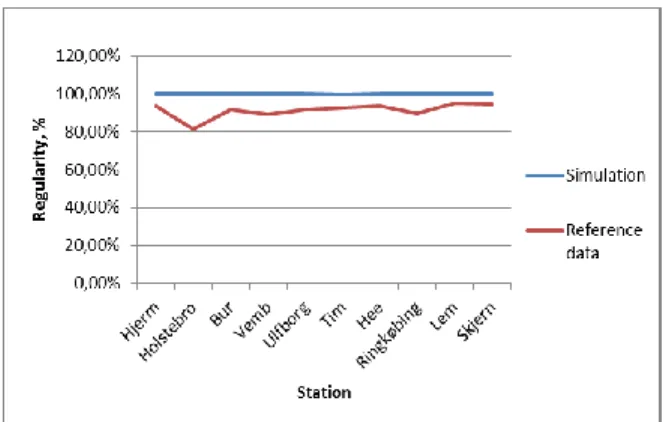
However the output from the stochastic simulation model does not resemble the reference data set satisfactory. Simulation results show almost 100 % regularity on all stations but in reality the regularity is generally around 90%, see Figure 2. The main reason for the discrepancy is that the simulation model only deals with the timetable and not with the material plan or personnel plan. The reference data shows that there is an initial delay at starting stations. The main reason for this delay is believed to be waiting for the train and personnel to be in the right place, that is the material plan and the personnel plan. New simulations are carried out with delays at starting stations to compensate for the missing material plan and personnel plan.
Figure 2 – Regularity comparison with adjusted parameters for time on station
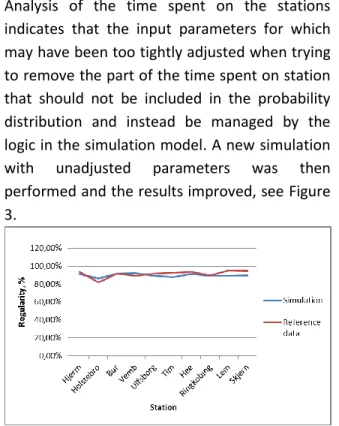
Figure 3 - Regularity comparison with unadjusted parameters for time on station
Analysis of the transport time, number of passengers and time on stations in the simulation model show that the first two correspond well with the reference data set and are therefore considered to be valid. However for the latter, the time on station there are some discrepancies between the simulation output and the reference data set. More precisely the times on station are shorter in the simulation than in the reference data set.
Analysis of the time spent on the stations indicates that the input parameters for which may have been too tightly adjusted when trying to remove the part of the time spent on station that should not be included in the probability distribution and instead be managed by the logic in the simulation model. A new simulation with unadjusted parameters was then performed and the results improved, see Figure 3.
Other reasons for discrepancies in the results from the simulation model and the reference data are the decision rules regarding which train that goes first in case two trains want to enter the same track. In the simulation model, the train leaves the station if the track is free. In reality a train can be kept at the station to let another train pass if the traffic controllers consider it favorable. Which train goes first in a certain situation may vary depending on the traffic controller.
During the validation and analysis several deficiencies in the historical data were found. The most serious deficiencies in the data were found in records connected to so called technical stations that are used only for collecting data. Errors in the data collection process affect the reliability of the data connected to these stations but also at adjacent stations.
Conclusion
The deterministic model is considered valid and therefore ready to be implemented as an aid in the timetabling process.
The stochastic model can also be used to some extent to compare timetables but should be developed further. Mainly three parts should be looked into:
1. Reviewing the data collection process and recalculating parameters for the simulation model
2. Testing other rules of prioritization 3. Adding material plan and personnel
plan to the simulation model
For further and more detailed information and conclusions see Rydholm & Vingå (2014)
References
Arriva, 2014. Arriva. [Online] Available at: http://www.arriva.co.uk/ business_activities/ transport_services/denmark/
[Accessed 06 06 2014].
Hillier, F. & Lieberman, G., 2010. Introduction to Operation Research. 9th red. Boston: McGraw-Hill. p.959-963
Rydholm, C. & Vingå, P., 2014.Modellering av tågnät på Arriva DK. Lund: Division of Production Management, Lund University.