SKI Report 98:41
Statistical Patterns of Geochemistry in
Crystalline Rock and Effect of Sorption Kinetics
on Radionuclide Migration
ISSN 1104-1374 ISRN SKI-R--98/41--SEShulan Xu
Anders Wörman
September 1998
SKI Report 98:41
This report concerns a study which has been conducted for the Swedish Nuclear Power Inspectorate (SKI). The conclusions and viewpoints presented in the report are
those of the authors and do not necessarily coincide with those of the SKI.
Statistical Patterns of Geochemistry in
Crystalline Rock and Effect of Sorption Kinetics
on Radionuclide Migration
Shulan Xu
Anders Wörman
Department of Earth Sciences, Uppsala University,
Villavägen 16, SE-752 36 Uppsala, Sweden
September 1998
Contents
Summary 4
Sammanfattning 6
1. General Introduction 8
Part A:
2 Statistical Patterns of Geochemistry in Crystalline rock 9
2.1 Introduction 9
2.2 Materials and Experimental Methods 10
2.2.1 Materials 10
2.2.2 Geostatistical analysis and sampling strategy 10
2.2.3 Method for porosity measurements 11
2.2.4 Method for effective diffusivity measurements 12
2.2.5 Method for surface adsorption selectivity analysis 13
2.3 Results and Discussion 13
2.3.1 Results from porosity measurements 13
2.3.2 Results from effective diffusivity measurements 16 2.3.3 Results from surface adsorption selectivity experiment 18
2.4. Conclusions 19
Part B:
3 Effect of Sorption Kinetics on Radionuclide Migration 21
3.1 Introduction 21
3.2 Models and Criteria of the Effect of Sorption Kinetics 22
of the breakthrough curves 27 3.2.4 Effect of adsorption kinetics, dispersion and
matrix diffusion on solute migration 29
3.2.5 Simulation of the effect of adsorption kinetics 30
3.3 Materials and Experimental Methods 31
3.3.1 Materials 31
3.3.2 Method for determining adsorption kinetics
on crushed rock particles 31
3.3.3 Method for determining adsorption kinetics on intact rock 32
3.4 Results and Discussions 33
3.4.1 Results from measurements of adsorption kinetics on
crushed rock particles 33
3.4.2 Results from measurements of adsorption kinetics on intact rock 37 3.4.3 Effect of adsorption kinetics on migration of
radionuclides in fractures 42
3.5 Conclusions 46
4. General Conclusions 48
5. Acknowledgements 48
6. References 50
Appendix I: Solution to the first two temporal moments of
the probability density function for the residence time 53
Appendix II: Diffusivity data from 4 mm ÄD slabs 57
Appendix III: Diffusivity data from 6 mm ÄD slabs 64
Summary
The overall objective of the current project is to develop a quantitative
understanding of the effects of spatial variability in physical and geochemical properties of the rock on the migration of radionuclides along a single fracture in crystalline rock. The strategy is first to deduce the basic geostatistics of the main model parameters by means of detailed laboratory (batch) experiments on a large number of rock samples taken from Swedish crystalline basement. The results are then analysed by geostatistical methods and used for stochastic interpretations of a series of laboratory migration experiments to be conducted in a later phase of the project.
In an earlier phase of the project, a new mathematical model was developed as a basis for the interpretation of experimental results and the generalisation to
performance assessment (PA) analyses (Wörman and Xu, 1996). The model describes migration of radionuclides along a two-dimensional fracture and includes the
transversal diffusion into the rock matrix and surface. To be able to discriminate between the effects of parameter heterogeneity and potential effects of kinetics, a model description has also been developed for first-order sorption kinetics. The main model parameters are represented as spatially random.
This report contains results from the batch tests and the geostatistical analysis (Part A) and the progress of the model formulation for transport of radionuclides (Part B). Geostatistics of the main parameters was experimentally determined for two rock types, Äspö diorite, and Småland granite. Drill cores were collected at the Äspö Hard Rock Laboratory and sawn into a large number of slabs. The porosity, the effective diffusivity and the adsorption characteristics were determined using various experimental methods on the individual pieces. Semi-variograms show that both porosity and effective diffusivity are correlated over a separation distance of 30 to 40 cm. The coefficients of variation of the porosity of rock samples with a size of 20x20 mm and varying thickness in the range 6 - 15 mm are ~10 % for both Äspö diorite and Smålands granite. The corresponding variation in effective diffusivity is ~100%.
In order to be able to differentiate the effects of adsorption kinetics on the migration of radionuclides from the effects of other mechanisms (e.g. effect of heterogeneity), efforts have been made to improve the understanding of adsorption processes in rock. Two approaches were applied to estimate the adsorption rate of Cs on
crystalline rock, one being focused on adsorption on mineral surfaces and the other on adsorption occurring in the pore system of intact rock. In order to provide an acceptable explanation of the experimental data from in-diffusion tests with intact rock slabs the model framework had to include the effects of both surface diffusion (diffusion in a weakly sorbed state) and adsorption kinetics. A traditional way to
because the kinetics of adsorption on intact rock is dominated by the diffusion into dead-end pores. Independent investigations reported in the literature indicate that about 40% of the pore volume in crystalline rock is not active in matrix diffusion. The degree of importance of adsorption kinetics for radionuclide migration in fractured rock was quantified by deriving analytical expressions for the residence time of the nuclides in the fracture. Interpretations of these expressions and results from a numerical study indicate that adsorption kinetics has negligible effect on the
transport of radionuclides in fractured rock for sufficiently weakly adsorbing (ρ/ε KD
< ~2.5 103 m3/kg) and strongly adsorbing (ρ/ε KD > ~2.5 106 m3/kg) nuclides. In the
intermediate cases, sorption kinetics might be important depending on the combination of other parameters.
Sammanfattning
Föreliggande rapport behandlar ett forskningsprojekt kring radionukliders migration i sprickigt berg. Projektets övergripande målsättning är att förbättra kunskapen om hur den rumsliga variabiliteten i bergets geokemiska och fysikaliska egenskaper påverkar migrationen av radionuklider i enskilda sprickor. Strategin är att ta fram geostatistik för de viktigaste fysiska och geokemiska parametrarna i kristallint berg i Sverige och att använda denna information i stokastiska tolkningar av ett flertal migrationsförsök som kommer att genomförs med klyvna borrkärnor. Heterogeneiteten i borrkärnornas mineralogi och porositet kommer att ha en viss betydelse för transporten av radionuklider (caesium och jodid kommer att
användas) och denna betydelse skall kvantifieras. Den föreslagna tolkningsmetoden innebär en deterministisk processbeskrivning och en stokastisk representation av olika parametrar som porositet, diffusivitet och sorption.
Under ett tidigare skede av projektet har en matematisk modell utvecklats som underlag för utvärdering av planerade migrationsförsök. Ett datorabaserat
beräkningspaket har utarbetats i en blandad programmeringsmiljö, FORTRAN och MATLAB (Wörman and Xu, 1996). Modellen beskriver migration av radionuklider i ett tvådimensionellt sprickplan med rumsligt varierande geokemiska och fysikaliska transportegenskaper samt tar hänsyn till diffusion in i bergmatrisen och första
ordningens sorptionskinetik. Modellparametrarna kan ansättas som rumsligt stokastiska fält för att representera heterogenitet i geokemi. För att kunna särskilja effekten av parameterheterogeneitet från andra effekter på transporten av
radionuklider i sprickor, har tolkningsmodellen utvecklats med avseende på vissa effekter av sorptionskinetik.
Denna rapporten innehåller resultat från geostatistiska undersökningar av kristallint berg i Sverige (Part A) samt utveckling av modellbeskrivningen (Part B).
Ett stort antal experiment har genomförts för att bestämma geostatistiken för modellens parameterar och sorptionskinetiken för Cs i kristallint berg. Två borrkärnor med olika bergarter hämtades från Äspö berglaboratorium, en
Smålandsgranit och en Äspödiorit. Borrkärnorna sågades i ett stort antal provbitar med ett tvärsnitt av 20x20 mm och en tjocklek som varierade mellan 6 - 15 mm. Olika experimentella metoder användes för att bestämma porositet, effektiv diffusivitet och sorptionsegenskaper för de individuella bitarna.
Resultaten visar att samtliga undersökta egenskaper i Äspödiorit uppvisar en kovarians upp till ett separationsavstånd av omkring 40 cm. I Småland granit är kovariansen periodisk med ett intervall av omkring 34 cm. För båda bergarterna är variationskoefficienten 10 % för porositet och 100% för effektiv diffusivitet (med den valda storleken av provbitarna).
genom sk indiffusionsförsök. En teori för sorptionskinetiken på mineralytor har utvecklats på en form som är konsistent med en Langmuir adsorptionsisoterm. Obekanta koefficienter i modellen bestämdes med experimentella resultat från
batchtester med krossat berg. Cesium-137 (137Cs) användes som spårämne.
Ytkinetiken utvärderades för korn som är tillräckligt små för att den yta som är tillgänglig för sorption skall domineras av kornets yttre, veckade yta.
För att erhålla en acceptabel anpassning av modell och resultat från
indiffusionsförsöken var det nödvändigt att inkludera både sorptionskinetik och ytdiffusion (diffusion i ett svagt adsorberat tillstånd). En traditionell utvärdering baserad på antagandet om jämviktssorption ger markanta avvikelser mellan teori och data. Resultaten med Cs visar att sorptionsintensiteten (kinetiken) i intakt berg är två eller tre storleksordningar lägre än för krossat berg. Detta beror på att
kinetiken i intakt berg i hög grad styrs av diffusion i icke-ledande mikrosprickor (”dead-end-pores"). Oberoende undersökningar har visat att ungefär 40% av porvolymen i kristallint berg inte deltar aktivt i matrisdiffusionen.
Effekten av sorptionskinetik på migrationen av Cs i ett enskilt sprickplan har analyserats dels genom numeriska experiment och dels genom att härleda ett teoretiskt samband för uppehållstiden av Cs i sprickan. Sambanden kan användas för att bestämma det relativa felet som uppkommer genom att anta jämviktssorption istället för en kinetisk beskrivning av sorptionen. Dessa samband och numeriska
analysresultat visar att adsorptionskinetiken kan försummas för svagt (ρ/ε KD < ~2.5
103 m3/kg) adsorberande nuklider och för kraftigt adsorberande (ρ/ε KD > ~2.5 106
m3/kg) nuklider. I mellanliggande fall kan kinetiken ha betydelse beroende på
1. General Introduction
The preferred method disposal of spent nuclear fuel in Sweden is based on isolation in a deep bedrock repository. As part of its research programme for the safety of the final disposal, the Swedish Nuclear Power Inspectorate (SKI) initiated a project to examine how spatial variability in geochemistry and physical parameters of the rock in combination with spatial variability in matrix diffusion affects the radionuclide migration along single fractures in crystalline rock. The project has been proceeding for three years and will continue for another two years.
The overall purpose of the project is to deduce basic geostatistics of physical and chemical parameters in crystalline rock in Sweden and to use this information in the interpretation of a series of laboratory migration experiments with nuclides
migrating in fractured drill cores. The heterogeneity in the properties of the rock, such as porosity, diffusivity and sorption characteristics, will have a certain impact on the migration. The combination of a deterministic description of processes and a stochastic representation of the model parameters should be used as a basis for interpretation of the experimental results. The purpose of the present study is to determine the geostatistical pattern of some of the most important geochemical parameters in crystalline rock in Sweden, such as adsorption characteristics, effective diffusivity and porosity. Further, the report includes a critically review the
concurrent methods used to describe the combination of matrix diffusion and
sorption phenomena in environmental science (in sediments and in rock). Based on a number of decisive experimental methods and theoretical developments,
formulations for migration of radionuclides in fractured rock will be proposed. In order to differentiate the effects of various mechanisms on the migration of radionuclides, one needs a thorough understanding of the parameter variability in rock, shear dispersion and adsorption kinetics. We have therefore included a study of the variation of the dispersion coefficient with the aspect ratio of a rectangular flow section (Wörman and Xu, 1998). Other critical issues are the statistical patterns of physical and geochemical properties in crystalline rock as well as the effect of adsorption kinetics on migration. The latter two issues are covered in part A (geostatistics of parameters) and part B (sorption kinetics).
The geochemical properties to be determined are adsorption characteristics, effective diffusivity and porosity. This is done on samples from a typical Swedish crystalline rock collected at the Äspö Hard Rock Laboratory. The spatial variability in
parameters is determined using a number of experimental methods and a large set of rock samples. Another purpose is to estimate the effect of sorption kinetics on the migration of radionuclide migration for the specific rock types found at Äspö. The
isotope specifically used in these investigations is 137Cs. An important issue is to
delimit cases for which sorption kinetics can be omitted. The mathematical description can then be based on equilibrium chemistry.
Part A:
2 Statistical Patterns of Geochemistry in Crystalline Rock 2.1 Introduction
As mentioned in the general introduction, the overall purpose of the project is to improve the understanding of the effect of heterogeneity in properties of crystalline rock on the migration of radionuclides. As a basis for analyses, a transport model describing the migration of radionuclides in fractured rock has been developed and implemented in a numerical simulation package (Wörman and Xu, 1996). The model formulation is two-dimensional along the fracture plane and the main model
parameters are conceived as spatially random. The purpose of Part A of this study is to deduce basic geostatistics of the main model parameters. This will be done by conducting a large number of batch tests with samples taken in two-dimensional patterns in a selected rocks. The parameters to be measured and analysed
statistically are porosity and effective diffusivity. Sorption characteristics are reported in part B but without a geostatistical analysis.
A specific objective was that the experimental material should be produced from drill cores collected from two rock types at the Äspö Hard Rock Laboratory located in south-eastern Sweden, Äspö-diorite (ÄD) and Småland granite (SG). The Äspö hard rock laboratory is placed in a typical Swedish crystalline bedrock and has been appointed as a suitable location for testing of the Swedish concept of final disposal of nuclear wastes. One of several drill cores from each rock type will be sawn into a large number of slabs in order to facilitate examination of the individual pieces and evaluation of adsorption characteristics, porosity and effective diffusivity. Despite the fact that the variance of the properties depends
Table 1 List of experiments included in the study
Experiments Äspö diorite
slab thickness
Småland granite slab thickness
Porosity
(leaching method, NaI) 4 mm, > 50 samples* 6 mm, > 50 samples*
6 mm, > 50 samples*
10 mm, > 50 samples* 10 mm, > 50 samples*
15 mm, 10 samples*
De, effective diffusivity
(through-diffusion, NaI) 4 mm, > 50 samples* 4 or 6 mm, > 50 samples
(through-diffusion, NaI) 6 mm, > 50 samples*
kd, partition coefficient
(in-diffusion method) 10 mm, > 50 samples** 10 mm, > 50 samples**
(crushed particles) particle size: 0.0065, 0.011,
0.0154, 0.0227, 0.104, 0.65, 1.198 and 2.397 mm*
Migration experiment 3 sets 3 sets
Table 2 Composition of minerals in Äspö diorite and Småland granite Minerals Äspö diorite (%) Småland granite (%) Quartz 20.73 40.99 Potassium feldspar 16.34 22.96 Plagioclase 21.71 17.04 Muscovite 0.24 0.25 Biotite 13.17 2.72 Hornblende 6.34 -Fe-Ti oxides 0.98 0.25 Titanite 1.95 1.48 Saussuritized feldspar 15.85 12.84 Others* 2.68 1.48
Total number of grains counted
411 406
*Others include zircon, calcite, epidote and chlorite.
on the size of the slabs, the correlation length can be determined based on the arbitrary slab size used in this study. Remaining cores should be stored for future laboratory migration experiments. The experimental methods to be used in the study are in- and through-diffusion experiments and leaching experiments. Table 1
summarises the experiments included in the project.
2.2 Materials and Experimental Methods 2.2.1 Materials
Two drill cores with a diameter of 20 cm and a length of 50 to 60 cm were taken from the Äspö hard rock laboratory, Kalmar County in Sweden, and used to investigate parameter variabilities. One drill core was Äspö diorite and the other one was Småland granite. Two thin sections from each of the drill cores were prepared and studied in transmissive light. The average mineral compositions were determined by point counting on the thin sections (Table 2). The dominating minerals of Äspö diorite are plagioclase, potassium feldspar, quartz and biotite. The main minerals of Småland granite are quartz, potassium feldspar, muscovite and saussuritized
feldspar. There are a few scattered macropores that presumably have resulted from the dissolution of Fe-Ti oxides.
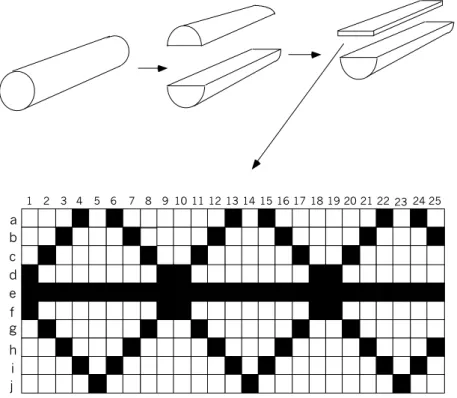
1 2 3 4 5 6 7 8 9 10 11 1213 14 15 16 17 18 19 202122 23 24 25 a b c d e f g h i j
Fig. 1 Schematic of disintegration of drill core and pattern of rock slab sampling. Black squares represent slabs to be investigated with regard to a specific parameter.
geostatistical analysis of the data in two dimensions. The size of each slab face was 20x20 mm and the thickness varied in the range 6 - 15 mm.
The spatial covariance of the data can be represented in terms of the semi-variogram. If the mean is constant, the data pairs are grouped according to their
separation distances, lag distances and the semi-variogram r(w) is expressed as a function of the lag distance (Isaaks and Srivastava, 1989; ASCE, 1990)
r(w)= 1 2n(w)
∑
n(w) i=1 [b (xi+w)− b (xi)]2 (1)in which n is number of observation pairs, b(xi) is an arbitrary parameter value
(data) at point xi, b(xi + |w|) is the corresponding parameter value separated from
point xi by the space vector w, w is lag distance.
2.2.3 Method for porosity measurements
The porosity of the samples was measured by the leaching method (Skagius, 1986). The rock slabs were placed in a vacuum chamber to remove gas trapped in pores and then saturated with a solution of iodide with a concentration of 1.25 M for at least three weeks. The amount of iodide contained by each slab in the saturated condition was determined by placing the iodide-saturated sample in distilled water and measuring the leaching of iodide from the slabs. The leaching was performed
until the iodide concentration of each solution became practically constant with time. The experiments show that the equilibrium stage is reached after a period of at least three weeks. The pore volume and the porosity of the slab were then calculated by means of a formulation of the mass balance of iodide.
2.2.4 Method for effective diffusivity measurements
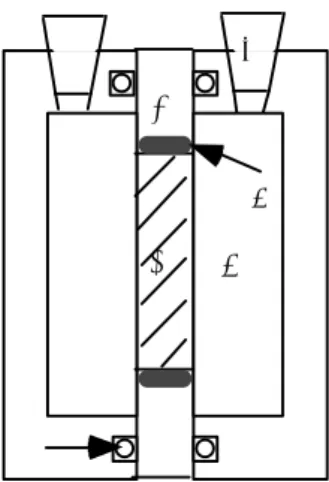
The effective diffusivity was determined with the through-diffusion technique described by e.g. Johansson et al. (1997). The apparatus for a through-diffusion experiment is shown schematically in Fig. 2. The rock slab was placed in a quadratic hole being fixed to a PVC plate with silicone rubber. The plate with the rock slab was then kept in a vacuum chamber for air removal and saturated with distilled water in the same way as in the porosity measurements. After saturation, the plate was mounted between two water containers and sealed with o-rings on both sides. The volume of the containers was 20 ml. One side of the diffusion cell was filled with 0.1 M sodium iodide solution as a tracer substance. The other cell was filled with 0.1 M sodium nitrate solution in order to avoid osmotic effects (Skagius, 1986). Samples (1 ml) were repeatedly taken from the cell with sodium nitrate. Each time a sample was withdrawn, 1 ml of sodium nitrate solution was added to the cell to maintain a constant liquid volume in the cell. The sodium iodide concentration in the samples was measured by an iodide selective electrode (AST Orion Model 9653).
A B C D E F G
Fig. 2 Schematic of the diffusion cell (design after Johansson et al. 1997). A tracer container. B o-ring, C rock sample, D PVC plate, E sampling hole and rubber plug, F measurement container, G silicone rubber.
The measured sodium iodide concentrations were evaluated by means of the diffusion theory described by Skagius and Neretnieks (1986). The total amount of diffusing substance, Q, passing through the slab during the time t can be obtained by solving the diffusion equation for the following boundary conditions: the
Q = C1De l t − C1κl 6 − 2κC1l π2
∑
∞ n=1 (−n)n n2 exp −Den 2π t l2κ (2)where κ is the adsorption capacity of the rock in the form of ε + KD ρ,ε is the porosity
of the rock, KD is the adsorption partition coefficient with the unit of [m3/kg],
effective diffusivity De = εtDp, ρ is the density of the rock and εt is the porosity
available to transport. As t tends to •, (2) takes the form of
Q = C1De l t −
C1κl
6 (3)
The assumptions underlying (3) are that De is constant, the concentration in the
injection cell C1 is constant with time, the concentration in the measuring cell C2 is
negligible compared to C1 for all times, and the slab is homogeneous in its thickness
and quasi-steady state is reached (time derivatives tend to zero as time tends to infinity). These assumptions should be reasonable for the through-diffusion
experiments. The effective diffusivity De will be obtained by fitting the measured
data to (3).
2.2.5 Method for surface adsorption selectivity analysis
Rock surface adsorption selectivity was analysed with an electron microprobe analysis technique as part of a MSc thesis (Hoffstedt, 1997). In the electron
microprobe analysis, electron bombardment generates the X-rays emitted from the sample surface. From the wavelength and intensity of lines in the X-ray spectrum emitted from the surface, the elements present on the bombarded surface can be identified and their concentrations estimated. An Äspö diorite slab (2 x 2 cm) was used in these experiments. The surface of the slab was first polished and then the slab was placed in 100 ml of the synthetic ground water with an initial Cs
concentration of 1000 ppm for 4 months. A surface area of 1 mm2 was analysed with
an electron microprobe analysis technique, using the instrument CAMECA SX50. The three elements caesium, sodium and iron were analysed. Minerals were
determined based on the assumptions that all the Na is hosted in the plagioclase and all the Fe is hosted in the biotite. A blank test was performed with a slab placed in the synthetic ground water without Cs.
2.3 Results and Discussion
2.3.1 Results from porosity measurements
As mentioned, ÄD slabs of several thicknesses were used to determine the
porosities, namely 4 mm, 6 mm, 10 mm and 15 mm. The SG slabs was prepared with thicknesses 6 and 10 mm. The fact that porosity decreases with increasing
Table 3 Summary of porosity values from different experiments
Samples Mean value
% Median value % Variance Coefficient of skewness 4 mm ÄD 0.84 0.83 0.01 +0.54 6 mm ÄD 0.70 0.70 0.005 +0.51 10 mm ÄD 0.55 0.55 0.003 +0.24 15 mm ÄD 0.40 0.39 0.003 +0.48 6 mm SG 0.39 0.38 0.0025 +0.82 10 mm SG 0.36 0.35 0.001 +1.03 0.0 0.61 1.4 0.71 2.8 0.81 4.2 0.91 5.6 1.01 7.0 1.12 8.4 1.22 Porosity (%) Class frequency
Fig. 3 Histogram of porosity for 4 mm ÄD slabs. 0.0 0.55 1.7 0.61 3.4 0.68 5.1 0.74 6.8 0.81 8.5 0.87 10.2 0.94 Porosity (%) Class frequency
Fig. 4 Histogram of porosity for 6 mm ÄD slabs. 0.0 0.43 1.2 0.47 2.4 0.52 3.6 0.57 4.8 0.61 6.0 0.66 7.2 0.70 Porosity (%) Class frequency
Fig. 5 Histogram of porosity for 10 mm ÄD slabs. 0.0 0.30 1.8 0.33 3.5 0.36 5.2 0.39 7.0 0.42 8.8 0.45 10.5 0.48 Porosity (%) Class frequency
Fig. 6 Histogram of porosity for 10 mm SG slabs.
skewed. Mean porosity for the 15 mm slab of ÄD is 0.40% and for the 10 mm slabs of SG is 0.36%. The measured porosity data are summarised in Table 3.
One rock core of each of ÄD and SG having a diameter of 24 mm and a length of 40 mm was sent to the Laboratory of Radiochemistry at the University of Helsinki for complementary porosity measurements. These complementary porosity
measurements employed impregnation of rocks by 14C labelled
polymethylmethacrylate (14C-PMMA), autoradiography and optical densitometry
applying digital image processing (Siitari-Kauppi, 1997). The porosity values
obtained in this way were 0.33 ± 0.05 % and 0.22 ± 0.03 % in ÄD and SG,
respectively. The median porosity value measured on 15 mm ÄD slabs by the
leaching method is close to that measured by the 14C-PMMA method.
From the semi-variogram shown in Fig. 7, the semi-variance for the porosity of ÄD approaches the sill (variance for completely uncorrelated pairs) at a lag distance of about 30 cm, the correlation length is ~30 cm. The directional variograms with different angles (not included in the report) indicate that the degree of anisotropy is insignificant. Fig. 8 shows that the variogram of measured porosity data for Småland granite has a clear cyclical form. This cyclic characteristic, often referred to as a hole effect, suggests that the porosities of the samples separated by 17 cm is generally most dissimilar and results from samples separated by 34 cm have the highest covariance. In spite of the sawing effect, the variograms of the porosity for different slab thicknesses can be represented by similar correlation lengths.
V a r i o g r a m 0 70 140 210 280 350 420 0.000 0.003 0.006 0.009 0.012 0.015 0.018 Distance (mm)
V a r i o g r a m 0 80 160 240 320 400 480 0.0030 0.0025 0.0020 0.0015 0.0010 0.0005 0.0000 Distance (mm)
Fig. 8 Semi-variogram of porosity for 10 mm SG slabs.
2.3.2 Results from effective diffusivity measurements
About 100 slabs in total were used to determine the effective diffusivity (Fig. 9). The figures in Appendices II and III show, for all experiments, the concentration of iodide that passed through the slab as a function of time. The effective diffusivity,
De, was determined using a least square regression technique to fit (3) to the
measured data. A blank test was done by placing a PVC slab with silicone rubber on the PVC plate. The result shows that the diffusion through the silicone rubber could be disregarded.
A change in the slope of the concentration versus time was observed in some plots (samples D1 and F7 in Appendix II, and samples D2, D3, F3 and F4 in Appendix III, respectively), although the experimental conditions were unchanged. Similar
observations were reported by Skagius (1986), who suggested that an increasing diffusivity might be due to fissure coating material in the slabs. This could not explain, however, a decreasing diffusivity.
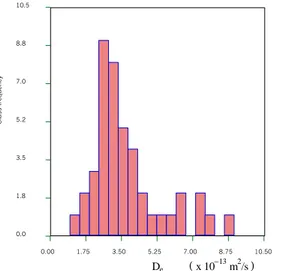
Figs. 11 and 12 show the histograms of De for 4 mm and 6 mm ÄD slabs. The
purpose to measure De values for the two groups is to investigate the effect of
sawing on De. The sawing effect on the effective diffusivity is also indicated by a
decreasing mean diffusivity with increasing slab thickness.
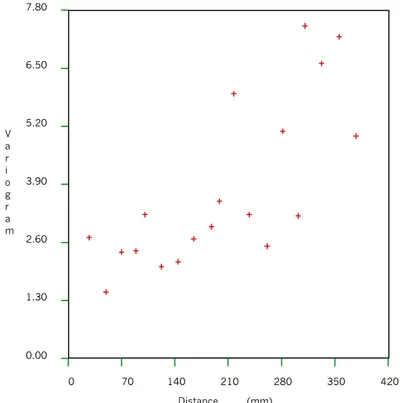
The measured effective diffusivity data are summarised in Table 4. The semi-variance of the effective diffusivity represented in Fig. 12 are characterised by a similar correlation length as found for porosity, about 30 cm.
0.0 0.00 1.8 1.75 3.5 3.50 5.2 5.25 7.0 7.00 8.8 8.75 10.5 10.50 De ( x 10 −13 m2/s ) Class frequency
Fig. 10 Histogram of effective diffusivity for 4 mm ÄD slabs. 0 0.00 4 10.00 8 20.00 12 30.00 16 40.00 20 50.00 24 60.00 De ( x 10 −13 m2/s ) Class frequency
Fig. 11 Histogram of effective diffusivity for 6 mm ÄD slabs.
Table 4 Effective diffusivity from through-diffusion experiments
Samples Mean value
x10-13 m2/s Median value x10-13 m2/s Variance x10-26 Coefficient of skewness 4 mm ÄD 4.45 3.64 5.32 +1.77 6 mm ÄD 12.75 2.77 269.47 +1.42
V a r i o g r a m 0.00 0 1.30 70 2.60 140 3.90 210 5.20 280 6.50 350 7.80 420 Distance (mm)
Fig. 12 Semi-variogram of effective diffusivity for 4 mm ÄD slabs.
2.3.3. Results from a surface adsorption selectivity experiment
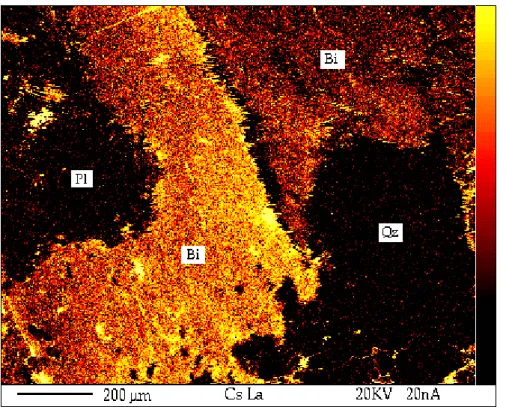
Fig. 13 shows an X-ray mapping of the adsorption of Cs on an ÄD sample surface. Three mineral grains are identified using scanning analyses based on the sodium and iron elements. They are biotite (Bi), plagioclases (Pl) and quartz (Qz). The concentration of Cs is indicated by varying degree of yellow and red. Increasing degree of yellow indicates increasing concentration of Cs. As can be seen, Cs adsorption on the rock surface is strongly selective, with all the adsorption taking place on biotite grains, whereas practically no adsorption was detectable on plagioclases and quartz. The adsorption selectivity is limited not only to specific minerals, but also to different orientations of mineral grains (Hoffstedt, 1997). This fact is reflected by the varying degree of yellow that characterises the two biotite fields in Fig. 13. An important conclusion from these findings is that the variability of the mineral composition and their orientation governs the variability of
adsorption.
The exact concentration of Cs could not be determined in X-ray samples due to the lack of standard reference of Cs. If the concentration of each pixel is determined, a statistical structure analysis could be performed and the variability of adsorption on a grain size scale could be evaluated. However, such an approach needs further investigations using digital image analysis of X-ray mapping of Cs adsorption.
Fig. 13 X-ray mapping of a rock sample surface of ÄD that has been exposed to Cs.
2.4 Conclusions
The coefficient of variation of rock porosity, CV[ε], depends on the sample volume.
Results from a large number of batch tests, using arbitrary sample sizes of 20x20 mm
and varying thickness in the range 6 - 15 mm, gave CV[ε] • 10 % for both Äspö
diorite (ÄD) and Småland granite (SG). Mean porosity is 0.40% for the 15 mm slabs of ÄD (maximal investigated thickness) and 0.36% for the 10 mm slabs of SG
(maximal investigated thickness). The porosity decreases slightly with slab thickness, which indicates that there is a small effect of sawing on the porosity. The distance over which a certain random property exhibits a covariance (the correlation length) does not depend on the sample volume if the property is
continuous and stationary for the volume. The semi-variance of the porosity is, for both rock types, characterised by a correlation length of about 30 to 40 cm. The semi-variance for SG is cyclic with the period 34 cm which reflects the spotted nature of the mineral distribution. The cyclic characteristic implies that porosities of the samples separated by 17 cm are generally most dissimilar. Results from samples separated by 34 cm have the highest covariance.
Micro probe analyses indicate that the variability of the mineral composition and their orientation govern the variability of adsorption. Caesium adsorbs
predominantly on biotite whereas practically no Cs is adsorbed to plagioclases and quartz.
Results from through-diffusion tests show that the coefficient of variation of the effective diffusivity is about 100% for both rock types and the sampling sizes used in
the study. The correlation length for effective diffusivity is similar to that found for porosity, i.e. about 30 cm. The frequency functions for both porosity and diffusivities are markedly positively skewed, which suggests that log-normal distributions apply as approximations.
Part B:
3 Effect of Sorption Kinetics on Radionuclide Migration 3.1 Introduction
The overall objective of this project is to determine the effect of heterogeneity of geochemical and physical parameters on the migration of radionuclides in fractured rock. As a basis for an adequate interpretation of heterogeneous transport, efforts have been made to improve the process description also for homogeneous cases. A mathematical model describing the migration of radionuclides along single fractures should include the transversal diffusion into the rock matrix as well as sorption processes. Hence, the specific purpose in focus of part B of the current report is to evaluate the relevance of including sorption kinetics (as distinct from equilibrium sorption) and surface diffusion. A particularly important objective is to determine under what conditions the approximation of equilibrium sorption is acceptable. Several investigations of Cs adsorption on minerals indicate that the equilibration time varies from weeks in laboratory tests with particulate forms of illite and montmorillonite (Comans and Hockley, 1992) up to several years or decades under special conditions for Chernobyl Cs in lake sediments (Meili and Wörman, 1996). Comans et al. (1991), Nyffeler et al. (1986) and Smith and Comans (1996) discussed the different equilibrium times associated with the readily available binding sites on grain surfaces and less available sites such as frayed edges or in the grain interior (micro fissures of the grain). Skagius (1986) conducted experiments with adsorption and desorption of Cs on crushed granite in different size fractions, the major
constituents of which were quartz, feldspar and microcline. In some experiments, the ratio between dissolved and particulate phases of Cs was still changing even after more than one year.
In order to quantify the kinetics of Cs adsorption on granite and to estimate its relevance to radionuclide migration in fractured rock, two experimental approaches are utilized in this study. One approach is to determine the surface adsorption rate by performing batch tests with rock crushed into sufficiently small particles. In this context, sufficiently small particles are those for which the surface available to adsorption is dominated by the external mantle surface. Since there is a certain relationship between the adsorption isotherm (equilibrium state) and the mass transfer rate, a consistent theoretical foundation will be developed for interpretation of the results from these batch tests. In principle, the theory can be used also to generalise the results to intact rock even though such a procedure is not trivial. Adsorption in intact rock, in general, is influenced both by surface adsorption along the connected inter-granular boundaries and the combined effect of migration in internal micro-fissures of the grains (not inter-connected fissures) and sorption onto solid surfaces. In addition, surface diffusion is another phenomenon affecting the ion mobility in the adsorbed state that can be of significance (Skagius, 1986; Eriksen and Jansson, 1996). Due to these complications the study will also include adsorption experiments with intact rock. The approach is then to evaluate the in-diffusion tests
with intact rock pieces using a model formulation that takes into account both rate limited mass transfer in the rock matrix and surface diffusion. The two approaches
are used to determine the limits for adsorption rate for 137Cs in crystalline rock.
Analytical expressions for the temporal moments of the solute residence time in fractured rock are definite measures of the overall transport process that can be used to understand the importance of adsorption kinetics to the transport. The temporal moments can readily be translated into statistical quantities such as mean and variance of the residence times. Hence, one of the objectives is to derive expressions for the relative error in the variances resulting from the assumption of equilibrium chemistry. As distinct from the variance, the criterion used to evaluate the degree of importance of adsorption kinetics can also be based on the peak concentration. This criterion will be deduced from interpretations of numerical experiments using the simulation package of Wörman and Xu (1996).
3.2 Models and Criteria of the Effect of Sorption Kinetics 3.2.1 Models of migration process
The solute transport in a single fracture is represented as a two-dimensional process on a rectangle with open up- and downstream boundaries according to Fig. 14. Radionuclides are allowed to diffuse into the pores of the rock matrix (inter-granular micro fissures) lateral to the main flow direction. The porous matrix extends for a certain distance at which no flux is permitted. The no-flux condition can be
motivated either as a symmetry condition with neighbouring fractures in which transport occurs simultaneously or simply by the fact the permeability is higher adjacent to the fracture than in the parent rock. Stress relaxation along a fracture
Matrix diffusion Dispersion Advection Sorption kinetics Mass phase in main fracture Dissolved mass phase in solid matrix Adsorbed mass phase in solid matrix
causes an opening of the inter-granular micro fissures. Advection in the longitudinal direction does not occur in the rock.
The above aspects of the transport lead to a model concept similar to that of Kunstman et al. (1997). However, the current transport formulation incorporates variability in aperture and physical-chemical parameters. The model also includes surface diffusion and non-equilibrium sorption. For incompressible fluids, we may write the depth-averaged form of the A/D equation for the fracture planes as (Wörman and Xu, 1996)
∂c ∂t +uk ∂c ∂xk − 1 h ∂h ∂xk( Ekj+Dkj) ∂∂c xj − ∂∂xk( Ekj+Dkj) ∂∂c xj + γc− 2 h D ' e ∂cm ∂z z=0=0 (4)
in which c is concentration of solute per unit volume of water [kg/m3], cm is
dissolved mass per unit volume of water [kg/m3], Dkj is molecular (ionic) diffusivity
tensor [m2/s] in which indices k = j = 1,2, u is advective velocity [m/s], γ is rate of
radioactive decay [1/s], t is time [s], xk is Cartesian co-ordinate vector, h is fracture
aperture, E is dispersion coefficient [m2/s], D’e is effective diffusivity which is
expressed by D’e = εt Dp + kd1 ρ Ds in which pore diffusivity Dp = DδD/τ2 [m2/s], D is
molecular diffusivity [m2/s], εt is porosity of rock matrix available to matrix
diffusion, δD is constrictivity, τ is tortuosity, Ds is surface diffusivity [m2/s], ρ is
density of the rock [kg/m3] and kd1 is partitioning coefficient which is defined in (5).
The variables c , u, E and D in the equation are depth-averaged. An explanation of the diffusivity and adsorption model is provided below.
Aqueous phase cm Sorbed mobile phase Sorbed fixed phase c cs w e r e c k k
Fig. 15 Schematic representation of the kinetic sorption and surface diffusion model. As cations, like Cs, are adsorbed to mineral surfaces one fraction of the ions takes specific sites on the surface due to complexation or ion exchange and the other fraction is more weakly attracted to the surface by electrostatic interaction. The mobility of the weakly attracted ions is altered compared with the mobility of the free phase in the aqueous solution. The mobility of the ions in this weakly sorbed phase is known as surface diffusion (Skagius, 1986; Eriksen and Jansson, 1996; Ohlsson and Neretnieks, 1997). In addition to the alteration of mobility, the distinction between the aqueous and weakly sorbed (mobile) phases is motivated
also because the determination of the partitioning coefficient for particulate rock generally represents the weakly sorbed phase as being completely sorbed. Experiments with particulate rock are an important method to determine the partition coefficient since equilibrium condition can be achieved also for highly sorbing nuclides.
Diffusion of solutes in the rock matrix is thus dependent on molecular diffusion in pore water and in a weakly sorbed phase. The model adopted in this study is similar to that used for Cs in aquatic sediments by, e. g. Smith and Comans (1996). A
distinction is made between the dissolved solute mass per unit volume of water, cm
[kg/m3], the sorbed mobile (aqueous) solute mass per unit solid mass, cs [kg/kg],
and the solute mass which is “fixed” on solids per unit solid mass, cw [kg/kg], (Fig.
15). An instantaneous equilibration between the aqueous and sorbed mobile phase prevails and is defined by the partitioning coefficient
kd1 = cs /cm (5)
which has the units [m3/ kg]. The diffusive flux of solute in water phase per unit
area of the rock medium in units [kg/m2 s] is given by
Fw=εt Dp
∂cm
∂z (6)
For solid phase, the flux of solute per unit area due to surface diffusion in units
[kg/m2 s] is given by
Fs=Ds ∂(c∂s ρ)
z (7)
The mass conservation can thus be formulated in terms of the concentration of
mobile phase, ce [kg/m3], i.e. the combined aqueous/exchangeable phase
ce = ε cm + ρ cs (8)
For a constant porosity, diffusivity and adsorption in the rock matrix, the mass conservation equations for the mobile and fixed phases can be written
∂ce ∂t − ∂z∂ εtDp ∂cm ∂z +Ds ∂(csρ) ∂z + γce+kece−krcwρ =0 (9) ∂(cwρ) ∂ + γc ρ +k c ρ −k c =0
∂cm ∂t − Ω εt ε Dp ∂2 cm ∂z2 + γ cm + kr Ψ ρ ε (KD cm − cw) = 0 (11) ∂cw ∂t + γcw− kr(KDcm− cw) =0 (12) in which Ω= 1 + Ds Dp ρ εt kd1 1 + ρε kd1 (12a) Ψ = 1 1 + ρε kd1 (12b)
and the partitioning coefficient, KD [m3/kg], is defined as
KD= ccw m e = ρΨε ke kr (13) For the special case that the weakly sorbed phase is omitted in the model frame
work, kd1 = 0 which gives Ψ = Ω = 1. The definition of KD according to (13) still
applies.
3.2.2 Semi-empirical equation for adsorption kinetics
The equilibration time for the diffusion of Cs (in water) into a cubic piece of rock with a side length of 1 cm is several years. The long equilibration times prohibits reliable estimates of the sorption partition coefficients without careful evaluations also of the time rate of change of the concentration ratio between dissolved and sorbed mass phases. Independent measurement of the partition coefficient for strongly sorbing nuclides is therefore often done on crushed material. Particularly the adsorption isotherm can be determined using crushed rock. A requirement is that the rock particles are small enough for the diffusion into the grains to be negligible. As the particles become larger the inner surface available to sorption through diffusion in micro fissures in the grains will constitute an increasing part of the total adsorbent surface area. Sorption kinetics is then dominated by diffusion related processes in the grains. Section 3.4.1 contains a description of the method used to select the sufficiently small grains that are dominated by their external (mantle) surface area. This selection procedure facilitates a study of surface sorption kinetics that will be used as a reference for the sorption kinetics study with intact rock described in sections 3.3.3 and 3.4.2.
The evaluation of the experiments requires a theoretical basis that combines the kinetic description with an applicable adsorption isotherm. Hence, both the
equilibrium state and the mass transfer rate will be related to the ratio between dissolved phase concentration and the adsorbent surface area. In this purpose, consider a suspension of particulate granite in a solution of a certain adsorbate substance. The concentration ratio of the adsorbed to dissolved solute mass at equilibrium defines the partition coefficient
kd= cca d e (14)
in which ca is bulk concentration for adsorbed phase of solute [kg/m3], cd is bulk
concentration for dissolved phase of solute [kg/m3], the subscript e denotes chemical
equilibrium. The partition coefficient kd and the partition coefficient KD, defined
previously in (13), are related according to
KD= ρε kd
(15) The rate of adsorption of the solute on the particles can be expressed in terms of entities from surface chemistry as (Attkins, 1983). The net adsorption rate is expressed as
G ≡ dca
dt = Gad− Gdes (16)
in which Gad is mass rate of adsorption and Gdes is mass rate of desorption. Further,
one may write
Gad= U
√3 2 s Φ cd (17)
Gdes= a ca (18)
in which U is squared mean speed of molecules [m2/s], s is sticking probability, a is
rate of departure [s-1] and Φ is specific surface area [m2/m3] (solid surface area per
unit bulk volume of rock). Eq. (17) is based on the kinetic theory for molecules moving randomly, independently of each other (e.g. Attkins, 1983, pp 860-874, 1003-1030) and rapidly compared to the grains.
The continuing derivation is based on three additional assumptions, of which the
first is that the sticking probability s = s0 (1 - ca/cas), the second that the saturation
concentration cas = αΦ, and the third that the rate of departure a = βΦ, in which s0, α
kr= Φ(β+γ cd/(αΦ)) (20)
and the partition coefficient as
kd= 1
β/γ+ cd/(αΦ) (21)
and γ = [U/(2 √3 )] s0. The constants α,β and γ should be determined from
regression analysis with the experimental data.
If we assume that kr and the total concentration ctot = ca+cd are constant in a batch
test, the solution to (19) can be given as
ca= kdctot kd+ 1 − 1 kd+ 1e ln(kdctot)−krt(kd+1) (22)
The kr value can be determined by fitting the analytical solution to the observed data
from each individual batch test. To determine the constants in (20) and (21), the linearised forms kr Φ =β+ αγ cd Φ (23) 1 kd = β γ + 1 α cd Φ (24)
is used in a regression analysis (linear in β, γ/α,β/γ and 1/α). From several batch
tests, the constants in (23) and (24) can be estimated by means of linear regression.
3.2.3 Analytical solution to the temporal moments of the breakthrough curves
A usual methodology for deriving analytical solutions to solute transport processes involves Laplace transforms. Even if analytical solution can not be found in closed form, the temporal moments of the solute concentration curve (the breakthrough curve) often can. The temporal moments can, further, be transformed into statistical properties (central moments) like mean residence time, variance and skewness. Even a relatively small number of moments captures the most important characteristics of the solution and a general understanding of the processes. An infinite number of the temporal moments defines the solution exactly. The Laplace transform of a function u is expressed in the form
L[u]= u−=
∫
∞
0
u e−pt dt
(25) in which p is an arbitrary real number. Setting p = 0 in (25) yields the zeroth temporal moment of the function u as
m0= L[u]p=0=
∫
∞
0 udt
(26) If u is divided by the zeroth moment, the result is in the form of a probability density function, f, for the time. By repeated differentiation, one can readily show that the temporal moments of f can be given as
mj=
∫
∞ 0 tj fdt =(−1)j ∂ j L[f] ∂pj p=0 ; j=1,2,.... (27) If u is now taken as the concentration, c, f is the probability density function for residence times and (27) gives the temporal moments of the probability density function for the residence time.For a uniform fracture plane, constant dispersion and negligible radioactive decay, the transport equation for the main fracture can be written as
∂c ∂t +u ∂c ∂x −E ∂2 c ∂x2 − 2 D ' e h ∂cm ∂z z=0=0 (28)
Together with the equations for transport in the rock matrix (11) and (12), as well as the boundary and initial conditions, the solution in the form of L[c(x,t)] is obtained following a similar procedure as that proposed by Maloszewski and Zuber (1990), except for the boundary condition for the porous matrix, which is defined as no-flux (impervious surface) at a distance, L, from the main fracture plane instead of an infinite extent (Appendix I).
Basic relationships between the residence time E[t] and the variance σ2 of the
residence time distribution and the first two temporal moments can be given as
E[t]=µ= m1 (29)
σ2=
m2−µ2 (30)
After several operations, based on (11), (12), (27) and (28) which are accounted for in Appendix I, the residence time and the variance of the residence time associated with a Dirac pulse (cf. (A5) and (A9) in Appendix I for a definition of initial and boundary conditions) become
σ2= x u 2 1 + 2 D ' e L Ω εt ε Dp h 1 +Ψρ εKD 2 E u2 + + 4 3 1 +Ψρ εKD 2 D'e L Ω εt ε Dp h L2 Ω Dp + 4 ΨρεKD D ' e L Ω εt εDp h 1 kr (32) From (31) the one may conclude that the combined effect of matrix diffusion and sorption kinetics can be represented in terms of a retardation factor which is
conveniently defined as the second term on the right hand side of (31). As porosity
approaches zero (D´e approaches zero), the celerity of propagation of the solute
pulse approaches the advection velocity; i.e. x/E[t] = u. As the matrix diffusion approaches infinity the celerity of propagation approaches zero. Further, the
spreading of the solute pulse can be related to three terms on the right hand side of (32) which from left to right represent 1) the effect of dispersion in the main fracture, 2) the effect of matrix diffusion and equilibrium sorption and 3) the effect of sorption kinetics. Accordingly, the sorption kinetics does not affect the mean residence time but may have a significant impact on the spreading of the pulse.
3.2.4 Effect of adsorption kinetics, dispersion and matrix diffusion on solute migration
As stated, matrix diffusion and sorption onto the solid matrix retard the solute pulse travelling through a fracture in relation to the advection velocity in the fracture. Matrix diffusion and sorption also spread the pulse. Based on (32) the spreading can be quantified as a function of five dimensionless numbers:
ΠKD=Ψ ρ ε KD; ΠE= Ekr u2 ; Πkr= L 2 kr Ω εt ε Dp ; Πx= x kr u ; ΠL= D'e L Ω εt ε Dp h .
The numbers reflect, in falling order, the equilibrium state of adsorption, relative dispersion, relative reaction kinetics, relative transport distance and ratio of penetration length and fracture aperture. In case surface diffusion is not to be
considered, Ψ = Ω = 1 and ΠL= (ε L)/h. Hence, Eq. (32) is re-written as
k2rσ2=D+M+K=M1+ K M 1+ D MK M +1 (33a) in which D =Πx(2 (1 + 2 ΠL(1 +ΠKD))2ΠE (33b) M = 4 3 Πx(1 +ΠKD) 2 ΠLΠkr (33c)
K = 4 ΠxΠLΠKD (33d)
Dispersion is not a significant phenomenon if
D M K
M + 1
<< 1
(34) The effect of adsorption kinetics can be omitted if K/M << 1, i.e.
3 ΠKD
(1 +ΠKD)2Πkr
<< 1
(35) The relative error of the variances of the residence time distribution resulting from
the assumption of equilibrium chemistry (kr→∞) can be expressed as
εvar= σ 2 k−σ 2 E σ2 E = 4 ΠLΠKD 2(1 + 2 ΠL(1 +ΠKD))2 ΠE+ 4 3 (1 +ΠKD) 2 ΠLΠkr (36a) in which σ2k =( D + Μ + Κ)/k 2 r (36b) σ2Ε = (D + Μ)/k2r (36c)
Especially, if ΠE≈ 0, the relative error has the form of
εvar = 3 ΠKD
(1 + ΠKD)
2 Π
kr (37)
Because (35) and (37) are second order in ΠKD, there is a lower and an upper limit in
ΠKD below and above which sorption kinetics is not important to take into account.
In an intermediate range, sorption kinetics can be important.
3.2.5 Simulation of the effect of adsorption kinetics
the peak value of the solute pulse resulting from neglecting sorption kinetics. The
relative error in the peak value resulting if k → ∞ is defined as
εpeak=
Pk− PE
PE (38)
in which Pk is peak value of the concentration pulse with account taken to sorption
kinetics and PE is peak value of concentration pulse with account taken only to
equilibrium chemistry. The simulation results are evaluated on the basis of the five dimensionless numbers described in previous sections.
3.3 Materials and Experimental Methods 3.3.1 Materials
The adsorption experiments reported here are all conducted with Äspö diorite, both indiffusion experiments and experiments with crushed rock. The dominating
minerals are plagioclase, potassium feldspar, quartz and biotite. The average mineral compositions are given in Table 2 (see section 2.2.1).
3.3.2 Method for determining adsorption kinetics on crushed rock particles
Batch tests with crushed rock was partly included in the MSc thesis of Nyberg (1997). The current study include additional experiments as well as a new theoretical basis for the evaluation (section 3.2.2).
The rock was crushed and dry-sieved into three size fractions. Particles larger than
1.198 mm were washed several times with distilled water and dried at 80 °C for 24
hours. The size of the finest fraction was determined using a Galai CIS-1 instrument to be 0.0154 mm. The Galai instrument is based on registration of the interference caused by particles on a laser beam rapidly circulating in a particle suspension. For the other size fractions, the mean diameter was determined through sieving to be 1.198 and 2.397 mm.
A 200 ml batch solution was prepared by adding 137Cs in dissolved form into
synthetic ground water (Allard and Beall, 1979) and mixed with a suspension of crushed granite. Samples of about 1 ml were withdrawn repeatedly from the gently shaken batch solution and immediately separated (by centrifugation) into their dissolved and particulate components. The partition ratio between the particulate
and the dissolved phase, kd, was obtained by measuring the concentration decrease
of the clear water phase. The initial concentration of Cs was 1.3 10-5 M. The particle
concentration was 40 g/l, 60 g/l, 100g/l and 150 g/l for the particle size 0.0154 mm, and for the other two particle sizes the corresponding concentration was 40 g/l. The experiments were performed at room temperature and under oxic conditions
because the planned laboratory migration experiments will be performed under the same conditions.
3.3.3 Method for determining adsorption kinetics on intact rock
The estimation of adsorption kinetics for intact rock was based on the evaluation of experimental data from the in-diffusion tests using the model described in section 3.2.1. The in-diffusion technique described by Ittner et al. (1990) was employed herein. The rock slabs had a size of 2 x 2 x 1 cm and were coated with silicone rubber on all sides except one. The samples were kept in contact with synthetic ground water for about two months for pre-equilibration before they were submerged in the
synthetic ground water with 137Cs as a tracer element. Hence, the Cs ions start to
slowly diffuse into the only open side of the rock slab which gives rise to a concentration profile with depth in the rock.
After a contact time of more than 6 months, the slab was taken out from the solution and washed. 0.1 mm thick layers of the slab were successively removed using sand-paper. The trace element was analysed by measuring the radioactivity of the
removed material, including the sand-paper. The radioactivity was measured by
means of a γ-counter (CG-4000).
The rate of diffusion of 137Cs through the slab follows the same mathematical
framework as outlined in section 3.2.1, particularly (4), (11) and (12). The free water phase (corresponding to the main fracture) is homogenous in the indiffusion
experiments whereby the differential terms in space can be neglected in (4). Further,
(4) should be averaged over the cross section, A [m2], of the rock sample. Hence, for
negligible radioactive decay the system becomes
∀ ∂∂c t − A D ' e ∂cm ∂z z=0= 0 (39) ∂cm ∂t −Ω εt ε Dp ∂2 cm ∂z2 + krΨ ρε (KDcm− cw) = 0 (40) ∂cw ∂t − kr(KDcm−cw) =0 (41)
in which ∀ is volume of the solution in the free water phase [m3].
The boundary and initial conditions applicable to the experimental set-up can be defined as
c(x, t = 0) = c0 (42a)
•cm/•z|(z = L, t = ∞) = 0 (42b)
cm(z = 0, t • 0) = c (t) (42c)
since the downward boundary has negligible effect on the transport in the experiments. The system of equations is solved numerically by the central finite difference and the Crank-Nicolsons approximation for time. All the parameters in
the equation system are determined independently except for Ds, kr, KD and kd1,
which are estimated by fitting the solution of the equation system to the measured concentration profile (see section 3.4.2).
The parameter KD governs the total concentration in the rock close to the boundary
since chemical equilibration with the free water phase is nearly reached in this
region. Both the parameters kr and the product (kd1 Ds) have similar effect on the
shape of the concentration profile; decreasing kr or increasing (kd1 Ds) contribute to
effectively higher diffusion rates. Consequently, the three parameters have to some extent different influence on the transport process and this will facilitate evaluation
of the parameter values. The parameters kd1 and Ds can not be evaluated
independently of each other from the experiments conducted in this study.
3.4 Results and Discussions
3.4.1 Results from measurements of adsorption kinetics on crushed rock particles
An important part of the evaluation is to select those grain size fractions in which the surface area of the grains dominate the total area available to sorption. The particle
surface area can be defined as the 1) external geometric surface area, AE, including
surface roughness, 2) physical surface area, AT, including the internal surface area,
AIN, of (micro) pores and /or (micro) fissures and external geometric surface area
AE, and 3) geometric surface area of a sphere with the same diameter as that of the
mean particle (surface area of the equivalent sphere), AES. Fig. 16 schematically
represents the three surface concepts.
The ratio of the internal surface area, AIN, and the volume of the particles, V, can be
assumed to be constant for a specific type of rock material
AIN
V = constant = c1
(43) Eq. (43) states that the specific inner surface is independent of size. Further, the
1) 2) 3)
Fig. 16 Definition of particle surface: 1) external geometric surface area, 2) physical surface area, which includes the internal surfaces of (micro) pores and /or (micro) cracks, and 3) geometric surface area of a sphere with the same size as the mean particle.
Table 5 BET surface area data Mean particle size, dph mm BET-surface area m2/g Geometric surface area m2/g BET-surface /Geometric surface area, λg 0.0154 0.97 ± 0.03 0.1443 6.7 0.605 0.13 ± 0.01 0.0036 35.4 1.198 0.11 ± 0.01 0.0018 59.3
ratio of the external geometric surface area, AE, and the surface area of the equivalent
sphere, AES , is constant
AE
AES = constant = c2 (44)
This implies that the surface roughness factor is independent of size. According to (43) and (44) the total physical surface area can be written as
AT= AIN+ AE= c1V + c2AES (45)
A surface roughness factor, λg, is defined as the ratio between the physical surface area and the surface area of the equivalent sphere which means that (45) becomes
λg= AT AES = c1
V
AES + c2 (46)
in which V/AES∝ dph and dph is the harmonic mean by volume of the grain
λg= c3dph+ c2 (47)
The residual, c2, as the diameter approaches zero is the ratio between the external
geometric surface area and the surface area of the equivalent sphere. Consequently,
if one can find grains such that c2 >> c3 dph the surface of these grains will be
dominated by the external geometric surface.
The physical surface area of the particle was estimated by nitrogen gas BET
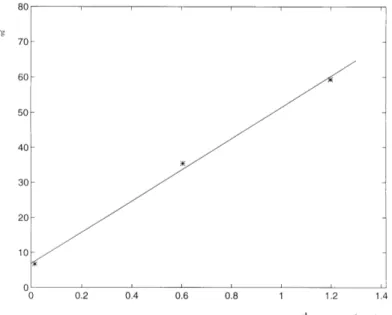
(Brunauer, Emmet, and Teller)-surface area using a Micromeritics Flow Sorb II 2300 analyser. Measured BET surface areas data are shown in Table 5. Fig. 17 shows a
plot of the particle fraction size versus λg. As can be seen, the λg value for the
smallest particle size 0.0154 mm is about the same as the intercept value c2 (the value
of c2 is about 7 and similar to those reported by Anbeek, 1992). In other words, the
measured surface area for 0.0154 mm particles is dominated by the external
geometric surface area. Consequently, only the particles with a size of 0.0154 mm are included in the interpretation of surface sorption kinetics and evaluation according
to (23) and (24). The rate coefficient kr was obtained by fitting the results from each
individual adsorption experiment according to (22) by means of a non-linear regression technique. Fig. 18 shows the concentration of the adsorbed phase, Cs, versus time according to data obtained from a batch test and fitted theory. As can be seen, there is a certain deviation between data and theory. The reason for the
deviation is probably that the surface adsorption kinetics follow slightly more complicated mechanisms than those proposed in section 3.2.2. The assumption of
constant kr applies only as an approximation.
Fig. 18 Concentration, ca, for adsorbed phase of Cs versus time from a batch test with
Fig. 19 kr/Φ vs. cd/Φ according to experimental results (*) and theory (solid line).
Results of kr from four batch tests are plotted using kr/Φand 1/kd versus cd/Φ (Figs.
19 and 20). The constants in (23) and (24) were then determined using an iterative least square regression technique. The non-linear adsorption isotherm, (24), and the associated dependence on the rate coefficient of partial pressure is verified with an acceptable degree of confidence. The non-linearity is, however, a minor problem in most practical cases of interest whereas the dependence of the rate coefficient on the specific inner surface of intact rock is generally a significant problem.
Various values of specific inner surface area for intact rock have been reported in the literature. A conservative estimation of the specific inner surface of the intact rock is
about 20 m2/kg (Hakanen and Hölttä, 1992). The specific inner surface of granite
coupons measured by Eriksen and Locklund (1989) based on N2-sorption was 200
m2/kg. As a qualitative estimate, the specific inner surface for intact rock is assumed
to be 100 m2/kg, i.e. 270 000 m2/m3 (taking the density as 2700 kg/m3). Hence, for
intact rock the cd/Φ ratio is practically zero and from Fig. 18, kr/Φ = 1.28 10-6 m/d.
Since Φ = 270 000 m2/m3, we have kr = 0.34 d-1 or 4 10-6 s-1. This value will be used as
a reference in the interpretation of the in-diffusion experiments.
3.4.2 Results from measurement of adsorption kinetics on intact rock
The purpose of the simulation procedures accounted for in this section is to verify
the model (39) - (41) and, particularly, to provide estimates of the rate coefficient kr.
Because of the complexity of the mathematical frame work and number of
parameters, one would expect a comparatively wide range of acceptable solutions.
The range of solutions is associated with a certain range of the plausible values of kr.
Even though a definite verification of the model is not possible, its degree of fit to experimental data is compared with the corresponding fit of two other, simpler, model approaches.
Equilibrium sorption with no surface diffusion
The results from the in-diffusion experiments were evaluated using three special cases of the same matrix transport model defined by (40) and (41) and schematically shown in Fig. 15. In a traditional equilibrium type model there is no surface
diffusion, kd1 = 0, and the partitioning (sorption) between the aqueous (dissolved)
and sorbed fixed phases are instantaneous, kr→∞. For simplicity, a constant
boundary concentration is also assumed for this equilibrium approach,
ε cm(z=0,t) + ρ cw(z=0,t) = κ C0, in which C0 is the constant concentration in the pore
water at the boundary and κ = ε + KD ρ is the sorption capacity factor. The solution to
(40) and (41) for a semi-infinite medium is obtained as (Crank, 1975)
ε cm+ρ cw κ C0 = erfc z 2 εt Dκ p t (48)
Fig. 21 Concentration profile of 137Cs in Äspö diorite (sample slab B6 in Fig. 1) as a function of the penetration depth. Diffusion time is 316 days.
in which ε cw + ρ cm is the total concentration in the rock. Several researchers have
used this type of model formulation and pointed out that it deviates significantly from results obtained from in-diffusion experiments (Ittner et al., 1990, Idemitsu et
al., 1992, Tsukamoto et al., 1993 and Johansson et al., 1998).
Surface diffusion model
In the second special case there is no exchange between the sorbed mobile phase and
the sorbed fixed phase, kr is taken as 0 in (39) - (40). Eq. (41) can be omitted. Hence,
the total concentration in the rock is the sum ε cm + ρ cs. Such a model was used by
Skagius (1986) and Eriksen and Jansson (1996). However, prior to evaluation of the experimental results a special problem of adsorption needs to be addressed. At the rock interface towards the aqueous solution, the surface available to sorption is larger than in the interior of the rock. One reason is that the sawing splits both grains and inter-granular connections and, thus, increases the open surface area. Another reason is that the sawing also tends to produce micro fissures between the grains even at a minor depth from the sawing face.
Fig. 21 shows the concentration of Cs as a function of the penetration depth after 316 days in one of the experiments. The concentration of Cs at the first few layers (tens of millimetres) is higher than expected from the data obtained deeper in the rock. The abrupt change in gradient cannot be explained using the model equations (40) and (41) with constant parameters. In the experiment represented in Fig. 21, more than 50% of the total Cs mass was accumulated in the first few layers in this
Fig. 22 Concentration profile of 137Cs in Äspö diorite (sample slab B6 in Fig. 1) and
the solution to the surface diffusion model. The ratio M2/M1 = 5.5. Diffusion time is
316 days.
parameters will be difficult and not so valuable. The alternative preferred in this study is to treat the surficial layer as a separate pool of accumulation. As an
approximation, the equilibration between the solute masses in the free water phase
and the surfacial layer is instantaneous, which means that the ratio between M1 and
M2, is constant. Hence, the initial concentration in the free water phase becomes
c(t=0)= M0/∀
1 + M2
M1 (49)
in which M0 is the total mass of the solute used in the in-diffusion test. Further, the
flux into the rock sample is assumed to be governed by the concentration gradient in the interior of the surficial layer independently of the high concentration at the surface. Hence, the conservation equation for solute mass in the free water phase becomes ∀ ∂∂c t − A D'e 1 + M2 M1 ∂cm ∂z z=0= 0 (50)
The M2/M1 ratio can be determined directly from measurements. The first three
data points shown in Fig. 21 are considered parts of the surficial layer which
resulted in M2/M1 = 5.5. However, a slightly lower ratio can also be motivated in
(50) due to the impact of the solute accumulation in the surficial layer on the flux.