Linköpings universitet | Institutionen för ekonomisk och industriell utveckling Masteruppsats, 30 hp | Civilingenjörsprogrammet inom Industriell Ekonomi -‐ Logistik Vårterminen 2016 | ISRN: LIU-‐IEI-‐TEK-‐A-‐-‐16/02555-‐-‐SE
Evaluating Distribution Structures for
Overseas Export of Frozen Food
Utvärdering av distributionsstrukturer för utomeuropeisk
export av frysta livsmedelsprodukter
Erik Ahlepil
Joel Björck
Handledare: Magnus Berglund Examinator: Erik Sandberg
Linköpings universitet SE-‐581 83 Linköping, Sverige 013-‐28 10 00, www.liu.se
This master thesis project was carried out within the area of logistics during the spring of 2016 on behalf of HKScan. The master thesis is the final part of the program Industrial Engineering and Management at Linköping University.
We want to thank all the concerned at HKScan who during the project contributed by answering questions and providing information. The project had not been completed without all your time and enthusiasm. A special thanks to the supervisors Tomas Stefenson and Johan Rosvall who have supported us and helped us during the whole project.
We would also like to thank our University supervisor Magnus Berglund as well as our opponents David Hedin and Oscar Hammarstedt who have come up with constructive criticism and other valid input that has moved the project and report forward.
Thank you! June 2016, Linköping _______________________ _______________________
Erik Ahlepil Joel Björck
The meat producers of the western world needs to develop their export organizations and streamline their physical distribution in order to take new market shares on the fast growing overseas markets. HKScan is one of those meat producing companies with businesses in Finland, Sweden, Denmark and the Baltic countries. A part of their sales goes on overseas export by container sea freight in frozen condition. Lately the logistics management of HKScan has been interested in investigating the effects of centralizing the physical distribution for the overseas export from Sweden and Denmark. This lead to the purpose of this study, which is:
“For HKScan, develop a model that evaluates distribution structures for overseas export of frozen food regarding total cost, delivery service, environmental impact and regulations.”
The case study included comparison between the current distribution structure for HKScan and three pre-‐determined scenarios. The current setup consisted of multiple warehouses in both countries. In the first scenario, the distribution structure was centralized to include one warehouse per country. In the second scenario, the total export flow of products from both Sweden and Denmark were redirected and centralized to one warehouse in Denmark. In the third scenario, the total export flow of products from both Sweden and Denmark were instead redirected and centralized to one warehouse in Sweden.
To evaluate and compare the different distribution structures a general model was first created by combining different theoretical models and adapting them to the context of overseas distribution of frozen food. The study then included three phases, which were; developing the model to fit the case company, applying the model on the case company and then finally evaluating the model.
The resulting model, which was the outcome of the development process, can be seen below. The figure illustrates the different included elements of the model.
By then applying the model onto the scenarios within HKScan, it was found that a centralization to a joint warehouse in Denmark would make total cost savings of seven percent. In addition, this scenario would increase the total service level but also increase the environmental impact due to long cross-‐border road transports and longer land and sea transports from the warehouse.
Regulatory vise it was not possible to fully investigate whether such a distribution would be possible. A centralization in each country however would have minor regulatory issues, it would lead to the
the total cost by one percent.
The evaluation of the model showed that it produces reasonable results with the regulatory elements being the hardest to evaluate for the different scenarios. Regarding the detail level, the veterinary element could be accounted for by the warehousing element to simplify the model and still not affect the results that much. On the other hand, the sea freight element could be split into transport from warehouse to domestic port and sea freight from domestic port to the destination port to increase the the understanding for costs in different scenarios. The box-‐model, containing twelve elements, can be seen as generalizable for evaluating distribution structures in similar contexts, meaning overseas export of frozen food. However, the calculations performed within the model do probably only apply to the specific scenarios of the study.
Köttproducenterna i västvärlden behöver utveckla deras exportorganisationer samt effektivisera den fysiska distributionen för att kunna ta nya marknadsdelar på de snabbväxande utomeuropeiska marknaderna. HKScan är en av dessa köttproducenter och koncernen har verksamhet i Finland, Sverige, Danmark och Baltikum. En del av deras försäljning utgörs av frysta produkter till utomeuropeiska marknader som fraktas via containerfartyg. Logistikorganisationen har haft som avsikt att se över denna distribution och utvärdera vad effekterna skulle bli vid en centralisering av det fysiska flödet för produkter från Sverige och Danmark. Syftet med denna studie är därför:
“Utveckla en modell för HKScans räkning som utvärderar distributionsstrukturer för utomeuropeisk export av fryst mat gällande totalkostnad, leveransservice, miljöpåverkan och regleringar.”
Fallstudien på HKScan innebar en jämförelse mellan den nuvarande strukturen och tre förbestämda scenarion. Den nuvarande strukturen inkluderar flera olika lagerpunkter i både Sverige och Danmark. Det första scenariot innebar att endast ett lager skulle användas per land. Det andra scenariot innebar att både de svenska och danska produkterna skulle lagras i ett lager i Danmark. Scenario tre hade ett liknande upplägg men istället skulle alla produkterna lagras i ett lager i Sverige.
För att utvärdera och jämföra de olika distributionsstrukturerna utvecklades en generell modell utifrån olika teoretiska modeller och anpassningar mot fryst mat som exporteras utanför Europa. Studien var sedan uppdelad i tre faser, vilka var; Utveckling av modellen för att passa HKScan, Applicering av modellen på HKScan och till sist Utvärdering av modellen.
Den resulterande modellen, som var utfallet från utvecklingsfasen, kan ses nedan. Figuren illustrerar de olika elementen som är inkluderade i modellen.
Genom att sedan applicera modellen på fallföretaget, HKScan, visade det sig att en centralisering till ett gemensamt lager i Danmark skulle ge kostnadsbesparingar på sju procent. Vidare gav detta scenario, scenario 2, högre servicenivåer. Dock ökade miljöpåverkan som en följd av långa
transporter över gränsen samt från lagren. Dessutom var det inte möjligt att helt klargöra om den distributionslösningen var möjlig ur ett regleringsperspektiv. Scenario ett, centralisering till ett lager per land, däremot skulle ha små regleringsproblem, ha den minsta miljöpåverkan, öka servicenivån en aning samt minska totalkostnaden med en procent.
regleringselementet var det svåraste att utvärdera. När det kommer till modellens detaljnivå kunde elementet gällande veterinärkostnader ha fått vara en del av lagerkostnadselementet för att förenkla modellen men ändå bibehålla en hög detaljnivå. Sjöfraktskostnadselementet däremot kunde ha delats upp i två, ett som gällde transporten från lagret till den inhemska hamnen och det andra som gällde transporten från den inhemska hamnen till destinationshamnen. Boxmodellen, som innehåller tolv element, kan antas vara tillräckligt generaliserbar för att utvärdera andra distributionsstrukturer i liknande sammanhang, vilket menas utomeuropeisk export av frusen mat. Vidare anses dock inte beräkningarna som genomfördes i modellen vara applicerbara utanför de
1
Introduction ... 1
1.1 Background ... 2
1.2 Purpose ... 2
1.3 Directives ... 3
1.4 Delimitations ... 3
1.5 Requirements of an academic study ... 3
2
Case Description ... 5
2.1 Company Description ... 6
HKScan Group ... 6
HKScan Sweden’s Organization and Setup ... 6
HKScan Denmark’s Organization and Setup ... 7
2.2 HKScan Export ... 8
The Overseas Export of Frozen Meat ... 8
The Export Organization ... 9
The Logistics Organization ... 9
The Physical Flow in Sweden and Denmark for the Overseas Export ... 9
The Customers ... 11
2.3 Understanding the Case Study ... 12
Scenarios to Investigate ... 13
2.4 Summary of the Case Description ... 15
3
Frame of Reference ... 16
3.1 Basic Theoretical Definitions ... 17
3.2 Distribution Structure ... 17
Definitions ... 17
Warehousing ... 18
Transports ... 20
Centralized Versus Decentralized Warehouse Structure ... 26
3.3 Developing a Model ... 27
Method for Developing a Model for Total Cost of Ownership ... 27
Method for Developing a Model for Total Cost Analysis ... 28
3.4 Costs ... 28
Total Cost Concept ... 28
Costs of Physical Distribution Systems ... 32
3.5 Delivery Service ... 33
3.6 Environmental Impact ... 34
Logistics Effect on the Environment ... 34
Calculation of Environmental Impact ... 35
3.7 Food Supply Chains Characteristics and Regulations ... 36
Trade within the European Union ... 37
Export to Countries outside the European Union ... 37
4.2 Working Process of the Study ... 41
Creating a Theoretical Model ... 43
Developing the Model ... 46
Applying the Model ... 47
Evaluating the Model ... 48
4.3 Summary of the Task Specification ... 48
5
Methodology ... 49
5.1 Project Situation ... 50
5.2 Approach Model of the Study ... 50
Initial Phase ... 52
Planning Phase ... 54
Execution Phase ... 58
Final Phase ... 63
5.3 Summarizing the Methodology ... 63
6
Developing the Model ... 64
6.1 Introduction ... 65
6.2 Empiricism ... 66
Understanding the Included Activities, Cost Drivers and Costs ... 66
Regulations ... 69
Service ... 70
Environmental Impact ... 71
6.3 Analysis ... 72
Model Analysis ... 72
Calculation Analysis ... 74
6.4 The Resulting Model ... 78
The Elements of the Model ... 78
Calculations, Processing and Presentation of the Model ... 79
Limitations ... 80
7
Applying the Model ... 81
7.1 Introduction ... 82
7.2 Empiricism and Calculations ... 83
Cost ... 83
Regulations ... 90
Service ... 93
Environmental Impact ... 95
7.3 Result of Scenarios ... 98
Result – Cost ... 98
Result – Regulations ... 101
Result – Service ... 101
Result – Environmental impact ... 102
7.4 Analysis of Result ... 102
Scenario 2: Centralizing to Denmark ... 104
Scenario 3: Centralizing to Sweden ... 104
8
Evaluating the Model ... 105
8.1 Introduction ... 106
8.2 Performance ... 106
Did the Model Give a Correct/Reasonable Result ... 106
Did the Model Cover all Elements of Importance ... 108
Did the Model Have a Good Detail Level ... 108
9
Conclusions ... 112
10
Discussion ... 115
Figure 1: Schematic map over the physical setup in Swedish. ... 7
Figure 2: Schematic map over the physical setup in Denmark. ... 8
Figure 3: Map of the Swedish export structure and flow of goods. ... 10
Figure 4: Map of the Danish export structure and flow of products. ... 11
Figure 5: Current setup. ... 12
Figure 6: Scenario 1a and scenario 1b including the flow of goods. ... 13
Figure 7: Scenario 2 including the flow of goods. ... 14
Figure 8: Scenario 3 including the flow of goods. ... 14
Figure 9: Container ship. (Maersk, 2016) ... 20
Figure 10: Delivery van. ... 21
Figure 11: Motor vehicles with trailer (according to Swedish regulations). ... 22
Figure 12: Motor vehicles with trailer (according to European regulations). ... 22
Figure 13: Pallet. (Europallets.lt, 2016) ... 24
Figure 14: Container (Maersk, 2016) ... 24
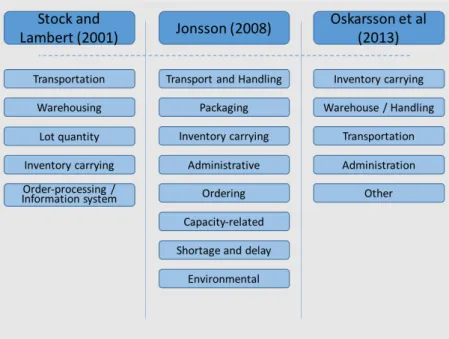
Figure 15: The three total cost concept models with their respective cost categories. Oskarsson et al (2013) is freely translated from Swedish. ... 30
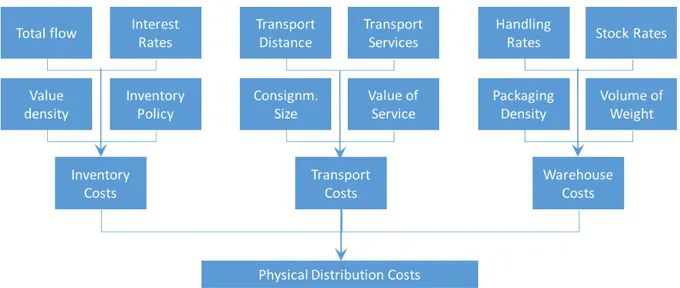
Figure 16: Hierarchy showing the breakdown of logistics costs. inspired by (Tavasszy, et al., 1998) ... 32
Figure 17: Service elements. (Christopher, 2011; Jonsson, 2008; Oskarsson et al., 2013) ... 33
Figure 18: NTM-‐method, main calculation steps. (NTM -‐ Network for Transport Measures, 2016) ... 36
Figure 19: The purpose with underlined key elements. ... 39
Figure 20: General studied system -‐ distribution structure for overseas export of frozen food. ... 39
Figure 21: Steps necessary to develop the model. ... 40
Figure 22: Comparing two methods for developing a model. ... 42
Figure 23: Illustration of the overall working process. ... 43
Figure 24: Creating a theoretical model, step 1. ... 43
Figure 25: Creating a theoretical model, step 2. ... 44
Figure 26: Creating a theoretical model, step 3. ... 44
Figure 27: Creating a theoretical model, step 4. ... 45
Figure 28: Creating a theoretical model, step 5. ... 46
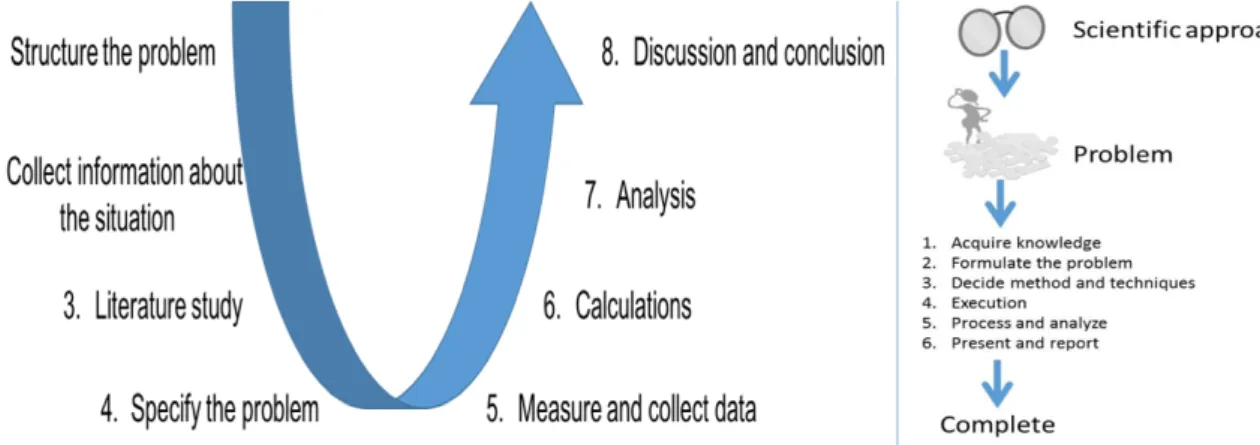
Figure 29: Visualization of Lekvall and Wahlbin (2001)´s model to the left and Patel and Davidson (2011)´s six steps to the right . ... 50
Figure 30: The developed approach model. ... 51
Figure 31: Process used for building the Frame of Reference. Influenced by Saunders (2009). ... 56
Figure 32: Questions to think about when selecting literature ... 56
Figure 33: The developed working model of the study. Created in chapter 4 Task specification. ... 57
Figure 34: Example of price estimation for new sea freight routes outside current contract. ... 62
Figure 35: The theoretical model, created in section 4.2.1. ... 65
Figure 36: The final developed model. ... 78
Figure 37: Illustration of the current setup and the three scenarios. ... 82
Figure 38: The developed model, revisited. ... 83
Figure 39: Illustrated result of road transport cost for respective scenario. Figures are manipulated and do NOT reflect reality. ... 98
Figure 40: Illustrated result of warehousing cost for respective scenario. Figures are manipulated and do NOT reflect reality. ... 98
Figure 41: Illustrated result of freezing cost for respective scenario. Figures are manipulated and do NOT reflect reality. ... 99
Figure 42: Illustrated result of veterinary cost for respective scenario. Figures are manipulated and do NOT reflect reality. ... 99
Figure 43: Illustrated result of sea freight cost for respective scenario. Figures are manipulated and do NOT reflect reality. ... 100
Figure 44: Illustration of total cost for respective scenario. Figures are manipulated and do NOT reflect reality. ... 100
Figure 46: Illustration of resulting environmental impact for respective scenario. Figures are manipulated and do NOT reflect reality. ... 102
Figure 47: Resulting costs per scenario, divided on the five cost elements. Created in chapter 7 Applying the model. Figures are manipulated and do NOT reflect reality. ... 109
Figure 48: The final developed model. ... 114
Figure 49: The resulting model. ... 116
Table 1: Interviewed roles during the planning phase and the type of interview ... 55
Table 2: Converters from kilogram to other units. ... 61
Table 3: Cost structure for transportation from production to warehouse for Swedish, Danish and cross-‐border flow. ... 67
Table 4: Cost drivers for the main warehouse sub-‐activities performed on the export product flow. ... 68
Table 5: Cost drivers for transportation from warehouse to domestic port for Sweden and Denmark. ... 68
Table 6: Cost drivers for sea freight from domestic port to destination port. ... 68
Table 7: Cost drivers for transportation from destination port to customer. ... 69
Table 8: Cost drivers for inventory carrying cost. ... 69
Table 9: A summary of calculations and processing made for the model. Processing is shaded in blue ... 79
Table 10: Excerpt of Swedish export volumes from production units to warehouses 2015.Figures are manipulated and do NOT reflect reality. ... 84
Table 11: Summary of Swedish export volumes 2015. Figures are manipulated and do NOT reflect reality. ... 84
Table 12: Danish export volumes 2015. Figures are manipulated and do NOT reflect reality. ... 84
Table 13: Number of export truckloads from Vinderup to the two warehouses. Figures are manipulated and do NOT reflect reality. ... 84
Table 14: Road transport costs for respective scenario. Figures are manipulated and do NOT reflect reality. .... 85
Table 15: Cost driver volumes 2015 for each current flow. ... 85
Table 16: No of containers sent from respective warehouse and produced in respective production unit 2015. Figures are manipulated and do NOT reflect reality. ... 86
Table 17: Summarized cost per cost driver for respective warehouse. Figures are manipulated and do NOT reflect reality. ... 87
Table 18: Warehousing cost for respective scenario. Figures are manipulated and do NOT reflect reality. ... 87
Table 19: Freezing prices for respective warehouse. Figures are manipulated and do NOT reflect reality. ... 88
Table 20: Freezing cost for respective scenario. Figures are manipulated and do NOT reflect reality. ... 88
Table 21: Veterinary prices for respective warehouse. Figures are manipulated and do NOT reflect reality. ... 88
Table 22: Veterinary cost for respective scenario. Figures are manipulated and do NOT reflect reality. ... 89
Table 23: Average sea freight price differences between warehouses (EUR/shipped container). Figures are manipulated and do NOT reflect reality. ... 89
Table 24: Sea freight cost for respective scenario. Figures are manipulated and do NOT reflect reality. ... 90
Table 25: Export approvals for Swedish warehouses. ... 91
Table 26: Export approvals for Danish warehouses. ... 91
Table 27: Regulatory possibilities and obstacles for a joint warehouse in Mors. ... 92
Table 28: Regulatory possibilities and obstacles for a joint warehouse in Staffanstorp. ... 92
Table 29: Average sea freight lead time differences between warehouses. ... 93
Table 30: The number of reduced and increased lead times compared to the current setup, for respective scenario. Figures are manipulated and do NOT reflect reality. ... 93
Table 31: Ordering time requirements for containers, Sea freight supplier 2. ... 94
Table 32: Container loading capacity per warehouse. ... 94
Table 33: CO2 emission indexes for different truck types. ... 95
Table 34: Route specific CO2 emissions from production unit to warehouse, per transported kilogram. ... 95
Table 35: Road transport CO2 for respective scenario. Figures are manipulated and do NOT reflect reality. ... 96
Table 36: Types of vehicles used in Sea freight CO2 calculations and their CO2 emission indexes per container and kilometer. ... 96
Table 37: Route specific CO2 emissions from warehouse to port of Hamburg, (kg per transported container). . 96
Table 38: Sea freight CO2 for respective scenario (Kg). Figures are manipulated and do NOT reflect reality. .... 97
Table 39: Summarized regulatory knowledege for respective scenario. ... 101
Table 40: Comparison cost averages, model result and values obtained from HKScan. Figures are manipulated and do NOT reflect reality. ... 107
Table 41: Marking and labeling as part of total warehousing costs for the export flow for Swedish warehouses ... 108
Table 42: The difference in cost for veterinary between the current setup and the three scenarios. ... 110
Table 43: Cost for veterinary as part of total costs per scenario. ... 110
Table 44: Comparing the models cost for storing with a simplified version using a cost per kilogram going into the warehouse. Figures are manipulated and do NOT reflect reality. ... 111
1 Introduction
In the following chapter, the background and purpose of the study will be presented together with directives and limitations. After that, the requirements of an academic study are briefly described. All figures of volumes and prices and the ratios of the figures presented in the report are manipulated and do NOT reflect reality.
1.1 Background
The current ongoing globalization has increased the competition within almost all industries and markets. As part of the globalization, geographic market boundaries have become increasingly more indistinct making companies’ potential markets considerably larger. (Lasserre, 2012) Alongside the globalization there are statistics from the World Bank (2015) showing that the economic growth in the world is increasing, which creates yearly sales growth for many industries and markets.
One of the industries that have seen the increase in growth and competition is the food industry and especially the meat industry (World Health Organization, 2012; Dani, 2015). A big part of the demand increase is from developing countries, which will increase the potential export from the industrialized countries (Alexandratos & Bruinsma, 2012). According to Alexandratos and Bruinsma (2012) the meat trend will have a steady increase until at least 2050 meaning that meat producers in the western world have a possibility to further enter a strongly growing market. However, the competition is also increasing, forcing companies that wants to exploit this possibility to focus on their export organizations and the structural effectiveness for their overseas distribution.
Because of the trends mentioned above it would be highly interesting from a logistics point of view to develop a model that could compare different logistical distribution structures in a food context regarding cost, service and environmental aspects. The use of models within science has been done since the nineteenth century (Gerlee & Lundh, 2012) and models can be divided into different classes depending on their intended use. The majority of models within logistics, cost calculations and distribution that has been seen are described on an abstract level in textbooks and publications so that they can be applicable to a high variety of situations but are often in need of modification and adoption to give good results (Gerlee & Lundh, 2012; Oskarsson, et al., 2013). See for example Jonsson (2008)’s model for distribution and Stock and Lambert (2001)’s model for total logistics costs.
HKScan is one of the largest meat producers in Europe with total net sales of two billion euros in 2014, a part of that sales was accounted for by the overseas export (Johansson, 2016). The group is divided into four different geographical subsidiaries where it also has its main markets; Finland, Sweden, Denmark and the Baltic countries. HKScan is at the starting point of looking at how to structure the Swedish and Danish warehouse placement for overseas export. The investigation is complex as it tries to consider the total cost effects of involving two different national systems. Above total costs, HKScan are interested in understanding what regulations might affect the distribution structure, the effect on delivery service and the chosen structure’s impact on the environment. At this stage in the investigation, they are focusing on understanding the current setup and comparing it to a few alternative scenarios, where potential investment costs are not to be taken into account. (Stefenson, 2016)
As shown above, the meat industry is in a trend that implies that western world meat producers will need to focus more on their distribution effectiveness. What is also clear is that even though the area of distribution structures is well researched, there are no specific models that have been adopted to evaluate distribution structures in the food context. Combining the current food and meat trends with the situation of HKScan therefore leads to the purpose of this study, which is presented below.
1.2 Purpose
For HKScan, develop a model that evaluates distribution structures for overseas export of frozen food regarding total cost, delivery service, environmental impact and regulations.
1.3 Directives
After an evaluation model has been developed, it should be tested through applying it on the case company HKScan. The model should there be tested on several different distribution structures including the current setup and alternative pre-‐determined scenarios.
The model should aim to evaluate distribution structures from the four parameters cost, delivery service, environmental impact and regulations. However, the model should not compare the different parameters to give a result where one distribution structure is better than the other. Instead, the model should present the different measures, leaving the interpretation to the user.
1.4 Delimitations
There are a few delimitations to the case study set by HKScan, which intends to make the study more manageable. The delimitations are presented below:
• The study will only include the overseas export flow. All the domestic and European export flows are to be unchanged, independently of the changes made within the study. This also implies that possible cost impact on the domestic and European export flow is to be ignored. • The investigation should only include the overseas export of frozen products, which
represents the majority of the total overseas export flow. This means that the flow of fresh products is to be left out.
• When applying the model onto the scenarios, historical data from the full year of 2015 will be used and seen as representative for coming years. This regards the volumes produced at each production unit and the end customer characteristics.
• In the comparison between the scenarios, no investment costs should be taken into account. This means that the focus is on changes to the ongoing costs. As a result of this, no
consideration will be taken to limitations regarding capacity, organization and information systems.
• Changes in internal costs, e.g. administration towards suppliers, are delimited from the study.
• All type of information flow and its impact on cost and service is delimited from the study.
1.5 Requirements of an academic study
In an academic study, there is a set of generally accepted requirements, which will be introduced in this section.
Björklund and Paulsson (2012) mention five requirements that according to them are the most important for a scientific paper or report. Firstly, an academic report has to be based on, or consider already existing academic knowledge within the current area and give new knowledge related to that area. This means that existing theories, models and data should be both presented and considered as well as discussed regarding its conformity with the results of the study. Secondly, a report should process questions of both general and theoretical interest, which means that if a study is digging deep into a very specific problem it has to relate to a more overall and general area. Thirdly, generally accepted scientific methods should be used to create new knowledge through the report, which include that the method should be controllable, independent on the individual and possible to repeat. Fourthly, the paper has to follow a logical functioning path and lastly the reader has to be given the opportunity to take a stand regarding the study and the results from it.
On top of the requirements, Credibility is expected when writing a report and to fulfill that, validity, reliability and objectivity needs to be in place (Björklund & Paulsson, 2012). These terms will be further explained below and in chapter 5, Methodology, it is discussed how this study was carried out to achieve them.
According to Patel and Davidsson (2011) validity is a measurement of how well a study examines what actually was intended to be examined and that reliability is a measurement for knowing that the examination is done in a reliable way. Further, the authors state that there is a dependency between the two terms; good reliability is a presumption for good validity, but not the other way around. For example, an instrument or measurement method is reliable if it is not affected by external coincidence according to Patel & Davidsson (2011). Lekvall & Wahlbin (2001) and Arbnor & Bjerke (2009) states that reliability is achieved if the same results are obtained from repeated measurements. However, Patel & Davidsson (2011) do note that an instrument can give the same false value from repeated measurements if the instrument is measuring the same error every time. A measurement instrument is according to Arbnor and Bjerke (2009) valid if the measurements are close to reality. Since the only way of checking the validity directly is to compare a measurement with reality, validity is harder to check than reliability. This is because the reality normally is unknown; otherwise, the measurements had not been made. (Lekvall & Wahlbin, 2001)
According to Saunders, Lewis and Thornhill (2009) objectivity is about avoiding subjective selection and conscious bias during research. Björklund and Paulsson (2012) have a similar view stating that the extent of how values affect the result of the study is addressed by objectivity. To achieve objectivity it is important to collect the data accurately and fully during data collection and then make sure that the data is interpreted correctly during the analysis (Saunders, et al., 2009). Another way of working with objectivity is to give the reader the possibility to reflect upon the results by making choices and limitations clear and motivated (Björklund & Paulsson, 2012).
Gammelgaard (2004) states that there are only two frequently used methods within the field of logistics, the analytical approach and the systems approach. Further, Gammelgaard (2004) advocates the systems approach, since logistics is too complex for deriving causal-‐effect relations that an analytic approach is based on. Because of this, a systems approach will be used in this study. According to Björklund and Paulsson (2012) and Arbnor and Bjerke (2009) a system consist of different parts that have been coordinated to achieve a determined goal. When using a systems approach it is regarded that, the whole is greater than the sum of its consisting parts. Björklund and Paulsson (2012) highlights that systems parts do affect each other and that there are synergy effects between them, which are important to understand. The systems approach also has the positive function of describing the reality objectively (Björklund & Paulsson, 2012).
2 Case Description
In the following chapter, HKScan and its organization will be described generally through a company description. Thereafter systems and HKScan organizations that are in focus for the study will be described in more detail. Lastly, the different alternative distribution structure scenarios for the overseas export will be presented. All figures of volumes and prices and the ratios of the figures presented in the report are manipulated and do NOT reflect reality.
2.1 Company Description
This section begins with HKScan’s business and background, thereafter the Swedish and Danish organizations are specifically described in more detail.
HKScan Group
HKScan is a company group that produces and sells meat products to industrial and consumer markets. The group has its roots from the company HK in Finland. HK started an internationalization process in 1998 when they bought the greatest meat producer in the Baltic countries, AS Rakvere Lihakombinaat. Since then several acquisitions and reorganizations have been done. As part of that, the Swedish company Scan AB was bought in 2007, which at that time almost doubled the turnover for HK and the group took the new name HKScan. HKScan then bought Rose Poultry A/S in 2010, which at the time was the biggest Danish company in the poultry industry (HKScan, 2013). The main geographical markets today are Finland, Sweden, Denmark and the Baltic countries that also reflect the organizational structure. The production is mainly based in these regions with the exception of one factory in Poland.
In addition to the production, HKScan also import meat from New Zealand, Brazil and Uruguay to sell on the home markets (Pasi Hiltunen HKScan, 2016) The Group had 7 700 employees and total net sales of two billion euros in 2014, which made HKScan the 14th greatest meat producer in Europe. (HKScan Sweden, 2015) Atop of the production and sales units in the home markets, the company’s export sales covers almost 50 countries with sales offices in Great Britain and Germany. (Pasi Hiltunen HKScan, 2016) The product portfolio covers beef, pork, lamb and poultry and includes pieces of meat, meat products, sausages and pasties among others. (HKScan Sweden, 2015)
The business of HKScan includes the supply and slaughter of animals, meat production and marketing and distribution of their products. On top of that, HKScan also have a large involvement in the animal genetics, primary animal production and feed production where they are working to establish more long-‐term and sustainable contracts with the farmers. (HKScan Sweden, 2015) The functional organization looks different among the four regions but some of the more common functions are Market, Production, Quality and Supply chain management. The head of each function in the different regions, for example the supply chain managers, have regular meetings together with a Group Vice president (VP) to coordinate the business between the nations.
The future vision of HKScan is to be a responsible role model for the meat industry and to be the Nordic experts on meat. The present strategy was set on group level 2012 and started with moving the organization from a holding company to a more united HKScan, thereafter finding synergy effects within the group. The next step in the strategy is now to expand with increased profitability. The values that should be shared among all the personnel is TRUST, IMPROVE and TEAM. (HKScan Sweden, 2015)
HKScan Sweden’s Organization and Setup
The Swedish organization, HKScan Sweden, is one of the two biggest organizations within HKScan together with Finland. The total net sales were 911 million euro in 2014 and the number of employees where about 2 150. The production sites are located at four different locations; in Linköping, Skara, Kristianstad and Halmstad, see Figure 1. The warehouse structure is divided into chilled and frozen products. The one warehouse for chilled products, which is also the main distribution center, is located in Linköping and the other four warehouses for frozen products (freezer warehouses) are located in Staffanstorp, Helsingborg, Skara and Jordbro. (HKScan Sweden, 2015) The warehouse structure can also be seen in Figure 1 on the next page.
Figure 1: Schematic map over the physical setup in Swedish.
Linköping has beef and lamb slaughterhouses and cutting, and produce processed consumer products such as packed meat, minced meat and sausages. In Kristianstad the slaughter, cutting and packaging of pork is carried out whereas in Skara different processed products and pâtés are made out of meat raw material from Linköping and Kristianstad. Some processed products are also produced in Halmstad. (Bäckström, 2016) HKScan Sweden have the responsibility for the production unit in Poland where bacon is produced using both Swedish meat and meat from other origins. Beyond the production sites with associated offices, there is a sales office located in Stockholm. HKScan is marketing and selling products on the Swedish market under the brands Scan, Pärssons and Flodins among others but do also produce several private label products. (HKScan Sweden, 2015)
The Swedish organization consists of several functional teams, with logistics being the most relevant function for this study and therefore described in more detail under the section HKScan Export below. The logistics organization is for example responsible for the procurement of transportation between the production sites, warehouses and the warehouse services.
HKScan Denmark
’s Organization and Setup
The total net sales for the Danish organization, HKScan Denmark, were 204 million euro in 2014 and the number of employees were around 770. The production sites are located in Vinderup and Skovsgaard, which can be seen in Figure 2 on the next page. Just like in Sweden, there is only one warehouse for chilled products, placed in Vinderup, and several warehouses for frozen products. There are two small buffer-‐warehouses in connection to the production units, then there is a customer warehouse in Vejle, and lastly there are two warehouses used for storage in Padborg and in Mors. Mors is the most used warehouse for frozen products with approximately 80 percent of total volumes. (Søgaard, 2016a; HKScan Sweden, 2015) The warehouse structure can also be seen in Figure 2 on the next page.
Figure 2: Schematic map over the physical setup in Denmark.
All the actual production is carried out in Vinderup while some parts of the packaging are made in Skovsgaard. Almost exclusively the products are labeled under the brand Rose. (Søgaard, 2016a) The main markets for the Danish poultry products are Denmark, Sweden and the UK.
As in Sweden, the Danish organization consists of several functional teams with logistics being the most relevant function for the study and therefore described in more detail below. The responsibilities for the Danish logistics organization are the same as for the Swedish, namely procurement of transportations between production sites and warehouses, the warehouse and the warehouse services.
2.2 HKScan Export
In this section, parts of HKScan’s business and organization that are of special interest to the study will be presented. First, the overseas export business will be described on a high level, thereafter the export and logistics organizations are presented together with their physical setup.
The Overseas Export of Frozen Meat
In total, HKScan’s products reach almost 50 countries around the world (HKScan Sweden, 2015). The type of products that are being exported and the reason behind it differs between the producing countries. For example, Denmark is as a country that is more than self-‐sufficient for poultry and therefore exports a lot of it. (Johansson, 2016; Danish Agriculture & Food Council, 2014) HKScan Denmark exports about 70 percent of its produced volumes (Søgaard, 2016a). This makes Denmark by far the largest exporting region within the HKScan group (Johansson, 2016).
For HKScan, overseas export refers to products that are sold outside of Europe (Stefenson, 2016). As the distances to the overseas markets are long, all meat but one or two percent is frozen down before it is transported to its intended destination by sea freight. In 2014, the overseas export included 280 thousand tons of meat products to 20 different locations, mainly in Southeast Asia. To handle such a large flow of goods, the company group uses eleven freezer warehouses and five ports. During 2014 approximately 11200 reefers (containers with cooling system) were sent to customers around the world. (Pasi Hiltunen HKScan, 2016)
Which products that goes to which markets from HKScan Denmark are decided upon where the best price is at the given moment. The products that mainly go to the overseas markets are chicken