Scalable Analysis of Large Datasets in Life Sciences
LAEEQ AHMED
Doctoral Thesis in Computer Science
Stockholm, Sweden 2019
TRITA-EECS-AVL-2019:69 ISBN: 978-91-7873-309-5
KTH Royal Institute of Technology SE-100 44 Stockholm SWEDEN
Akademisk avhandling som med tillstånd av Kungl Tekniska högskolan framlägges till offentlig granskning för avläggande av teknologie doktorsexamen i elektrotek-nik och datavetenskap tisdag den 3:e Dec 2019, klockan 10.00 i sal Kollegiesalen, Brinellvägen 8, KTH-huset, Kungliga Tekniska Högskolan.
© Laeeq Ahmed, 2019
To my respected parents, my beloved wife and my lovely brother and sister
Abstract
We are experiencing a deluge of data in all fields of scientific and business research, particularly in the life sciences, due to the development of better instrumentation and the rapid advancements that have occurred in informa-tion technology in recent times. There are major challenges when it comes to handling such large amounts of data. These range from the practicalities of managing these large volumes of data, to understanding the meaning and practical implications of the data.
In this thesis, I present parallel methods to efficiently manage, process, analyse and visualize large sets of data from several life sciences fields at a rapid rate, while building and utilizing various machine learning techniques in a novel way. Most of the work is centred on applying the latest Big Data Analytics frameworks for creating efficient virtual screening strategies while working with large datasets. Virtual screening is a method in cheminformatics used for Drug discovery by searching large libraries of molecule structures. I also present a method for the analysis of large Electroencephalography data in real time. Electroencephalography is one of the main techniques used to measure the brain electrical activity.
First, I evaluate the suitability of Spark, a parallel framework for large datasets, for performing parallel ligand-based virtual screening. As a case study, I classify molecular library using prebuilt classification models to filter out the active molecules. I also demonstrate a strategy to create cloud-ready pipelines for structure-based virtual screening. The major advantages of this strategy are increased productivity and high throughput. In this work, I show that Spark can be applied to virtual screening, and that it is, in general, an appropriate solution for large-scale parallel pipelining. Moreover, I illustrate how Big Data analytics are valuable in working with life sciences datasets.
Secondly, I present a method to further reduce the overall time of the structured-based virtual screening strategy using machine learning and a conformal-prediction-based iterative modelling strategy. The idea is to only dock those molecules that have a better than average chance of being an in-hibitor when searching for molecules that could potentially be used as drugs. Using machine learning models from this work, I built a web service to predict the target profile of multiple compounds against ready-made models for a list of targets where 3D structures are available. These target predictions can be used to understand off-target effects, for example in the early stages of drug discovery projects.
Thirdly, I present a method to detect seizures in long term Electroen-cephalography readings – this method works in real time taking the ongoing readings in as live data streams. The method involves tackling the challenges of real-time decision-making, storing large datasets in memory and updating the prediction model with newly produced data at a rapid rate. The resulting algorithm not only classifies seizures in real time, it also learns the thresh-old in real time. I also present a new feature “top-k amplitude measure” for classifying which parts of the data correspond to seizures. Furthermore, this feature helps to reduce the amount of data that needs to be processed in the subsequent steps.
Sammanfattning
Vi upplever just nu en flodvåg av data inom både vetenskaplig forskning och fä-retagsdriven utveckling. Detta gäller framfärallt inom livsvetenskap på grund av utveckling av bättre instrument och framsteg inom informationsteknologin under de senaste åren. Det finns dock betydande utmaningar med hanteringen av sådana datamängder som sträcker sig från praktisk hantering av de stora datavolymerna till färståelse av betydelsen och de praktiska implikationerna av dessa data.
I den här avhandlingen presenterar jag metoder fär att snabbt och effektivt hantera, behandla, analysera och visualisera stora biovetenskapliga datamängder. Stärre delen av arbetet är fokuserat på att tillämpa de senaste Big Data ramver-ken fär att på så sätt skapa effektiva verktyg fär virtuell screening, vilket är en metod som används fär att säka igenom stora mängder kemiska strukturer fär lä-kemedelsutvecklings. Vidare presenterar jag en metod fär analys av stora mängder elektroencefalografidata (EEG) i realtid, vilken är en av de huvudsakliga metoderna fär att mäta elektrisk hjärnaktivitet.
Färst utvärderar jag lämpligheten att med Spark (ett parallellt ramverk fär stora datamängder) genomfära parallell ligand-baserad virtuell screening. Jag applicerar metoden fär att klassificera samlingar med molekyler med hjälp av färtränade mo-deller fär att selektera de aktiva molekylerna. Jag demonstrerar även en strategi fär att skapa molnanpassade fläden fär strukturbaserad virtuell screening. Den hu-vudsakliga färdelen med den här strategin är äkad produktivitet och häg hastighet i analysen. I det här arbetet visar jag att Spark kan användas fär virtuell scree-ning och att det även i allmänhet är en lämplig lässcree-ning fär parallell analys av stora mängder data. Dessutom visar jag genom ett exempel att Big Data analys kan vara värdefull vid arbete med biovetenskapliga data.
I den andra delen av mitt arbete presenterar jag en metod som ytterligare minskar tiden fär den strukturbaserade virtuella screening genom användning av maskininlärning och en iterativ modelleringsstrategi baserad på Conformal Predic-tion. Syftet är att endast docka de molekyler som har en hägre sannolikhet att binda till ett målprotein, vid säkning efter molekyler som potentiellt kan användas som läkemedelskandidater. Med användning av maskininlärningsmodellerna från detta arbete har jag byggt en webbtjänst fär att färutsäga en profil av en molekyls olika interaktioner med olika målprotein. Dessa prediktioner kan användas fär att indikera sekundära interaktioner i tidiga skeden av läkemedelsutvecklingen.
I den tredje delen presenterar jag metoder fär att detektera anfall med långtids-EEG - den här metoden fungerar i realtid genom att ta pågående mätningar som datasträmmar. Metoden mäter utmaningarna med att fatta beslut i realtid att lagra stora mängder data i datorns minne och uppdatera färutsägelsemodellen ny data som produceras i snabb takt. Den resulterande algoritmen klassificerar inte bara anfall i realtid, den lär sig också gränsvärdet i realtid. Jag presenterar också ett nytt mått, “topp-k amplitudmått” fär att klassificera vilka delar of data som motsvarar anfall. Utäver detta hjälper måttet till att minska mängden data som behäver behandlas i efterfäljande steg.
Acknowledgments
Throughout the research work for this dissertation and during its completion, I received a great deal of help and assistance. First of all, I would like to specially thank my supervisor, Dr. Erwin Laure, who was always helpful – both in acade-mic, as well as administrative, matters – and who guided me with his useful advice to improve my work.
I was lucky to have Dr. Ake Edlund and Dr. Ola Spjuth as my co-supervisors – they provided valuable advice to direct my research and collaborated with me in formulating research questions and methodologies. I would also like to acknowledge all my co-authors and collaborators, especially Dr. Ola’s research group at Uppsala Bio-medicine Centre, Uppsala University. They were the nicest colleagues and were always helpful, both practically and theoretically.
This work would not have been possible without financial support from my home and host universities, the University of Engineering and Technology, Pesha-war, and the KTH Royal Institute of Technology, Stockholm, respectively. I am grateful for their support and for showing confidence in my abilities.
I would also like to thank all my colleagues at the PDC Centre for High Perfor-mance Computing, and specially Genet Edmondson, who provided her precious time for proofreading my thesis, and Daniel Ahlin, who translated the abstract to Swedish, and Mohammad Rezaei, who was helpful in daily discussions and routine tasks.
I would also like to thank Dr. Vincent Breton for being the opponent and the committee members Dr. Samuel Coulbourn Flores, Dr. Jessica Lindvall and Dr. Panos Papapetrou for being part of the thesis defence and, for their constructive and encouraging discussion. I would also like to thank the Advance Reviewer Dr. Pawel Herman for his constructive comments that helped me to improve the thesis.
Acknowledgments ix
Contents x
List of Abbreviations xiv
1 Introduction 1
1.1 Big Data Analytics and Life Sciences: A Motivation . . . 1
1.2 Research Questions and Thesis Contributions . . . 4
1.3 List of Scientific Publications . . . 5
1.4 Thesis Overview . . . 7
2 Background 9 2.1 Big Data . . . 9
2.1.1 Big Data Characteristics . . . 9
2.1.2 Big Data Processing Frameworks . . . 10
2.2 Apache Spark . . . 12 2.2.1 Spark Streaming . . . 14 2.3 Cloud Computing . . . 15 2.3.1 Definition . . . 15 2.3.1.1 Essential Characteristics . . . 15 2.3.1.2 Service Models . . . 15 2.3.1.3 Deployment Models . . . 17 2.4 Microservices . . . 18 2.4.1 Deploying Microservices . . . 18 2.4.1.1 Docker Containers . . . 18 2.4.1.2 Kubernetes . . . 18
2.5 Machine Learning and Big Data Analytics . . . 19
2.5.1 Types of Learning . . . 19
2.5.1.1 Supervised Learning . . . 19
2.5.1.2 Unsupervised Learning . . . 20
2.5.2 Machine Learning Algorithms . . . 20
2.5.3 Conformal Prediction . . . 21
CONTENTS xi
2.5.3.1 Inductive Conformal Prediction . . . 22
2.5.4 Machine Learning Libraries for Big Data Analytics . . . 22
2.6 Cheminformatics . . . 24
2.6.1 Drug Discovery . . . 25
2.6.2 Virtual Screening . . . 26
2.6.2.1 Ligand-Based Virtual Screening . . . 26
2.6.2.2 Structure-Based Virtual Screening . . . 27
2.6.2.3 Off-Target Predictions . . . 27 2.7 Neuroinformatics . . . 28 2.7.1 Electroencephalography . . . 28 2.8 Summary . . . 28 3 Related Work 31 3.1 Virtual Screening . . . 31
3.1.1 Parallel and Distributed Methods . . . 31
3.1.2 Intelligent Iterative Methods . . . 35
3.1.3 Predicted Target Profiles . . . 36
3.2 Electroencephalography . . . 37
3.2.1 Parallel EEG Analysis . . . 37
3.2.2 Epileptic Seizure Detection . . . 39
3.3 Summary . . . 41
4 Parallel Modelling For Data Intensive Virtual Screening 43 4.1 Introduction . . . 43
4.2 Using Iterative MapReduce for Parallel Virtual Screening: Feasibility Study for Spark . . . 44
4.2.1 Virtual Screening and LibSVM . . . 45
4.2.2 Parallel Ligand-Based Virtual Screening Implementation . . . 45
4.2.2.1 Tools and Infrastructure . . . 45
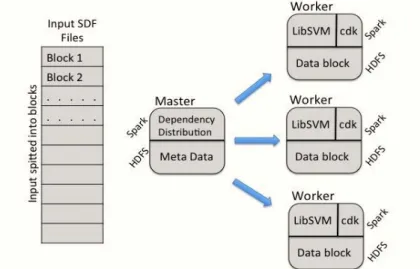
4.2.2.2 Architecture of Parallel Ligand-Based Virtual Screen-ing . . . 47
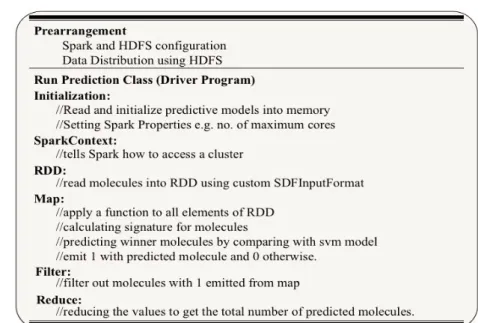
4.2.2.3 Workflow of the Driver Program . . . 47
4.2.3 Results and Discussion . . . 50
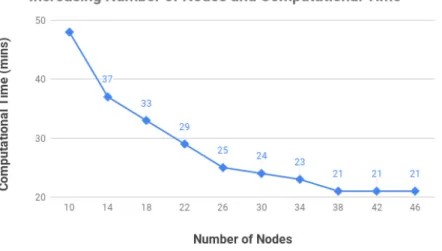
4.2.3.1 Horizontal Scaling and Parallelization . . . 50
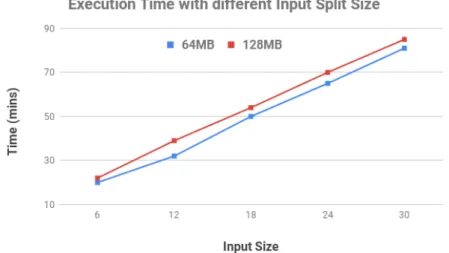
4.2.3.2 Input Split Size . . . 51
4.3 Large-scale Structure-Based Parallel Virtual Screening on public cloud resources with Apache Spark . . . 52
4.3.1 SBVS Pipelines . . . 53 4.3.1.1 Data Input . . . 53 4.3.1.2 Parallel Screening . . . 54 4.3.2 Experiments . . . 55 4.3.2.1 Environment Settings . . . 55 4.3.2.2 Benchmarking . . . 55
4.3.3 Discussion . . . 56
4.4 Summary . . . 58
5 Efficient Intelligent Modelling For Virtual Screening and Appli-cations 59 5.1 Introduction . . . 59
5.2 Efficient Iterative Virtual Screening with Apache Spark and Confor-mal Prediction . . . 60 5.2.1 Methods . . . 61 5.2.1.1 Data . . . 61 5.2.1.2 CPVS Iterative Strategy . . . 61 5.2.1.3 Modelling . . . 62 5.2.2 Results . . . 63
5.2.2.1 Initial Training Set and Labeling Strategy . . . 63
5.2.2.2 Incremental Model Building . . . 65
5.2.2.3 Efficiency of CPVS . . . 65
5.2.3 Discussion . . . 66
5.3 Predicting Target Profiles As A Service Using Docking Scores . . . . 68
5.3.1 Methods . . . 69
5.3.1.1 Data and Tools . . . 69
5.3.1.2 Docking Score Based Modelling . . . 70
5.3.1.3 Predicting Target Profile as a Web Service . . . 71
5.3.2 Results . . . 72
5.3.2.1 Virtual Screening Evaluation . . . 72
5.3.2.2 Model Evaluation . . . 73
5.3.3 Discussion . . . 74
5.4 Summary . . . 76
6 Analysis of Life Sciences Data in Real Time 79 6.1 Introduction . . . 79
6.2 Epileptic Seizures and Characteristics . . . 80
6.3 Parallel Real Time Seizure Detection in Large EEG Data . . . 81
6.3.1 Tools And Architecture . . . 81
6.3.2 Feature Selection . . . 83
6.3.2.1 Amplitude of Top-K values . . . 83
6.3.2.2 Multi-window Measure . . . 84
6.3.2.3 Multichannel Measure . . . 85
6.3.3 Algorithm Workflow and Implementation . . . 85
6.4 Experiments and Results . . . 87
6.4.1 EEG Dataset . . . 87
6.4.2 Seizure Detection . . . 88
6.4.2.1 Sensitivity . . . 88
6.4.2.2 Specificity . . . 88
CONTENTS xiii
6.4.3.1 Scaling And Latency . . . 89
6.5 Summary . . . 90
7 Discussions 91 7.1 Parallel Methods for Virtual Screening . . . 91
7.2 Intelligent Iterative Methods for Virtual Screening and applications . 92 7.3 Analysis of Life Sciences Data in Real Time . . . 92
8 Conclusions and Future Work 95 8.1 Conclusions . . . 95
8.2 Future work . . . 97
8.2.1 Improved Load Balancing in SBVS . . . 97
8.2.2 Optimized CPVS . . . 97
8.2.3 CPVS via Novel Machine Learning Methods . . . 98
8.2.4 Extending PTPAAS . . . 98
8.2.5 Complete Pipeline for EEG Analysis . . . 98
List of Abbreviations
ALS Alternating Least Squares Amptop−k Average top-k Amplitude ANN Artificial Neural Networks API Application Program Interface
BAN Body Area Network
BCI Brain Computer Interface
CDK Chemistry Development Kit
CMA Cumulative Mean Amplitude
CPU Central Processing Unit
CPVS Conformal Prediction Based Virtual Screening CUDA Compute Unified Device Architecture
DAG Directed Acyclic Graph
DNA Deoxyribonucleic Acid
DOVIS Docking-based Virtual Screening DUD Directory of Useful Decoys
EEG Electroencephalography
ETL Extract, Transform, Load GBSA Generalized Born Surface Area
GFS Google File System
GMR Google MapReduce
GPU Graphical Processing Unit
GPGPU General Purpose Computing on GPU HDFS Hadoop Distributed File System
xv
HPC High Performance Computing
HTS High-Throughput Screening IAAS Infrastructure As A Service ICA Independent Component Analysis ICP Inductive Conformal Prediction
INCF International Neuroinformatics Coordinating Facility
LBFGS Limited Memory Broyden-Fletcher-Goldfarb-Shanno Algorithm LBVS Ligand-Based Virtual Screening
ML Machine Learning
MPI Message Passing Interface
MR MapReduce
NCE Novel Chemical Entity
PAAS Platform As A Service
PEs Processing Elements
PDB Protein Data Bank Archive
PTPAAS Predicting Target Profiles As A Service PVM Parallel Virtual Machine
RDD Resilient Distributed Datasets SAAS Software As A Service
SAR Structure-Activity Relationship SBVS Structure Based Virtual Screening
SDF Standard File Format
SNN Spiking Neural Network
SQL Structured Query Language
SSC Snic Science Cloud
SVM Support Vector Machines
TCP Transductive Conformal Prediction
QSAR Quantitative Structure-Activity Relationship WSE Weak Scaling Efficiency
Chapter 1
Introduction
1.1
Big Data Analytics and Life Sciences: A Motivation
In the past decade, academic researchers and businesses have reached the point where they possess the capacity to produce massive amounts of data – this is be-cause of the major developments that have occurred both in the field of information technology and in the capabilities of scientific equipment. The massive sets of data that are now routinely being produced are commonly referred to as Big Data. In order to deal with these large datasets, new technologies – known as Big Data An-alytics – are being developed. These technologies are becoming prevalent, and have the advantage that they provide better insight into the inherent meaning of these vast amounts of data in less time and at a cheaper cost. This, in turn, improves the decision-making processes for people who depend on the data. Big Data Ana-lytics also make it possible to direct the relevant parts of the data (or the relevant portions of results from computations using the data) to the different groups of people who are only interested in using certain parts of the data – this is known as providing finer end user segregation, and saves time as users do not have to sift through the data to isolate the information that they need. In addition, Big Data Analytics make it easy to launch new and innovative tailor-made services for the end users of the data.
Big data is now prevalent in many different fields of the life sciences, for example as genomic data for DNA sequencing in the area of biomedical computing [157], in chemical libraries for drug discovery in the field of cheminformatics, as continuous neural data in neuroinformatics, and in patient historic health data in the health sciences. Just to give an idea of the large size of the datasets generated in these types of projects, the 1000 Genomes Project has produced more than 100 Terabytes(TB) [16] of data, and it is predicted that the 100K Genome project [1] will generate approximately 100 times more data. It is widely believed that the use of Big Data Analytics will enable us to make better decisions, and bring significant benefits (such as cheaper health care [32], appropriate personalised medical treatment [109]
and the prevention of drug related side effects [185]).
Today’s researchers are privileged to have extremely large sets of data to study in order to obtain a better understanding of the problems we face. The increas-ing volume, high dimensionality and structure of this data create novel challenges for researchers when it comes to processing and analysing the data [97]. High di-mensional data (high number of parameters in data) raises the challenges of noise aggregation e.g., it has been shown [95, 110] that due to noise aggregation, in higher dimensions, the classification rules performs no better than random guess. High dimensional data also creates false correlations between the response variable and the irrelevant parameters that can result in false inferences and wrong scientific conclusions [96]. High dimensionality combined with massive volumes of data gives rise to problems such as huge computational costs and algorithmic unpredictability. Other challenges that can arise are related to the diversity of the data, experimen-tal variations and statistical biases that are caused by the variations in data that comes from different sources and in different forms (such as text, images, audio, or video).
As the size of sets of data increases, more and more computational resources are required for storing and analysing the data. Furthermore, to support the storage and analysis of the data, a number of databases and software applications are needed [115]. Large volumes of data also give rise to other issues, the most common being scalability. (An algorithm is said to be scalable if it keeps performing well as the size of the system that it is applied to increases. As the volume of big data tends to keep growing, it is important to use scalable algorithms to handle the data.) Big datasets tend to display some general characteristics, such as the volume, velocity, veracity, variety and value of the data [183], and each of these characteristics can cause challenges in their own right. (The characteristics of big data are discussed further in Chapter 2.) With the recent developments in the life sciences and the consequent availability of many problems with extremely large datasets, the life sciences have become a data science field. Thus life sciences researchers face the same challenges as those that arise from the famous big data “v”s (i.e. volume, variety, velocity). Ultimately though the most important question is how we get value from big data by solving these challenges.
Often, massive datasets are produced continuously, and at a very fast rate, in real time e.g. the New York Stock Exchange captures 1 TB of trade data during each trading session, and hundreds of car sensors produce data continuously resulting in TBs of data being produced each hour. Such data needs to be processed in real time so that decisions, which depend on the data, can be made in real time (rather than requiring long periods of processing before decisions are made). The challenges that must be overcome to make this possible are quickly transferring data from where it is produced to where it will be processed (and without losing data during the transfer), analysing the data in real time while updating the algorithm in real time to incorporate all the newly produced data, and efficiently storing large quantities of data in limited memory for faster access. Applications exist in the life sciences where we need to process the data as soon as it is generated and provide results
1.1. BIG DATA ANALYTICS AND LIFE SCIENCES: A MOTIVATION 3
in real time e.g. the body area network (BAN) is a collection of wearable devices to monitor the health of a patient. These wearable devices usually consist of many sensors that collect current health data for the patient e.g. heart rate and body temperature. Combining and analysing such data in real time, when it is being generated at a rapid rate, is a tedious task and cannot be performed manually.
Large quantities of data that is heterogeneous and unstructured cannot be effi-ciently manipulated by conventional relational databases. Conventional data min-ing techniques, which have been successfully used by researchers previously, are not good for tackling large datasets either. Similarly, in the life sciences, the processes that are being investigated are very complicated due to their nature, and therefore the resulting datasets are also inherently complex, diverse and unstructured [161]. This aspect of the nature of life sciences data acts as the greatest obstacle to us obtaining value from the data, for example by mining new knowledge and making scientific discoveries.
To this end, different parallel programming frameworks have been implemented that enable us to solve these big data problems in parallel – such as MapReduce [81], Google File System [105], Big Table [74], Dremel [159], Pregel [154], and their open-source alternatives like Hadoop Ecosystem [61], Mesos [117] and Spark [235]. These frameworks have been widely and successfully adopted in business, however, these tools have not yet been adopted by the eScience research communities and hence the applicability of these tools in life sciences problems is not yet completely understood.
Such frameworks also include parallel machine learning (ML) algorithm imple-mentations to bring the hidden value out of big data, which has not been possible to date with conventional data mining techniques. ML algorithms have been available for decades but most of them were implemented to work only in serial. Even if some of the algorithms were developed for parallel use, such large datasets have never been available previously and consequently the issues related to large datasets were unknown. Therefore, it is necessary to either build new algorithms from scratch that can handle large datasets, or to use algorithms that are already available but with novel strategies to make it possible to solve big data problems.
In this thesis, I present standards, algorithms, novel strategies and software im-plementations for several large dataset problems in the field of life sciences. Most of the work is centred on applying the latest Big Data Analytics frameworks for cre-ating efficient virtual screening strategies for large datasets. The work also includes the development of a web service for creating Predicted Target profiles of multiple compounds against a list of targets. A method for analysing large quantities of Electroencephalography (EEG) data in real time was also implemented.
On the basis of the challenges that have been discussed and the potential of Big Data Analytics frameworks, the motivation of this thesis is to fulfil the following goals.
• Investigating the ongoing research in the area of eScience adoption of next-generation Big Data Analytics methods
• Increasing the efficiency and usefulness of the existing programming models to meet the needs of life sciences researchers
• Investigating the applicability and scalability performance of Spark, a next-generation Big Data Analytics framework, when applied to large-scale life sciences problems
• Adapting previously well-known techniques for large dataset problems using Spark
1.2
Research Questions and Thesis Contributions
The main aim of the thesis is to create efficient methodologies for analysing large datasets in life sciences problems using Spark in a scalable manner on commodity computing resources. This is important because it enables life sciences researchers to derive knowledge from large datasets with ease and much more rapidly, thus re-ducing the time and costs involved in the processes. Today, the majority of the life sciences problems use high performance computing (HPC). This research demon-strates that Big Data Analytics for some problems are useful, has advantages, or is an alternative to HPC. It is important because small and medium-sized organiza-tions often cannot afford expensive HPC resources of their own so they can instead use these methodologies on commodity computing resources. The major research questions (Q1, Q2 and Q3) addressed in this thesis are outlined here, along with the significant contributions (C1, C2 and C3) that are the basis of the thesis.
• Q1: How can the next-generation Big Data Analytics methods be adopted in life sciences problems and provide ready-made solution for large-scale prob-lems with better resource utilization and speed-up?
• Q2: How can the efficiency of Big Data Analytics methods in life sciences be further increased using machine learning methods and how can intelligent end user tools based on them be provided?
• Q3: How can the efficiency of real-time stream analysis in life sciences prob-lems be improved in an online learning setting?
• C1: Our first contribution of the thesis is the evaluation of Spark as a scal-able tool for virtual screening, a technique in cheminformatics used for Drug discovery by searching large libraries of molecule structures and decreasing the overall execution time through data parallelism. In the first part of the contribution, we performed ligand-based virtual screening (LBVS) i.e. using Quantitative Structure-Activity Relationship (QSAR) models with molecular signatures and SVM. We showed how Spark and HDFS could be used in com-bination with ML algorithms e.g. to distribute and analyse data with SVM in parallel, providing a satisfactory scaling behaviour and efficiency. While
1.3. LIST OF SCIENTIFIC PUBLICATIONS 5
traditionally SVM based applications are implemented in MPI, we showed that MapReduce is a viable alternative that opens the path for efficient ex-ploitation of large-scale public cloud infrastructures for virtual screening. In the second part of the contribution, we performed large-scale structure based virtual screening (SBVS) i.e. with molecular docking. We also created a new parallel virtual screening pipeline that provides a ready-made tool to the cheminformatics community to perform large-scale virtual screening efficiently (chapter 4). Previously these tools have not been used by the cheminformat-ics community and as such, with this work, we showed a new faster scalable method for virtual screening to the community. The resulting publications from this contribution are [38, 153].
• C2: The second contribution is a new conformal prediction based, a further improved, iterative virtual screening method that provides the results with similar accuracy to previous methods but in a much shorter time. The docking step in virtual screening is time consuming due to the large size of molecule libraries. Conformal prediction along with SVM allows us to confidently fil-ter out the poor candidates and thus only lead-like molecules are docked. On top of this, we also provided a web service for computing target profiles for Novel Chemical Entities (NCE), docking against a battery of targets where 3D Structures are available. The novel part in developing these target profiles is that they are based on docking scores of molecules docked rather than the ligand-target binding values from the binding databases. This helps life scien-tists to compute structure-based target predictions. These target predictions can be used to predict off-target effects, for example in early stages in drug discovery projects. The service is implemented in a web application frame-work play2.0 and deployed as a microservice on OpenShift Origin (chapter 5). The outcome publications from this contribution are [40, 37].
• C3: The third contribution is a parallel lightweight method for epileptic seizure detection in large EEG data as real-time streams. In this contribution, we have provided methods for solving challenges of fitting large datasets in memory and quickly adding the newly produced data to the online predictive model without any data loss. In an experimental scenario, our lightweight algorithm was able to detect seizures in real time with low latency and with good overall seizure detection rate. Also, we have introduced a new feature, “top-k amplitude measure” for data reduction. On the basis of the results, we believe this method can be useful in clinics for epileptic patients (chapter 6). The resulting publication from this work is [39].
1.3
List of Scientific Publications
This thesis is based on the following publications; the papers are referred in the body of the thesis by their Roman numerals.
Paper I: Using Iterative MapReduce for Parallel Virtual Screen-ing
Laeeq Ahmed, Ake Edlund, Erwin Laure and Ola Spjuth In Cloud Computing Technology and Science (CloudCom), 2013 IEEE 5th International Conference on (Vol. 2, pp. 27-32)
Author’s contributions: I am the main author. I par-tially contributed to developing the concept underlying the paper and I contributed fully to implementing it.
Paper II: Large-scale virtual screening on public cloud resources with Apache Spark
Marco Capuccini, Laeeq Ahmed, Wesley Schaal, Erwin Laure and Ola Spjuth
Journal of cheminformatics, 9(1), 15.
Author’s contributions: I am the second author. I par-tially contributed to developing the concept underlying the paper and I contributed partially to implementing it.
Paper III: Efficient iterative virtual screening with Apache Spark and conformal prediction
Laeeq Ahmed, Valentin Georgiev, Marco Capuccini, Salman Toor, Wesley Schaal, Erwin Laure and Ola Spjuth
Journal of cheminformatics, 10(1), 8.
Author’s contributions: I am the main author. I par-tially contributed to developing the concept underlying the paper and I contributed fully to implementing it.
Paper IV: Predicting Target Profiles with Confidence as a Ser-vice using Docking Scores
Laeeq Ahmed, Hiba Alogheli, Staffan Arvidsson, Arvid Berg, Jonathan Alvarsson, Wesley Schaal, Erwin Laure and Ola Spjuth
Manuscript sent to peer reviewed journal
Author’s contributions: I am the main author. I par-tially contributed to developing the concept underlying the paper and I contributed fully to implementing it.
Paper V: Parallel Real Time Seizure Detection in Large EEG Data
Laeeq Ahmed, Ake Edlund, Erwin Laure, and Stephen Whit-marsh
1.4. THESIS OVERVIEW 7
In Proceedings of the International Conference on Internet of Things and Big Data, 214-222, 2016, Rome, Italy
Author’s contributions: I am the main author. I fully contributed to paper idea and implementation.
Figure 1.1: Thesis Overview
1.4
Thesis Overview
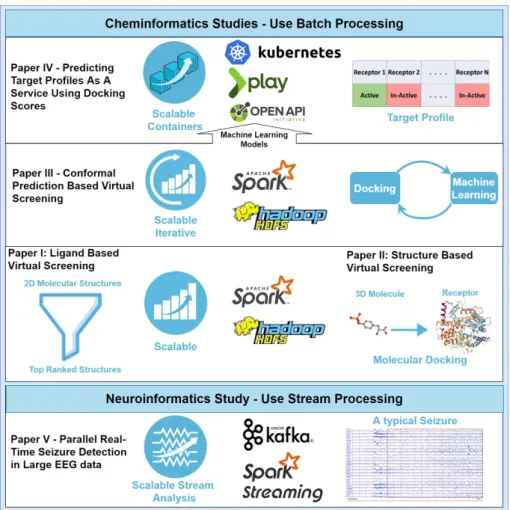
Figure 1.1 gives an overview of the thesis. In Paper I, I performed a ligand-based virtual screening to filter out molecules using machine learning models in a scalable
manner using Spark. In Paper II, I presented a structure-based virtual screening method that involves molecular docking in a parallel manner using Spark. Adding on to these two parallel methods, I presented an iterative conformal-prediction based virtual screening strategy in Paper III to make the process more efficient by docking and building machine learning models iteratively. In Paper IV, I utilized these machine learning models and presented a web service for predicting target profiles by deploying multiple models in a containerized environment on top of Openshift origin, an open-source Kubernetes distribution. In Paper V, I presented a study for seizure detection in real-time large EEG data in a streaming manner using Kafka and Spark.
Chapter 2 gives a detailed overview of the theory and the technologies used in the thesis. Chapter 3 summarises relevant work that has been done by other researchers in the area of Big Data Analytics in the life sciences. Chapter 4 provides details about Paper I and Paper II. Chapter 5 covers Paper III and Paper IV. Chapter 6 contains details about Paper V. Chapter 7 discusses the impact and implications of scalable analysis of large datasets in life sciences from a broader perspective. Finally, chapter 8 presents the conclusions from the research in this thesis and proposes future work to extend this research.
Chapter 2
Background
2.1
Big Data
Over the last two decades, we have seen increasing amounts of data being produced in almost all areas of business and academic research. The data comes from many different sources, such as hundreds of sensors attached to commodity electronic devices and wearable devices, social media, the financial sector, health records, online transactions, search queries, click streams, and scientific machinery [183]. The resulting large datasets, which have not been available previously, open up new insights into their associated domains. Now businesses can make better decisions or offer precise personalized deals, and researchers can make more reliable predictions. The potential of big data can be measured by the investments made by governments and major technological companies. In 2012, the US government announced a 200 million dollar big data initiative [226]. Recently, Walmart has announced that they will be building the largest private cloud to process 2.5 petabytes of data every hour [51]. However, it is important to remember that the benefits which can be derived from the information in these large datasets can only be realised when we properly understand both the characteristics of such data and the challenges related to these characteristics.
2.1.1
Big Data Characteristics
Big data has five main characteristics known as the five “v”s of big data.
• Volume refers to the huge size of the big datasets that are being produced every moment. These datasets are now measured in zetabytes, or even yot-tabytes, where previously data volumes were typically being measured in gi-gabytes. Internet companies are playing a major part in producing this data, e.g. Twitter published more than 500 million tweets per day in August 2013 and currently 6000 tweets are published every second [29].
• Velocity refers to the rate at which these large datasets are being produced and the speed at which this data has to be processed in order to make real-time decisions, e.g. trading systems can analyse the senreal-timents expressed in social media data to give indications to either buy or sell shares [98]. • Veracity refers to the level of trustworthiness and appropriateness of the
information in the big datasets. Tweets that contain typing mistakes and hash tags are one example of data with a low level of veracity. As another example, in 2016, Microsoft had to take their Tay.io chatbot [141] down as it had been trained on Twitter tweets that transformed it from an innocent chatbot to one expressing racist opinions.
• Variety means that different types of data are being produced and included in the big datasets. The types of data range from metadata-like XML files to images and video files. The datasets that include these different types of data are consequently complex and unstructured in nature. Previously datasets used to be structured e.g. in sales management systems, data used to be stored in relational databases. Since big datasets are unstructured in nature, it is not easy to process and store the datasets, and hence new technologies are needed.
• Value is the most important characteristic of big data and refers to the benefits arising from the discoveries that can be made by analysing these large datasets. Big data is changing the paradigm of information management by giving new insights, and demonstrating new patterns detected from the data, and thus providing value to businesses and researchers, as well as people in other walks of life.
2.1.2
Big Data Processing Frameworks
Based on the characteristics discussed in Section 2.1.1, big data is classified into different categories, each of which has specific programming requirements associated with it. The following are the big data processing framework categories and the most well known technologies for handling each of the categories of data.
• Batch Processing Systems - Batch processing is the most general form of big data processing. Google is considered to be the pioneer of big data technologies. They presented their famous Google MapReduce (GMR) paper [81] in 2005. The idea was to have two functions, Map and Reduce. Opera-tions like filtering/sorting could be performed with the Map function, while Reduce would be used to summarize the output from Map. The Map and Reduce functions were already present in functional programming languages but had never been used before with large datasets in a distributed environ-ment on commodity servers. Google, at that time, had rather straightforward problems – in particular they needed to search for specific data in crawled
2.1. BIG DATA 11
documents. The major challenge they faced was writing complex code for the parallelization of the computations, especially for handling failures. The GMR approach not only solved Google’s basic problems, such as searching for data, but it also made parallelization, fault-tolerance, data distribution and load balancing transparent.
Hadoop [61] is an open-source implementation of GMR, implemented in Java, which provides similar functionality to GMR, i.e. distributed processing of large datasets on commodity servers with scalability, high availability and automatic fault tolerance.
GMR and Hadoop, being distributed processing systems, need to have data stored in a distributed manner. The Google File system (GFS) [105] and Hadoop distributed file system (HDFS) [195] are distributed file systems used by GMR and Hadoop respectively. Other than storing large datasets in a distributed manner, saving on I/O operations is the main advantage they offer. Once the data is stored, it does not need to be moved around and can be processed directly at the location where it is stored by the relevant processing model.
Figure 2.1: Processing Elements in a Stream Processing Engine
• Stream Processing Systems - Stream processing systems process contin-uous data as soon as it is generated. Examples of applications producing streaming data are patient vital signs monitoring, personal health devices, web traffic processing and forex trading.
Stream is a sequence of events or tuples [49] made available continuously over time in the form (a1, a2, . . , an, t-1) (a1, a2, . . , an, t) (a1, a2, . . , an, t+1), where ai represents a characteristic and t denotes the time.
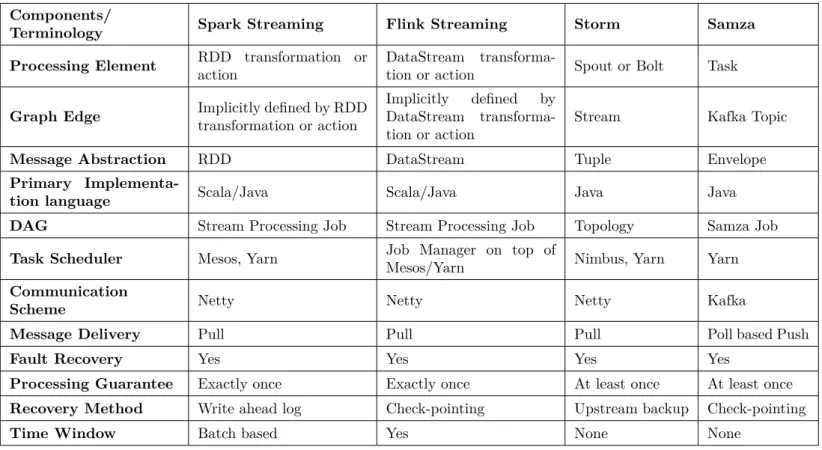
Stream Processing engine creates a logical network of processing elements (PEs) connected in a Directed Acyclic Graph (DAG) as shown in Figure 2.1. A processing element is a processing unit in a stream processing engine. PEs run in parallel, independently and asynchronously, and communicate between themselves through messages. The output from a PE can be one single tuple, single tuples produced after regular intervals, or nothing at all. Aurora [34], Borealis [33], SPADE [104] and StreamIt [209] are examples of ini-tial event stream processing systems. More recent distributed map-streaming processing systems are Apache Storm [47], Apache S4 [5], Apache Samza [6], Spark Streaming [236] and Twitter’s Heron [140]. Azure Stream Analytics [8], Google MillWheel [44] and Amazon Kinesis [2] are some of the commercially available stream processing systems. Table 2.1 gives a comparison of some of the open-source stream processing systems.
• Hybrid Systems - Hybrid systems provide multiple data analysis facilities in a single stack. Such systems are preferred because the users do not have to care about various tools e.g. both batch and streaming jobs can be performed in the same system. Apache Spark [235] and Apache Flink [70] are two promi-nent general-purpose Big Data Analytics systems. Apart from batch process-ing and streamprocess-ing, they possess SQL-like expression languages (Spark: Spark SQL, Flink: Table), distributed graph processing (Spark: GraphX, Flink: Gelly) and ML libraries (Spark: MLlib, Flink: FlinkML). Both frameworks provide support for implementing iterative algorithms while keeping the data in memory and thus give faster convergence of iterative ML algorithms. Spark has been widely used in this thesis and a separate overview of the system is given in 2.2.
2.2
Apache Spark
Apache Spark [235] is a parallel programming and execution framework for cluster computing that is fast and easy to use. In terms of speed, it’s much faster than well-known Google MapReduce [81] and its famous open-source implementation, Apache Hadoop [61]. One Reason for its agility is keeping the data in-memory with support for iterative processing. Even if the data doesn’t entirely fits into memory, it can spills out extra data to disk.
Before Spark, different distributed systems that included interactive queries, batch applications, iterative algorithms and streaming had to be managed using separate tools. For example, Hadoop had Hive for SQL processing, and there were Mahout for ML and Apache Tez for interactive and batch processing, but all of these came as separate tools and had to be unified by the user to make up a complete analysis pipeline. In contrast Spark comes with a complete Big Data Analytics stack, which includes Spark SQL for SQL processing, Spark Streaming for real-time processing, MLlib for ML, and GraphX for graph processing, all in a single
Table 2.1: Comparison of Stream Processing Systems Components/
Terminology Spark Streaming Flink Streaming Storm Samza
Processing Element RDD transformation or action
DataStream
transforma-tion or actransforma-tion Spout or Bolt Task
Graph Edge Implicitly defined by RDD
transformation or action
Implicitly defined by DataStream transforma-tion or actransforma-tion
Stream Kafka Topic
Message Abstraction RDD DataStream Tuple Envelope
Primary
Implementa-tion language Scala/Java Scala/Java Java Java
DAG Stream Processing Job Stream Processing Job Topology Samza Job
Task Scheduler Mesos, Yarn Job Manager on top of
Mesos/Yarn Nimbus, Yarn Yarn
Communication
Scheme Netty Netty Netty Kafka
Message Delivery Pull Pull Pull Poll based Push
Fault Recovery Yes Yes Yes Yes
Processing Guarantee Exactly once Exactly once At least once At least once
Recovery Method Write ahead log Check-pointing Upstream backup Check-pointing
unified package. Furthermore, Spark has a much larger API than Hadoop (which only had the map and reduce functions). Spark applications can be implemented on local machines and later run remotely on a larger cluster in a similar fashion. These facilities make Spark a more general-purpose framework for massive parallel processing.
To use Spark, the user writes a driver program that controls the overall flow of the program. The driver program contains some Spark constructs and paral-lel operations on these constructs. Resilient distributed datasets (RDDs) are the main programing construct of Spark. RDDs are a collection of datasets partitioned across the cluster that can be manipulated in parallel by applying different opera-tions available in the Spark API. Two types of operaopera-tions can be applied on RDDs, namely transformations and actions. Transformations are operations that, when applied to datasets, produce new datasets. As an example, RDD.filter filters the existing dataset on the basis of specified criteria and produces a new dataset. In contrast, when Actions are applied to datasets, they produce results that are re-turned to the driver program, e.g. RDD.count returns the number of elements in the RDD.
Spark’s other advantage over Hadoop is its resource-saving fault tolerance. RDDs remember all their previous transformations, thereby creating a lineage. If one of the partitions of an RDD is lost, it can restore itself by transformation back-ward through the lineage. The method saves on I/O in comparison to other fault tolerance approaches, such as the replication used by Hadoop.
As well as normal variables, Spark provides support for shared variables. In clustered environments, each node normally has a separate copy of each variable but, in some cases, shared variables are needed. There are two types of shared variables: broadcast variables and accumulators. Broadcast variables can be used when we need to share a large read-only file on all nodes, rather than sending a copy of it with the associated tasks. Accumulators are used when we need to implement shared counters for parallel sums.
2.2.1
Spark Streaming
Spark Streaming [236] is a component of the Spark Big Data Analytics stack for real-time applications. Traditional distributed stream processing systems provided fault tolerance either through replication or upstream backup. The replication approach required double the amount of hardware resources, and the upstream backup was slow because the whole system had to wait for a new machine in the case of a machine failure. Spark introduced the D-Stream programming model to overcome these problems.
D-Streams consider streaming computations into sequences of deterministic batch computations over small time intervals. The input for each interval is stored across the cluster. At the end of a particular time interval, parallel operations (like map, reduce and groupby) are performed on the input datasets to produce interme-diate or output representations. RDDs are used to store these datasets on clusters.
2.3. CLOUD COMPUTING 15
With RDDs able to regenerate themselves from their lineage, the conventional fault tolerance (i.e., replication) is not required.
D-Streams also have the advantage of unifying streams with batch processing and provide a fault tolerance strategy similar to that of batch systems but at a low cost.
2.3
Cloud Computing
While considering cloud computing, we need to understand the characteristics of cloud computing, the services provided by clouds, the service provisioning tech-niques for clouds and the personnel involved in using these services.
2.3.1
Definition
Various definitions of cloud computing exist. NIST [158] provides a comprehensive definition of cloud computing as follows.
“Cloud computing is a model for enabling ubiquitous, convenient, on-demand network access to a shared pool of configurable computing resources (e.g., networks, servers, storage, applications, and services) that can be rapidly provisioned and released with minimal management effort or service provider interaction. This cloud model is composed of five essential characteristics, three service models, and four deployment models.”
2.3.1.1 Essential Characteristics
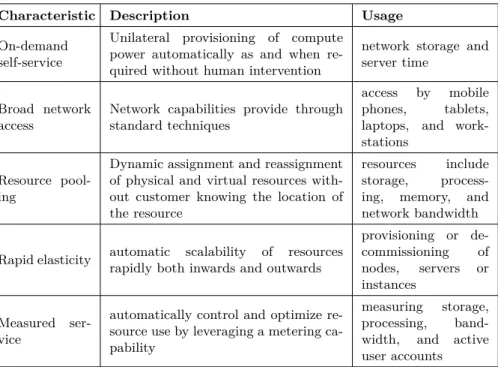
The essential characteristics of cloud computing are shortly described in Table 2.2.
2.3.1.2 Service Models
Cloud services are divided into three major categories, namely Infrastructure as a Service (IaaS), Platform as a Service (PaaS) and Software as a Service (SaaS). The cloud services pyramid is shown in Figure 2.2.
• IaaS - IaaS is the most basic cloud service capability. It provides hardware infrastructures to the consumers e.g., virtual machines, storage, processing and network services. IaaS layers abstract the details of the hardware in-frastructure from the consumers e.g., location, scaling and data partitioning. Some examples of IaaS are Cisco MetaCloud1, Microsoft Azure2, Amazon
Elastic Cloud (EC2)3 and Google Compute Engine4.
1http://www.cisco.com/c/en/us/products/cloud-systems-management/metacloud/index.html 2https://azure.microsoft.com/
3https://aws.amazon.com/ec2/ 4https://cloud.google.com/compute/
Table 2.2: Characteristics of Cloud Computing
Characteristic Description Usage
On-demand self-service
Unilateral provisioning of compute power automatically as and when re-quired without human intervention
network storage and server time
Broad network access
Network capabilities provide through standard techniques
access by mobile phones, tablets, laptops, and work-stations
Resource pool-ing
Dynamic assignment and reassignment of physical and virtual resources with-out customer knowing the location of the resource
resources include storage, process-ing, memory, and network bandwidth
Rapid elasticity automatic scalability of resources rapidly both inwards and outwards
provisioning or de-commissioning of nodes, servers or instances Measured ser-vice
automatically control and optimize re-source use by leveraging a metering ca-pability
measuring storage, processing, band-width, and active user accounts
• PaaS- PaaS provides users with the capability to deploy operating systems and applications on top of the cloud infrastructure in an isolated environment, called a container. The end user only controls the deployed applications, and maybe the configuration settings for the containers, but not the underlying hardware. Examples of PaaS are Aprenda5, Google App Engine6and Amazon Beanstalk7.
• SaaS- SaaS refers to the capability to run consumer applications on the provisioned hardware. The applications can be accessed through either a thin client or a program interface. Examples of SaaS are Workday8, Salesforce
Customer Relationship Management (CRM)9and Google GSuite10.
5https://apprenda.com/ 6https://cloud.google.com/appengine/ 7https://aws.amazon.com/elasticbeanstalk/ 8https://www.workday.com/ 9https://www.salesforce.com/crm/ 10https://gsuite.google.com/
2.3. CLOUD COMPUTING 17
Figure 2.2: Cloud computing services pyramid
2.3.1.3 Deployment Models
Cloud services are provided to the end users in the form of various cloud deployment models: [158] private cloud, community cloud, public cloud and hybrid cloud.
• Private Cloud - The private cloud is available for exclusive use by a single organization and may be used by multiple divisions within that organization. The cloud infrastructure may be owned by same organization, a third party or a combination of both and may be located at or away from the premises of the cloud consumer.
• Community Cloud- The community cloud is available for exclusive use by the members of a community with similar goals/interests. The cloud may be owned and operated by one or more organizations in the community, a third party or a combination of them and may be located at or away from the premises of the cloud consumer.
• Public Cloud- The public cloud is provided for use by general public. The cloud may be owned by businesses, academic or governmental organizations, or a combination of these, and located on the premises of the cloud provider. • Hybrid Cloud- The hybrid cloud is a combination of two or more different cloud infrastructures i.e. private, public or community infrastructures. The hybrid cloud is a “fit for purpose” approach, i.e. it is designed to be the right solution for the current job and depends on the needs of the users. Hybrid cloud technology offers communication between the combined cloud infrastructures, as well as portability of applications and data between the independent cloud infrastructures that make up the service.
2.4
Microservices
Microservices is a style of software architecture inspired by service-oriented soft-ware framework that arranges an application as a set of loosely coupled services [84]. The core idea is to provide better modularity and independent execution of services. Although mainstream languages like Java, C++ and python provides some modularity through constructs like classes and methods, they create a single executable software known as a monolith. The modules in a monolithic architecture share the resources of a machine, hence they cannot execute independently.
Contrary, microservices are structured as a collection of multiple small cohesive services that execute independently. Each service is self-contained and implements a single functionality. The services communicate among them through stateless messages where each pair of request and response is an independent transaction. Microservices have many advantages. They are easy to develop and maintain in autonomous, cross-functional teams with increased productivity and speed.
2.4.1
Deploying Microservices
Previously, the microservices were hard to deploy, but the advent of containerized environments and container orchestration has made it easier and given rise to the microservices architecture.
2.4.1.1 Docker Containers
A Docker container [224] image is a standalone, lightweight, executable package of software that contains all the dependencies required to execute an application: code, runtime, system libraries, system tools and settings. At runtime, the Docker images transform into Docker containers and run on Docker Engine. Docker con-tainers are available for both Windows and Linux machines and regardless of the type of infrastructure, Docker containers will run the same and provide the same functionality.
2.4.1.2 Kubernetes
Kubernetes is an open-source orchestration tool for deploying containerized appli-cations [116]. In today’s world of internet, most software appliappli-cations functions in a distributed way and need to be reliable and highly scalable. Kubernetes is the tool that provides functionality needed to build and deploy such reliable, scalable dis-tributed applications. Kubenetes provides self-healing for reliability: a container is restarted on failure, containers are replaced and rescheduled if a node dies, a container is killed if it does not respond and then restarted. Kubernetes can easily scale applications up or down on need. Scaling can be done by either a manual request by a user or automatically based on the CPU usage.
2.5. MACHINE LEARNING AND BIG DATA ANALYTICS 19
2.5
Machine Learning and Big Data Analytics
Machine learning (ML) is a type of data analysis that makes computers learn and find hidden value in data without being explicitly programmed to do so – this is done by automating the process of analytical model building. Currently ML is playing a key role in providing insights and extracting value from large datasets. However, without access to large datasets, ML may not be of much use because the machine learning process requires a lot of training data. Thus using ML and big data together can benefit researchers and businesses by bringing forth the value hidden in the data.
2.5.1
Types of Learning
Depending upon the type and level of training data and the method by which the training data becomes available, two ML types exist: supervised learning and unsupervised learning.
2.5.1.1 Supervised Learning
In supervised learning, labelled training data is available to the model. The labelled data includes the input object and the relevant output value, commonly known as the label. Once the model is trained using the labelled data, it makes predictions on all the unseen examples [113]. This is the most common approach used in classification, regression and ranking algorithms.
• Classification - In classification, the unseen examples are divided into two or more classes using a model trained on data that has already been categorized and labelled into two or more classes. An algorithm that performs classifi-cation is generally known as a classifier and refers to a function that learns a mapping from input x to output y [165]. An example of a classification problem is spam filtering, where the classifier aims to separate spam email from the rest of the email. Another example is tumour classification which seeks to accurately classify tumours as malignant(cancerous) or benign(non-cancerous).
• Regression- In regression, the regression function learns a mapping from inputs x to a range of output variables y. The only difference, from clas-sification, is that a continuous response variable [165] y, rather than a fixed number of output classes, exists in the regression. Regression analysis helps to understand the dependence of the output variable y on the input variable(s) x. Examples of regression analysis are predicting the sale price of a house in a particular region, and predicting future currency trends based on current market conditions and other relevant information.
2.5.1.2 Unsupervised Learning
In unsupervised learning, labelled training is not available to the model and in-stead the model has to learn a function to predict the hidden structure of the data. Unsupervised learning solves the main problem of density estimation in statistics [131]. Commonly solved problems in unsupervised learning are clustering and di-mensionality reduction.
• Clustering- In clustering, the algorithm is provided with an unlabelled dataset and is supposed to automatically group the data into similar clusters. Two common goals in clustering problems are to find the existence of subpopula-tions in the data, and to estimate which cluster each data point belongs to. An example of clustering is grouping together consumers by their interests for e-commerce and sending them appropriate advertisements [58].
• Dimensionality Reduction- Processing high dimensional data is complex and expensive, therefore high dimensional data is generally converted to a lower dimensional subspace by decreasing the number of parameters that hold the character of the data. Two common approaches used for dimension-ality reduction are feature selection and feature extraction [151]. In feature selection, a subset of features is selected from the original features, whereas in feature generation, a new set of features is generated based on the original feature set by reducing data from the higher dimensional space to a lower level subspace.
2.5.2
Machine Learning Algorithms
Machine learning is a vast field and involves a range of algorithms. Here we present some of the most popular ML algorithms for the problems described in Section 2.5.1.
• Linear Regression- Linear regression is a supervised ML algorithm [165] that identifies the relationship between the input variable x and the real-valued output variable y. The form of the input variable is linear and the learned model is based on linear predictor functions. Hence the model is a linear model and the method is known as linear regression. The aim of the algorithm is to find a straight best-fitting line, known as a regression line, through the already known points and then to predict the value of the output variable based on this line.
• Logistic Regression- Unlike linear regression which is used for predicting continuous variables, logistic regression is commonly used for predicting dis-crete variables i.e. in classification problems [165]. For example, in a binary classification, we try to predict the probability that a given example belong to class “0” as against the probability that it belongs to class “1”.
2.5. MACHINE LEARNING AND BIG DATA ANALYTICS 21
• K-Means- K-means [112] is an unsupervised clustering algorithm. As a clustering algorithm, the aim is to form clusters based on similarities in the data. The K-means is an iterative algorithm and forms clusters using two steps during iterations by assigning each point to a cluster and then moving the cluster centroid. Consider a problem where we want to have two clusters. The algorithm selects two random points as cluster centroids. Each point is assigned to either cluster one or cluster two based on its distance from the cluster centroids. Then the centroid of each cluster is moved to the mean of the points that were assigned to that particular cluster. These two steps are performed iteratively until the assignment of each point does not change any more and until the centroids do not move any further, i.e. when the algorithm has fully converged.
• Support Vector Machines- SVMs are supervised ML algorithm developed by Cortes et. al. [78] for two-group classification problems, although they later became popular for solving other problems, like regression and novelty detection. An SVM includes a training algorithm that uses training examples, which are already marked as belonging to one class or the other, to build an SVM model that predicts which category the new examples should be assigned to. An SVM model represents training examples as points in space, dividing these examples into categories by a clear gap, which is as wide as possible. In addition to linear classification, SVM can also perform non-linear classification using the kernel trick originally proposed by Aizerman et. al. [43]. Most of the non-linear classification algorithm is the same as the linear SVM algorithms. The only difference is that a non-linear kernel function is used instead of every dot product, thus enabling the algorithm to fit the maximum-margin hyperplane in a transformed feature space.
• Random Forests- Random Forests are an ensemble ML method based on decision trees used for classification and regression problems. Decision trees tend to overfit and thus random forests are used to train multiple models, thereby removing overfitting. The algorithm computes and outputs the mode of all the classes in a classification. In the case of regression, it outputs the average of the individual predictions by each decision tree. Methods using random forests have shown good predictive accuracy [71] and have been successfully applied to many applications e.g. body pose recognition [194]. Some other widely used ML techniques are Matrix Factorization or SVD, Naïve Bayes and Artificial Neural Networks.
2.5.3
Conformal Prediction
Conformal Prediction is a framework that complements the prediction from an ML algorithm with a valid measure of confidence [217]. Conformal prediction can work in combination with almost any underlying regression or classification algorithm,
e.g., support vector machines, gradient boosting, neural networks, and random forests. In the case of classification models, conformal prediction produces a set of labels, e.g., in binary classification it produces four possible prediction sets {0}, {1}, {0, 1} and Ø (the empty set). Although the output is a region or multi-classed, rather than a point prediction, the main benefit of the technique is the validity of the model with a user-provided confidence threshold. For example, in a binary classifier the true positives are not excluded more than the confidence threshold on average, e.g., if the confidence level is 90%, then in only 10% of the cases will the true positives be excluded.
2.5.3.1 Inductive Conformal Prediction
A common set-up for conformal prediction is the transductive conformal prediction approach (TCP). In TCP, the model is retrained for each new observation. However, this is computationally quite expensive, especially for problems with large datasets, and therefore an inductive or batch setting, called Inductive Conformal Prediction (ICP) [174], has become popular.
The way that ICP works in a classification setting is quite simple. Firstly, a training set and a test set of examples with labels are required. The training set is divided into a proper training set and a calibration set. The training set is employed to train a model using any underlying algorithm. The calibration set is then used to measure a nonconformity score for each observation in the calibration set, which is a measure of “how different the current example is compared to the training set”. The model then produces predictions for the examples in the test set, and, for each class label l = 1, . . . , k, a p-value of x for class l is computed. If the p-value for the class label l is greater than ε, then that label is added to the prediction set. Using this approach, it is guaranteed that on average the true label of x will be present in the prediction set with probability 1-ε [174].
2.5.4
Machine Learning Libraries for Big Data Analytics
Most of the batch processing systems and hybrid systems discussed in Section 2.1.2 include scalable ML libraries. An overview of these libraries is given in Table 2.3. Additional miscellaneous ML algorithms (such as feature extraction and optimiza-tion) are available in the libraries mentioned in the Table.
• Apache Mahout- Apache Mahout [4] is part of the Hadoop Ecosystem and initially only included ML algorithms for MapReduce. Later the algorithms were optimized for Spark, H2O and Flink. The ML algorithms that are
available in Mahout are collaborative filtering, classification, clustering, di-mensionality reduction and some miscellaneous algorithms which are mostly deprecated. The algorithms available in Mahout scale well with the increas-ing size of data [188]. One commonly reported characteristic of Mahout ML algorithms is extensibility. [144, 111] reports successful add-ons using Mahout algorithms as the baseline.
2.5. MACHINE LEARNING AND BIG DATA ANALYTICS 23
Table 2.3: Overview of Machine Learning Libraries and Available Algorithms
Mahout MLlib FlinkML
Programming Languages Java Java, Scala, Python
Java, Scala Supported Processing Framework
MapReduce, Spark, H2O,
Flink
Spark, H2O Flink
Version 0.13.0 2.2.0 1.3.2
Classification and Regression Algorithms Linear Regression
-Logistic Regression
-Naive Bayes
-Hidden Markov Models -
-Linear SVM
-Random Forests -
-Gredient Bosted Trees -
-Ridge Regression -
-Isotonic Regression -
-k-Nearest neighbors join - -Clustering Canopy Clustering - -K-Means Clustering -Fuzzy K-Means - -Streamng K-Means - -Spectral Clustering -
-Latent Dirichlet allocation -
-Bisecting k-means -
-Gaussian Mixture Model -
-Dimensionality Reduction
Singular Value Decomposition
-Lanczos Algorithm -
-Stochastic SVD -
-Principal component analysis
-QR Decomposition -
-Collaborative Filtering
User-Based Collaborative Filtering -Item-Based Collaborative Filtering -Matrix Factorization with ALS
Matrix Factorization with ALS on
Implicit Feedback
-• MLlib- MLlib [160] is part of the Spark Big Data Analytics stack and includes many ML algorithms, such as classification, regression, clustering and collab-orative filtering, along with useful tools such as featurization, ML pipelines, statistics and linear algebra utilities. MLlib is an open-source project and has a rapidly growing community of developers. It has been successfully used for various parallel ML projects, e.g., Capuccini et al. [68] presents an MLlib-based distributed conformal prediction implementation for valid confidence estimation for large dataset problems and shows the validity and scalability of the algorithms using two large datasets.
• FlinkML- FlinkML [11] is an effort from the Apache Flink developer com-munity. The goal of the library is to support developers to build scalable ML systems with minimum effort by utilizing the ETL capabilities already extant in the Apache Flink Ecosystem, thus creating ML pipelines without the need for external tools. FlinkML contains basic ML algorithms and utilities e.g., distance matrix and cross validation.
The following more specific Scalable ML libraries also exist.
• SAMOA- Apache Samoa [164] is a distributed streaming ML framework. Unlike the previous three systems, it does not contain a generic distributed stream processing framework and only concentrates on the ML Streaming Al-gorithms. The goal is to have an uncoupled distributed streaming ML frame-work that can run on any of the distributed stream processing engines (like Spark Streaming, S4, Storm and Samza) without handling the complexity of the underlying stream processing frameworks. Samoa allows developers to im-plement the algorithms once and execute them on any distributed streaming framework.
• TensorFlow- TensorFlow [35] is an open-source ML library from Google which utilizes data flow graphs for modelling. The graph node performs mathematical operations whereas the edges are multidimensional arrays of data i.e. tensors that flow in between operations. With TensorFlow, it is rather easy to implement, train and deploy neural network models that scale up from mobile devices to multiple servers, which is especially useful for large dataset problems. The scaling and distribution is made possible by the ability of TensorFlow to perform partial subgraph computations i.e. the partitioning of neural networks.
2.6
Cheminformatics
Computer technology has been utilized by chemists for a long time, but it was only recently in the 1990s that the term cheminformatics or chemoinformatics emerged. The first formal definition of cheminformatics [66] was given by F.K.Brown in 1998 as follows: