Scienpress Ltd, 2012
Bathymetry and Sediment survey for two old water
harvesting schemes, Jordan
Nadhir Al-Ansari 1, Ali Alroubai 2and Sven Knutsson 3
Abstract
Jordan is among the least countries in its water resources and about 85% of its area is desertic. Due to this reason the inhabitants of the Badia region used centuries ago water harvesting techniques to augment water for human and animal use. Two ancient water harvesting schemes (Burqu and Dier Al-Kahf) were investigated. Bathymetric survey was conducted and both bottom and water samples were collected to study the nature of sediments in these schemes. The calculated volume of Burqu and Deir Al-Kahf reservoirs were 629505 and 12071m³ respectively. Sediments entering these reservoirs are mainly fine sand derived from the main and side valleys entering the reservoirs during rain events. The sediments at Burqu reservoir have a mean grain size of 0.1 mm, very poorly sorted and negatively skewed. The sand: silt: clay ratios were 70:17:13 respectively. At Deir Al-Kahf reservoir, the sediment mean grain size was 0.11mm and they were very poorly sorted and they were finely skewed. The sand: silt: clay ratios were 69: 23: 8 respectively. Annual rates of sediments deposited in these reservoirs were 29016 m3 for Burqu and 29016 m3 for Deir Al-Kahaf.
Keywords: Water harvesting, Badia, Jordan, Burqu, Deir Al-Kahf
1 Department of Civil, Environmental and Natural Resources Engineering
Lulea University of Technology, Sweden, e-mail:nadhir@ltu.se 2
Basrah University,Iraq,e-mail:Ali.Alyoubai@yahoo.com 3
Department of Civil, Environmental and Natural Resources Engineering Lulea University of Technology, Sweden, e-mail:Sven.Knutsson@ltu.se
1 Introduction
Jordan is located in the Middle East. It seems to be among the least blessed with respect to water availability in the Middle East. It is currently experiencing a fast rate of development, urbanization and population growth as a result it is currently using or overusing all of its annual renewable fresh water resources. In addition, a significant amount of Jordan’s water resources flows as international water to the Yarmouk and Jordan rivers and to groundwater resources divided between neighbouring countries. These countries have recently invested in over-ambitious development programmes to attain self-sufficiency in agricultural products adding to Jordan's water problems. (Baban and Al-Ansari, 2001) [1].
The Badia Region covers an area of approximately 72,600 km2, which constitutes 85 per cent of the total area (89,400 km2). The Badia is around 85% of the total area of Jordan but occupied by only 5% of the population. Hence, it is nationally considered to be the resource depth for the country. The 15% of the total area of the country (urban areas) are not able anymore to absorb the expanding population. Therefore, people have started to move to the Badia. This area is very poor in its surface water resources. Due to this fact, the inhabitants of the Badia region used water harvesting techniques long time ago to augment water (Baban and Al-Ansari, 2001) [1]. This practice is very common in arid and semi-arid regions (Oweiss et.al. 2012) [2].
The Badia region falls in an arid climatic zone. Rainfall is erratic both spatially and temporally, with a maximum of 200 mm annually. Air temperature fluctuates widely from a daily mean minimum of 10°C, mean maximum of 24.5°C and a mean daily temperature of 17.5°C. In few instances absolute minimum and maximum temperatures might reach -5°C and 46°C respectively (Garber and Salameh, 1992 [3], Al-Ansari and Baban, 2001) [4]. Since long time ago, people of the Badia realized the importance of the water harvesting in the arid lands. They used the harvesting system to get water. The ancient water harvesting system spread all over the Badia and they are varying in size and design. Among these old schemes are Burqu and Deir Al-Kahf schemes (Fig. 1, 2, and 3).
Burqu area dates back to 700AD and it is well known for its castle (Fig 2). The dam, which is about 375m long, was built in 1970 (Fig. 2). Deir Al-Kahf dam is only 57m long. It was built during the 4th century.
Figure 1: Location map of Deir Al-Kahf and Burqu.
Fig. 2: Burqu reservoir
Fig. 3: Deir Al-Kahf reservoir
The reservoirs of these dams are very important in supplying water for local inhabitants and they are also very important for migrating birds where large number of birds reside in these areas when they migrate.
2 Field work
2.1 Bathymetry
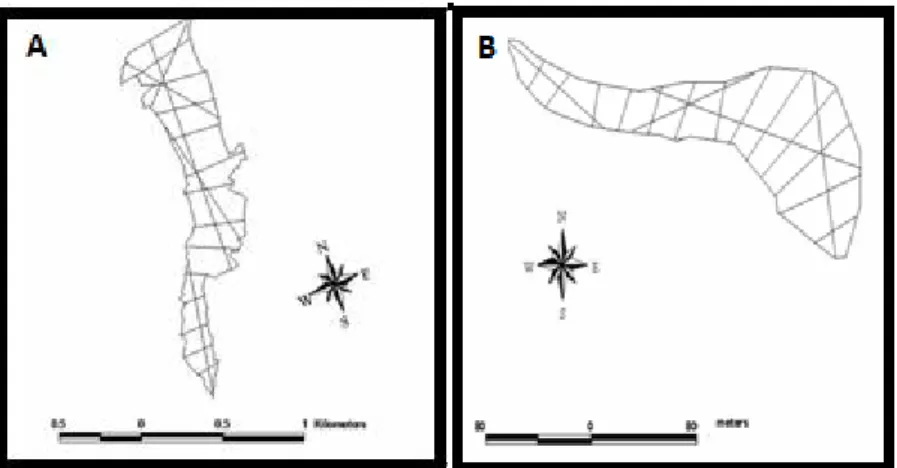
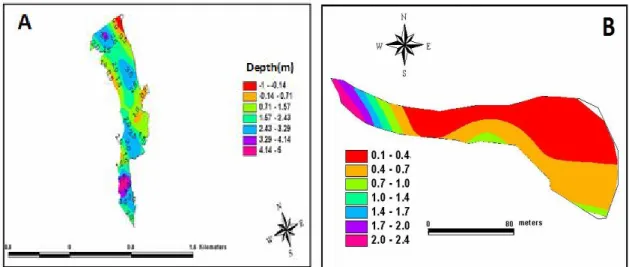
Bathymetric maps were constructed to calculate the storage capacity of Burqu and Deir Al-Kahf reservoirs .To construct the bathymetric map for both sites, Echo-sounding traverses were made between known points, to cover the entire area of the reservoirs (see Figure 4 A and B). Some traverses were perpendicular to the longest axis of the reservoirs. A Traverse Total Station (Model SOKKIA SET F6) was used to carry out the land survey while two echo sounding devices (Models Eagle Ultra III 3D and Sonarlite SL2.0 OHMEX) mounted on an inflatable boat were used to survey the water depth. All end points of the surveyed traverses were connected to a well-known Benchmark. A Note pad computer was connected to the echo sounder so that all survey points could be recorded. The survey data were fed to Arc View 3.1 and WMS 5.0 software. The former is produced by Environmental Systems Research Institute (ESRI), the makers of ARC/INFO, the leading geographic information system (GIS) software. WMS version 5.0 (Watershed Modeling System) was developed by the Engineering Computer Graphics Laboratory of Brigham Young University in cooperation with the U.S. Army Corps of Engineers Waterways Experiment Station (for more details see Al-Ansari and Al-Alami,2003) [5]. WMS 5.0 was used to create terrain models from Triangulated Irregular Networks, or TINs. The TIN was in turn used for delineating the data. Both software packages have been utilized for the construction of the bathymetric chart of each reservoir (see Fig. 5).
Figure 5: Bathymetric map A: Burqu reservoir B: Deir Al-Kahf reservoir.
2.2 Sediment
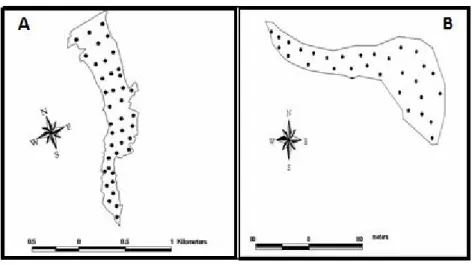
To study the nature of bottom sediment of the two reservoirs, a van veen grab was used to collect the samples. The exact location of each sample was fixed using GPS. Forty samples were collected from the bottom of Burqu reservoir (Fig. 6A) and another thirty from Deir Al-Kahf reservoir (Fig. 6B). Samples were collected covering the entire bottom of the reservoir (see figure 2). The samples were dried and sieved to estimate the sand content. The fine portions (silt and clay) were determined by pipette analysis. Folk’s (1974) [6] procedure was used for the evaluation of the statistical parameters of the sediment samples.
Two set of water samples were also collected at the surface and near the bottom of the reservoir at about 20 cm above the bed using vertical water samplers at the same locations of the sediment samples. The samples were filtered in the lab to find out the concentration of suspended sediment.
Fig 6: Location of bottom sediment samples, A:Burqu reservoir B:Deir Al-Kahf reservoir
3. Results and discussion
3.1 Volume of reservoirs
Using Arc View Version 3.1 software the calculated volume of Burqu was 629.505m3. The same was applied to Deir Al-Kahf reservoir and the volume was 12.071m³.
The overall length of Burqu reservoirs is 1500 m. The width ranges from 250 to 700 m. The storage capacity of the reservoir reaches 1.5 million cubic meters. The height of the dam is 5 m.
The maximum depth at Burqu reservoir reached 5m, and the minimum was 0.1m (Fig. 5). Most of the reservoir depth was ranging from 0.7 to 3 m. The middle parts of the reservoir were deeper from the sides. It seems that sediments in Burqu reservoir are mainly deposited on the rim of the reservoir and near the middle part of the reservoir.
The overall length of Deir Al-Kahf reservoir is 292 m. The width of the reservoir ranges from 20 to 60 m. Deir Al-Kahaf bathymetric map (Fig.5) showed that the maximum and minimum depths were 2.4 and 0.1m respectively. The depth in most of the area of the reservoir is ranging from 0.1 to 0.76m. In Deir Al-Kahf reservoir it seems that most of the sediments are deposited from the northern part of the reservoir toward the south.
3.2 Nature of Sediment:
3.2.1 A-Burqu reservoir
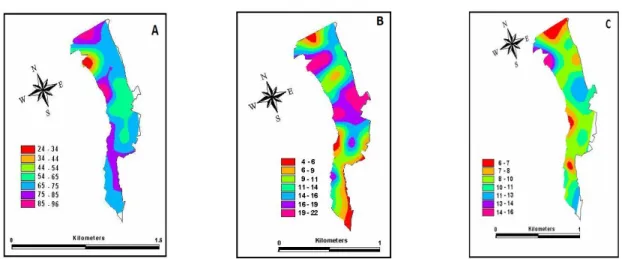
Sediment samples showed that the sand: silt: clay average ratios at Burqu reservoir were 70:17:13 respectively (Fig. 7). The maximum and minimum sand percentages were 96 and
25% respectively. The silt and clay maximum and minimum ratios were 22 and 5% (silt) and 16 and 6% (clay). The sand dominated the areas near the spillway of the dam and at the area where the main valley enters the dam. The silt and clay were relatively higher in areas near the entrance of the side valleys to the reservoir. The mean grain size of the samples was 0.1mm while the sorting was 3.4 indicating that they are very poorly sorted (Fig. 8 A &B) (Folk, 1974) [6].
The skewness (Fig. 8C) showed that the entire samples are generally negatively skewed (Folk, 1974) [6] where the mean value was 0.58 while the maximum and minimum values were 0.71 and 0.42 respectively.
Fig. 7: Sand (A), Silt (B) and Clay (C) percentage distribution at the bed of Burqu reservoir
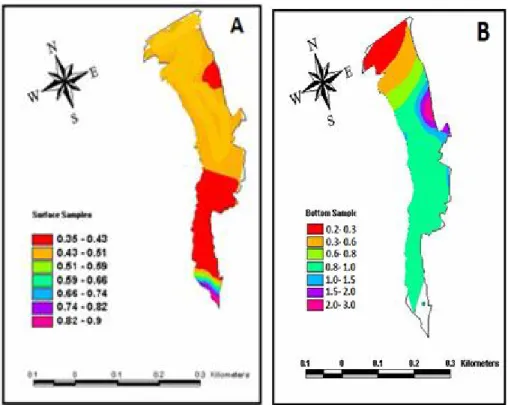
Surface suspended sediment concentrations showed an average value of 0.44 g/l and the maximum and minimum values were 0.83 and 0.4 g/l respectively (Fig. 9A). The concentrations showed relatively higher values near the entrance of the valley to the reservoir. The bottom suspended sediment samples had an average value of 0.59 g/l while the maximum and minimum values were 2.85 and 0.25 g/l (Fig. 9B). In this case it was also found that sediment concentrations decrease relatively going toward the dam.
Fig. 9: Suspended sediment concentrations (g/l) at Burqu reservoir, A: surface samples B: bottom samples.
3.2.2 B-Deir Al-Kaf reservoir
The average percentage of sand: silt: clay at Deir Al-Kahf reservoir was 69: 23: 8 (Fig. 10). The maximum sand, silt and clay were 72, 34, and 9% respectively while the minimum were 60, 15 and 4 respectively. The distribution of the sediment is generally same as in Burqu reservoir where the sand is dominating the areas near the entrance of the main valley and within the vicinity of the spillway while silt and clay are mainly near the small valleys entering the reservoir. The average mean of the sediment was 0.11mm while the standard deviation was 2.98 indicating very poorly sorted (Folk, 1974) [6] (Fig. 11). The skewness was 0.58 indicating that they are finely skewed (Folk, 1974) [6] (Fig. 11C).
Fig. 10: Sand (A), Silt (B) and Clay (C) percentage distribution at the bed of Deir Al-Kahf reservoir.
Figure 11: Sediment at Deir Al-Kahf reservoir. A: mean size (mm), B: sorting (phi), C: skewness
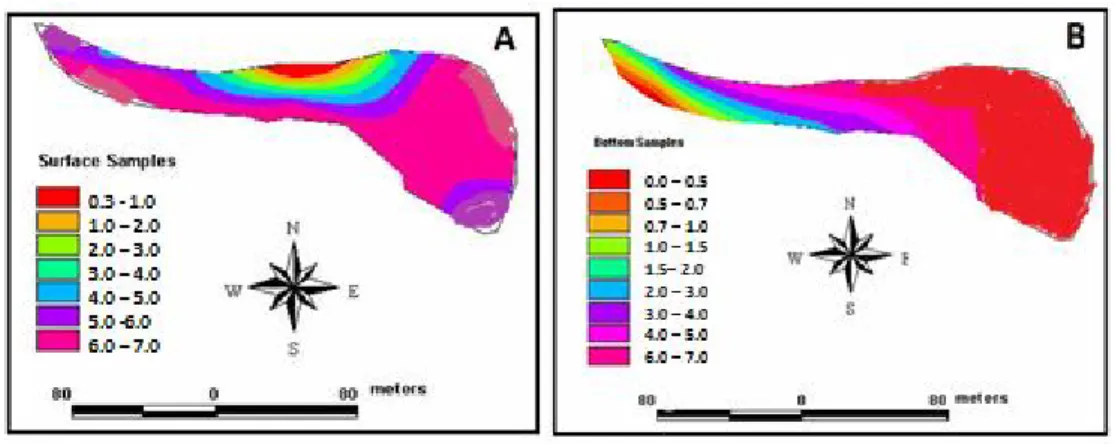
Surface suspended sediment concentrations showed an average value of 0.36 g/l and the maximum and minimum values were 0.49 and 0.06 g/l respectively (Fig. 12A). The bottom suspended sediment samples had an average value of 0.78 g/l while the maximum and minimum values were 0.95 and 0.1 g/l. In it was found that sediment concentrations decrease relatively going toward the dam. Surface samples had relatively lower values. This is due to the low depth within the reservoir and waves can easily stir the bottom sediment.
Suspended sediment sample at the surface of the reservoir showed an average value of 1.02 g/l (Fig. 12A).The maximum and minimum values were 6.22 and 0.37 g/l respectively. Most of the samples had low values (less than 1.0g/l). Bottom suspended sediment concentrations had an average value of 2.48 g/l (Fig.12B) while the maximum and minimum were 6.29 and 0.38 g/l respectively. The concentrations did not show a uniform pattern and that could be related to the nature of this shallow reservoir where the wave base might interrupt the pattern.
Fig. 12: Suspended sediment concentrations (g/l) at Deir Al-Kahf reservoir, A: surface samples B: bottom samples.
The results obtained from the sediment samples indicated that they were transported through the main and side valleys to the reservoirs during rain events. Suspended sediment concentrations showed that there is a blanket settlement of the fine suspended materials in the reservoirs.
The calculated volumes of the reservoirs were compared to those cited by Badia Research Development program (2000) [7] to find out the annual rates of sedimentation. The results showed that an average of 29016 m3 of sediment is deposited annually at Burqu reservoir. At Deir Al-Kahf reservoir the average annual sedimentation rate was 3448 m3.
4 Conclusion
The calculated volume of Burqu and Deir Al-Kahf reservoirs were 629505 and 12071m³ respectively. Sediments entering these reservoirs are mainly fine sand derived from the main and side valleys entering the reservoirs during rain events.
The sediments at Burqu reservoir have a mean grain size of 0.1 mm, very poorly sorted and negatively skewed. The sand: silt: clay ratios were 70:17:13 respectively.
At Deir Al-Kahf reservoir, the sediment mean grain size was 0.11mm and they were very poorly sorted and they were finely skewed. The sand: silt: clay ratios were 69: 23: 7 respectively.
Annual rates of sediments deposited in these reservoirs were 29016 m3 for Burqu and 29016 m3 for Deir Al-Kahaf.
References:
[1] S.Baban, and N.A.Al-Ansari, (eds.), Living With Water Scarcity. Water resources in the Jordan Badia Region, The Way Forward, Al al-Bayt University publications, Jordan. (2001)
[2] T.Oweis, D. Prinz, and A.Y.Hachum, Rainwater Harvesting for Agriculture in the Dry Areas, CRC press, (2012),262.
[3] A.Garber, and E.Salameh, Jordan’s Water Resources and their Future Potential. Friedrich Ebert Stiftuny, Amman, Jordan, (1992), pp 122.
[4] N.Al-Ansari, and S.Baban, The Climate and Water Resources, in S. Baban, and N.A. Al-Ansari (eds.), Living With Water Scarcity. Water resources in the Jordan Badia Region, The Way Forward, Al al-Bayt University publications, Jordan, (2001)-53. [5] Al-Ansari,N.A. and Al-Alalami, H., 2003, Reduction of Water Storage Capacity of the
Wadi Arab Dam (Jordan) due to Reservoir Sedimentation, Al Manara Journal for scientific studies and research.V.9., No2, pp 155-168
[6] R.L.Folk, Petrology of Sedimentary Rock, Hemphill Publishing Co. Texas, (1974). [7] Badia Rserach and Development Program, Evaluation of the exixting water harvesting

