-2-Master of Science Thesis EGI 2016:2018 GIS-Based approach to estimate the energy
requirements of the post-harvest activities in Souss-Massa basin in Morocco
Javier Izaguirre Carbonell Francesco Agostini Fantini
Approved 05/04/2019 Examiner Francesco Fuso-Nerini Supervisor Youssef Almulla
Commissioner Contact person
Abstract
Over the last decades the Moroccan agriculture has passed through a complete transformation: due to the low workforce cost and its favourable climate, the sector has attracted the attentions of national and foreign investment and thus has expanded rapidly. Among the different productions, tomatoes proved to be one of the most profitable, generating 4.867 billion dirhams in 2016 from exports. In order to remain competitive and attractive, the sector needs to be constantly monitored and controlled: abuses of the environment and of available resources may affect or even compromise the future of the Moroccan agriculture. Energy in particular has a remarkable role and has to be analysed in order to quantify its impact over costs and environment.
The aim of this study is to build a GIS-based model of tomato’s postharvest system and study the agriculture and energy nexus interactions in the Souss-Massa region. Post harvesting activities such as: Transportation, conditioning, packaging, storing and transformation of tomato, occurs within Souss-Massa’s geographical boundaries and have been the focus of in this study. Results of current system highlight the dominance of packaging activity as the main energy consumer with 77%, followed by storing, transportation and transformation with 14 %, 6% and 3% respectively. In terms of cost the transportation becomes the most relevant activity due to the cost of fuels and transport conditions. Energy costs and wastes in transportation represent 15% of the local revenues (9% Transportation, 5% Packaging and 1% Storing).
Four different scenarios about the future situation have been implemented to measure the possible impact of changes in the different activities: Business as Usual (BAU), Transport Efficiency (TE), Waste Reduction (WR) and Renewable Penetration (RP).
-3-
In BAU current trends have been followed to forecast the total production, the export and the power generation. In TE trucks with bigger capacity have been implemented and in WR refrigeration is considered in every transport stage. Finally, in RP higher renewable penetration has been considered
Sammanfattning
I över ett decennium har en förändring skett i det marockanska jordbruket, kombinerat med låga arbetskostnader och landets gynnsamma klimat har sektorn fått stor uppmärksamhet vilket har resulterat i att både nationell och internationella investeringar och sektorn har därmed kraftigt expanderats. Jordbruksproduktionen som visat sig vara mest gynnsam är produktion av tomater, där export av varan har genererat 4,867 miljarder dirham. För att säkerställa en attraktiv och konkurrenskraftig produktion är konstant övervakning och kontinuerlig kontroll ett måste; missbruk av miljö och dess resurser kan ha betydande påverkan vilket på sikt kan kompromissa framtiden för det Marockanska jordbruket. Energi har en betydande roll i jordbruket och bör därmed analyseras för att förstå dess övergripande inverkan på kostnader och miljö.
Syftet med denna studie är att bygga upp en GIS baserad modell över tomatprodukten efter skörd samt att studera relationen mellan energi- & jordbrukssektorn i Souss-Massa regionen. Efter skörd inkluderas följande aktiviteter: transport, konditionering, förpackning, förvaring, och transformering av tomater. Studiens geografiska systemgräns gäller området Souss-Massa. Resultatet av studien visar att den mest energikrävande processen är förpackning av tomater och står för totalt 77% av energikonsumtionen, därefter följer förvaring, transport och transformering av 15%, 6% och 3% respektive. Resultaten visar dessutom att transport är den mest kostsamma aktivitet i processen, detta på grund av höga kostnader för bränsle samt förutsättningar för transport. Energi- och avfallskostnader i transport representerar 15 % av lokala intäkter (9% transport, 5% förpackning och 1% lagring).
Fyra framtidsscenarion utformades för att mäta den framtida inverkan hos de olika aktiviteterna: Business as Usual (BAU), Transporteffektivisering (TE), Avfallshantering (WR) och Förnybar energimix i jordbrukssektorn (RP).
I BAU scenariot har nuvarande trender följts för att förutse totala produktionen, export och kraftproduktion. I TE scenariot har lastbilar större kapacitet jämfört med de andra scenariona och i WR är konditionering inkluderat i vardera transportsteg. Slutligen i RP har en förnybar energimix integrerats i systemet.
Contents
1. Introduction ... 5
1.1. Sustainable development concept and importance ... 5
1.2. Sustainable agriculture ... 5
1.3. Morocco current situation ... 6
1.3.1. Agriculture in Morocco ... 6
1.3.2. Energy situation ... 7
1.4. Souss-Massa region, Morocco ... 8
1.4.1. Souss Massa tomatoes ... 8
1.4.2. Souss Massa Post-harvest of Tomato ... 9
1.5. Stakeholders ... 10
1.6. Study boundaries ... 10
1.6.1. Geographical boundaries ... 10
1.6.2. Types of energy considered ... 11
1.7. Literature review ... 11
1.8. Goals ... 12
2. Methodology ... 12
2.1. Life cycle analysis suitability ... 13
2.2. Datasets ... 13
2.2.1. Souss-Massa’s administrative boundaries ... 14
2.2.2. Modelling post harvesting activities ... 14
2.2.2.1. Tomato production in greenhouses ... 14
2.2.2.2. Local market ... 16
2.2.2.3. Packaging and storing stations... 16
2.2.2.4. Transformation stations ... 17
2.3. Modelling ... 17
2.3.1. Flows ... 17
2.3.2. Postharvest distribution ... 20
2.3.3. Transport ... 21
2.3.4. Packaging, Storing and Transformation ... 23
2.3.4.1. From GHs to local market ... 23
2.3.4.2. From GHs to packaging and transformation station ... 23
2.3.4.3. From packaging and transformation station to port ... 23
2.3.4.4. From packaging and transformation station to exported country via International Road Transport (TIR) ... 24
2.3.6. Grid ... 25
2.3.6.1. Grid Efficiency ... 26
2.3.7. EMISSIONS ... 27
2.3.8. Revenues and Energy Cost ... 27
2.4. Scenarios ... 29
2.4.1. Business as Usual (BAU) ... 29
2.4.2. Efficient transport scenario (ET) ... 30
2.4.3. Waste reduction transport scenario (WR) ... 31
3. Results ... 31
3.1. Current situation ... 31
3.2. Efficient Transport Scenario ... 34
3.3. Tomato Waste Reduction scenario ... 34
4. Discussion ... 35
4.1. Current Situation ... 35
4.2. Transport Scenarios ... 36
4.3. Limitations of the study ... 36
4.4. Future work ... 36
5. Bibliography ... 38
APPENDIX – PYTHON CODE ... 41
Table of Figures
Figure 1: Sustainable development scheme ... 5Figure 2: Morocco GDP from Agriculture growth ... 7
Figure 3: Power capacity installed in 2015 and projected capacity for 2030 ... 7
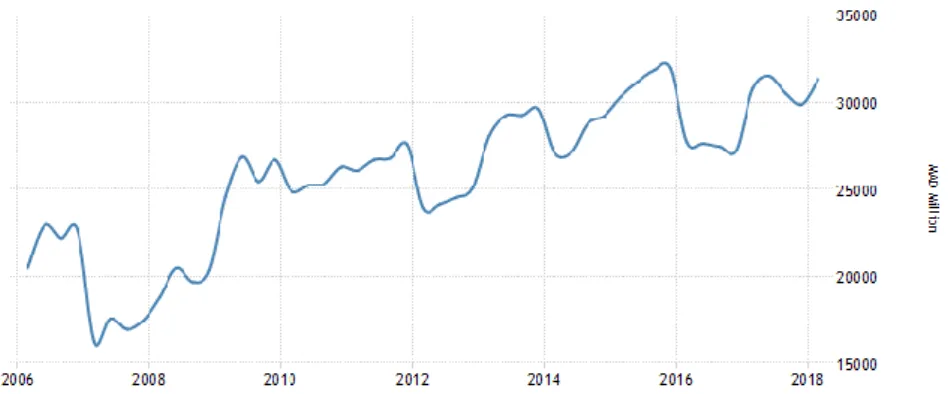
Figure 4: Evolution of GH’ tomato production in Souss Massa ... 9
Figure 5: Tomato's postharvest phases ... 9
Figure 6: Souss-Massa administrative boundaries with its provinces ... 11
Figure 7: Souss-Massa administrative boundaries with its provinces ... 14
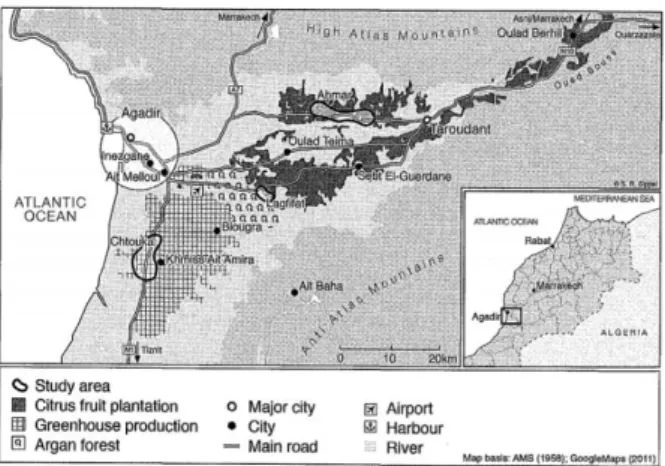
Figure 8: The Souss plain: intensive agriculture and location of study areas ... 15
Figure 9: ArcGIS simulation of Souss massa tomato GHs ... 15
Figure 10: GHs' location in Taroundant province ... 16
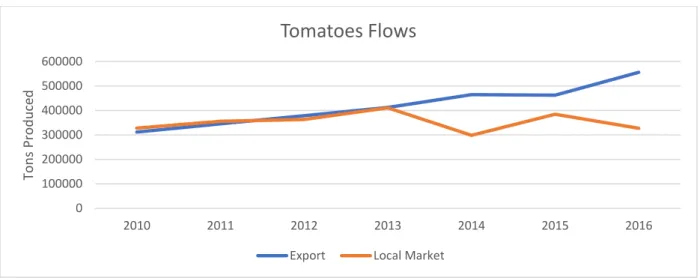
Figure 11: Evolution of tomato production for export and local market ... 18
Figure 12: Souss Massa's postharvest tomato flow ... 19
Figure 13: Location of Souss Massa's postharvest stations in ... 19
Figure 14: Evolution and projection of industrial tomato production ... 20
Figure 15: Criteria employed to assign a local market to each GHs ... 20
Figure 16: Criteria employed to assign a packaging and storing station to each GHs ... 21
Figure 17 Example of a transportation path ... 22
Figure 18: Location of the Agadir's centre and port ... 23
Figure 20: Evolution of Morocco's electricity mix ... 25
Figure 21: Morocco's electricity production share ... 26
Figure 22: Tomato Price in Souss Massa Wholesale Markets (2015) ... 28
Figure 23: MV and HV electricity price during Peak, Off-Peak and Base periods ... 29
Figure 25: Tomato production forecast ... 30
Figure 26 Energy Consumption in post-harvest activities: Transportation, Storing and Transformation ... 31
Figure 27 Energy consumption of Packaging, Transportation, Storing and Transformation ... 32
Figure 28 (Left) Costs of Energy, (Right) Shares of the costs ... 32
Figure 29 Local revenues and Cost of Post-Harvest activities ... 33
Figure 30 GHG emissions by Activity ... 33
Figure 31: Liters of diesel consumed forecast ... 34
Figure 32 Avoided Waste and Cost of Cooling compared ... 35
Table 1: Yearly crop production and surface occupied in Souss Massa ... 8
Table 2: Packaging, storing and transformation energy coefficients ... 23
Table 3: Powerplants efficiency per fuel... 26
Table 4: Emission factor per fuel ... 27
Table 5: Peak, Off-Peak and Base criteria ... 29
1. Introduction
In this chapter, the background of the research question, its importance and the reasons for choosing it, are explained in a structured way to approach this research main goal:
Study of the energy consumed during the post-harvesting of tomato in the region of Souss-Massa, Morocco, and the impact of alternatives to reduce it.
1.1.
Sustainable development concept and importance
Development has driven human progress to its historical maximum nowadays thanks to technological advances, increase use of land and exploitation of resources among others, which has been translated into longer and better life, boost of production yield, reduction of transportation time, etc. It is undeniable its importance in the road to achieve the high-quality life standards we live in, but it has not come for free. This development has left a footprint impress in the skin of Earth and now we are starting to feel the consequences of our previous and current actions, presenting themselves in the form of climate change, water scarcity, unpredictable and catastrophic weather and others.
Many voices pointed out the consequences related to this uncontrolled development with few successes till now. Incoming global challenges and increasing awareness has pushed to the consecution of international agreements, like Paris agreement, by which was stablished a set of common goals supported by specific measures to change our current model of development into sustainable.
Sustainable development is frequently defined as “development that meets the needs of the present without compromising the ability of future generations to meet their own needs” [1]. Sustainability is divided into three different concepts: environmental, economic and social.
Several projects and researches have contributed and continue working for changing the current development paradigm, focusing on providing a solution that satisfies the three pillars, arriving to a bearable, viable and equitable alternative.
This study intends to model one of the small branches of our current system and offer sustainable alternatives considering all the pillars.
1.2.
Sustainable agriculture
Agriculture plays a critical role in society, as an essential activity to satisfy world food needs and also its important economic’ role, accounting for an average of around 3.8% of World GDP in 2016 [2]. As its numbers indicates, agriculture has a huge impact in our society in various aspects, providing jobs, powering economies, assuring quality, covering demand as well as tangential impacts. Although, at the same time, the enormous land designated to farms, greenhouses and conditioning stations, the
waste and emissions it generates, the high-water consumption and the energy consumption from non-renewable sources among others, have contributed dramatically to our unstable and dangerous situation, where climate change and other devastations are taking place. This sector is suffering a face wash where new technologies and energy resources have stood as key characters to take the lead of the sustainable change.
The list of characteristics that influence, affects and impact the process of harvest and post-harvest is wide: soil type, plant type, plagues, pesticides, irradiance, wind, conditioning process, refrigeration system, transport quality, distance travelled, etc [3]. Different approaches have been used to improve the system: from a small and local to global perspective, from biological, environmental and social to economical and energetic perspective.
1.3.
Morocco current situation
The Kingdom of Morocco is located in North Africa, bordering with Algeria, Western Sahara, Spain and coasting with the Atlantic Ocean and Mediterranean Sea. Morocco is a developing country, with an increasing economy and international relevance carried by exports, a boom in private investment and tourism. Geographically, large deserts, lengthy coastline and craggy mountains in the interior spread around the country. The climate differs from north to south, ranging from wetter to drier weather respectively.
Consistent regulatory framework, advantageous commercial and diplomatic relations with other countries such as EU and USA, proximity to potential and develop markets (EU) and economic resilience to agricultural vulnerability have pushed the economy. Although, Morocco faces several challenges that hinders its growth. Some of them are internal, like rural and urban standards gap, poverty and young unemployment [4]. However, others are the consequence of external factors, like market health and climate change. Particularly, the latter is predicted to have a massive impact on Morocco (and North Africa in general). Forecasts estimates a decrease between 10 and 20% in precipitations and an increase between 2 and 3ºC in temperature [5]. Morocco, with an economy strongly based on high water intensity agriculture, will most likely suffer the consequences of this phenomenon due to the decrease in water availability, soil and water pollution.
1.3.1.
Agriculture in Morocco
Morocco’s agriculture production has experience recently a big increase in terms of yield thanks to Le Maroc Vert (Green Morocco Plan), a multidimensional strategy that strengths the Green Economic Growth in Morocco by investing and supporting sustainable production and climate change adaptation and mitigation actions [6]. Morocco has a long tradition on agriculture exploitation, contributing to around 15% of Morocco’s GDP and employing ,with fishing and forestry sector, about 45% of the total workforce in 2015 [7]. Historically, Morocco’s agricultural products have been growing on importance in economic terms, growing from 20.000 to over 30.000 MAD, as Figure 2 shows [8].
This evolution is explained by the increase on exports as a consequence of foreign investment, well develop agriculture techniques and workforce and competitive prices. Among all the crops, tomato production has boosted to its historical maximum, producing 1.2 million tons in 2016 [9]. Although tomato production does not reign among Morocco’s crops in terms of tons produced per year, being the 6th crop in that classification, its relevance lies in its international importance and economic impact
in the country. In 2016, the export of tomato accounted to 723M$, 25% of Morocco agricultural export value [10].
1.3.2.
Energy situation
Fossil fuels are the major energy resource consumed, making Morocco highly dependent on fossil fuel imports. In 2012, only 8,4% of the total primary energy supply was renewable [11]. The trend is changing pushed by the high cost of fuel imports, energy security and high emissions which has resulted in international agreements, like latest Paris Agreement, by which Morocco compromise to reduce its GHG emissions by 32% by2030, reaching a cumulative reduction of 401 Mt CO2eq over the
period 2020-2030, increase the share of generating capacity from renewables to 42% by 2020 and 52% by 2030 and reduce the energy consumption through energy efficiency measures by 12% by 2020 and 15% by 2030 [12] [13]. Figure 3 illustrates the capacity installed current state and the expected projection for 2030.
In order to achieve the proposed target, Morocco has different national strategies: 31% 20% 15% 0% 2% 10% 22%
Capacity installed (2015)
Coal Oil Gas Solar PV Solar CSP Wind Hydro
20% 3% 25% 14% 5% 20% 13%
Capacity installed (2030)
Coal Oil Gas Solar PV Solar CSP Wind Hydro
Figure 3: Power capacity installed in 2015 and projected capacity for 2030 Figure 2: Morocco GDP from Agriculture growth
• The Solar Plan and Wind Plan: Set of actions to exploit solar and wind resources • The National Strategy for Energy Efficiency: Policies to implement energy efficiency
measures in different sectors
1.4.
Souss-Massa region, Morocco
Souss-Massa is one of the twelve regions of Morocco, with Agadir as the capital. Souss-Massa region was formed in 2015 by merging 5 provinces from the previous region Souss-Massa-Drâa (Agadir-Ida-Ou-Tanane, Inezgane-Aït Melloul, Chtouka-Aiït Baha, Taroudannt and Tiznit) plus Tata province (previously part of Guelmim-Es Semara region) as part of the Morocco’s administrative restructure plan [14].
Agriculture is the major economic activity of Souss-Massa, representing 13% of the regional GDP [15]. Agricultural activities are concentrated in Souss-Massa’s basin, spreading from Agadir (locating at the north west of the region, to the east. Major crops cultivated in Souss Massa are the tomatoes, bananas, peppers and others. All of them are water-intensive crops and considered in medium-high or high risk in case of drought [16]. That is causing serious problems in Souss-Massa as it is facing severe drought and desertification since intensive use of irrigation for cultivation is depleting the ground-water resources (main irrigation technique). This presents two problems: long and short-term water access sustainability and farmers’ economic viability. Ground-water depletion has made farmers to struggle to sustain economically their farm as the ground-water’s extracting cost grows at deeper locations.
Souss-Massa region has a develop agriculture postharvest industry that covers the packaging and transformation needs of their local produce. Besides, inside Souss-Massa’s most populated city, Agadir, resides one of the major ports for exports of Morocco. The region is also well communicated with other regions and borders via road transport due to the extensive road infrastructure. That is translated into a considerable post-harvest process in which crops need to be transported, transformed and/or packaged, depending on the final utility of the produce.
1.4.1.
Souss Massa tomatoes
Souss-Massa’s tomatoes were chosen as the targeted crop for the research because it is by far the most produced inside GHs, its national relevance (82% of Morocco’s tomatoes exports start from Souss-Massa [17]) and the lack of detail analysis about the energy consumption and cost and emissions associated to the postharvest process of the tomato in the region. Table 1 shows the dominance of the tomato in the region.
Table 1: Yearly crop production and surface occupied in Souss Massa
2010 SURFACE (HA) PRODUCTION SHARE CROP 12 976 1 109 705
TOMATOES 4768 639671 58%
PEPPERS 1202 102146 9%
BANANAS 4354 180921 16%
Massa region and its predecessor, Souss-Massa-Draa, have a large tradition of tomato cultivation and export but it has been lately when production has boosted. Figure 4 shows that the production has increased during the last 4 years and it is getting even more relevant compared to other productions in greenhouses (GH).
The tomatoes are produced almost completely in GH environment, mainly in the winter period, when the temperature is more favourable for the cultivation and the European market is particularly open [18].
The second most produced crop in the region is the banana, that despite there was a peak of production during the seventies because of the impossibility to import them, now a days it is not anymore appetible for investments because it is less water efficient compare to tomatoes.
1.4.2.
Souss Massa Post-harvest of Tomato
To be ready for export, tomatoes and any other crop need to fulfil the quality standards imposed by import countries. The minimum quality is guaranteed by good harvest and post-harvest activities. In order to give credibility to their national agricultural product, Morocco created Etablissement Autonome de Contrôle et de Coordination des Exportations (E.A.C.C.E.), a public organism in charge of standardizing processes and monitoring and controlling the export crops [19].
Post-harvest activities embody an important part of tomato process in Souss Massa as they are required to accomplish the high-quality export standards (Souss Massa exports 82% of Morocco’s tomatoes for export).
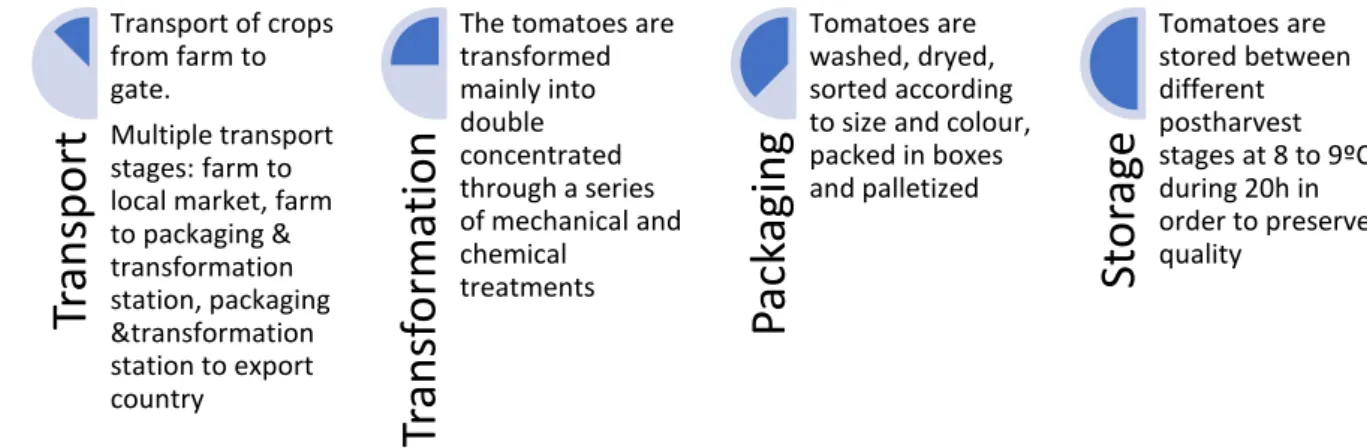
The harvest procedure varies depending on the final destination. In Souss Massa, the post-harvest of the tomato directed to the local market consists uniquely in the transport from the farm to the local market. On the other hand, the tomato exported travels from the farm to the packaging station, where the produce is washed, packed and palletized, then moved into a storage room (typically inside the packaging station) and finally transported to the export market. A small fraction of the tomatoes is transformed into double concentrated tomato, then packed, stored and exported. Figure 5 displays all the steps and the actions involved.
Figure 5: Tomato's postharvest phases
Tr
an
sp
or
t
Transport of crops from farm to gate. Multiple transport stages: farm to local market, farm to packaging & transformation station, packaging &transformation station to export countryTr
an
sf
or
m
at
ion
The tomatoes are transformed mainly into double concentrated through a series of mechanical and chemical treatments
Pack
agi
n
g
Tomatoes are washed, dryed, sorted according to size and colour, packed in boxes and palletizedSt
or
ag
e
Tomatoes are stored between different postharvest stages at 8 to 9ºC during 20h in order to preserve quality 700 800 900 1000 2013 2014 2015 2016 2017 Th o u sa n d s To n sGreenHouse Tomato Production
1.5.
Stakeholders
Traditionally, the cultivation of tomato in Souss Massa was carried out by family owned small farms that sold their product in the local markets. However, the increasing demand from export markets, the penetration of foreign companies and investment plus the technification of harvest and post-harvest practices have changed the scene. Focusing the analysis in post-post-harvest stakeholders, previous studies divided them into those who export and those who sell to local market [20].
Export:
• Integrated groups: This groups owns their own agricultural holdings and then condition their produce in their postharvest stations which usually are of big dimension and equipped with the most modern technologies. They only process their products, offering high-quality standards and incrementing the value added. They possess their own logistics services and export their product under a unique brand. The investors are typically foreigners. Some examples are Maraissa, from the Azura Group (a Franco-Moroccan family owned group) and Rosaflor
• Mixed integrated groups: Similar to previous group, they own their own agricultural holding, postharvest station and logistics. The difference strives on the tomato origin, as they also buy crops from other producers, and even commercialize tomatoes from other postharvest stations. The quality of the produce varies depending on the source. Some examples are Agri Souss, Societe De Gestion Des Exportations Des Produits Agricoles (G.P.A.) and Salam. • Intermediary groups: Unlike the other groups, they scarce from agricultural holdings, so their
function consist in selling the produce from their own and independent postharvest stations. The quality of the tomato is low and they commerce under different brands. Some examples are OCE and Sogecap.
Local market:
• Small farms: Family owned farms with no means of conditioning are forced to sell their product in the local market in a much worse condition. Some do not have access to freight transport, hence they are dependent of intermediary groups.
• Cooperatives: A conglomerate of the three groups exposed in the export section. They sell their product nationally whenever the crop does not reach the high-quality standards of E.A.C.C.E., when they suffer logistic problems that impede the international transit or when the local market offers a competitive price.
1.6.
Study boundaries
As a globalized and interconnected market, it is logic to lose track of all the actions, inputs, actors, companies and others involved in the production and development of a product. By delimitating the scope of this study, adjusting to the available data and uncertainties, it is intended to present reliable results within the specified boundaries.
1.6.1. Geographical boundaries
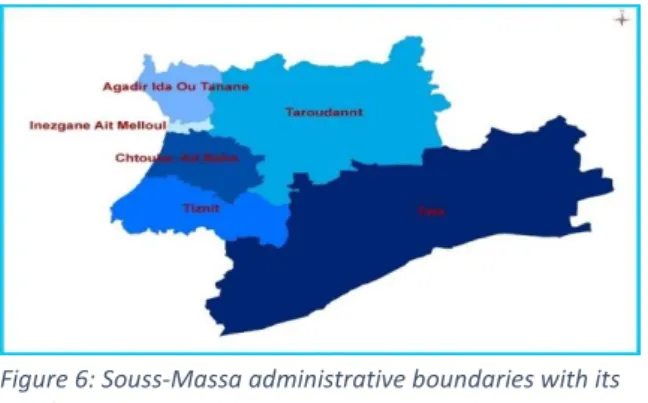
Souss-Massa is formed by 6 provinces: Agadir-Ida-Ou-Tanane, Inezgane-Aït Melloul, Chtouka-Aiït Baha, Taroudannt, Tiznit and Tata.
This research focus on all the activities related to the post-harvesting of tomato occurring within the political boundaries of Souss-Massa region as shown in Figure 6.
On that account, the energy consumed by the maritime container transport and International Road Transport (TIR) outside of the mentioned boundaries, on the production of cardboard packages and any others produced outside Souss-Massa, are not taken into account.
1.6.2. Types of energy considered
As explained before, the objective of this research is to estimate the energy consumed during the post-harvesting of tomato in the region of Souss-Massa, Morocco. Hence it is necessary to narrow down what this study means by energy due to its multiple shapes and origins. The post-harvest of tomato consumes three different type of energy: Direct energy, indirect energy and capital energy [21].
- Direct energy: It represents the energy consumed directly during the action that is analyzed.
They are categorized according to their energy sources: petroleum products and lubricants, electricity, industrial gases and solid mineral fuels.
- Indirect energy: Energy used to produce certain inputs, as fertilizers, heat, plant protection
products and plastics.
- Capital energy: Also considered indirect energy, with the difference on lasting through several
production cycles.
Due to the limited access to data of this master thesis as well as the unclear origin and manufacture of some of the components produced outside the geographical boundaries, only the direct energy employed along the tomato’s postharvest process is considered.
1.7.
Literature review
Some researches have already been made about the tomato industry inside Souss Massa and Morocco. In this chapter they are explained, highlighting their importance and relevance to our work as well as spotting their difference compared to this paper.
In “Payen et al, 2014”, a LCA analysis of the tomato in Souss Massa destined for export in France is carried out, focusing on the environmental footprint of the whole process. The aim of the research is to perform a multivariable comparison between the tomatoes consumed in France produced locally and the Moroccan tomatoes imported. The methodology and results are partially useful to this study as they contribute to detect the different flows and stages of the postharvest process. Although, there is no data and analysis on the remaining tomatoes directed to other export markets and the national market. Finally, due to the specific goal of comparing the environmental and energy cost of Moroccan and French tomatoes, neither alternatives nor scenarios is raised
Figure 6: Souss-Massa administrative boundaries with its provinces
In “Feschet, 2008”, a detailed and methodical analysis of the energy consumption along the tomato chain in Morocco, Spain and Netherlands is performed. As the scope of the study is wide, the methodology followed, assumptions made, and results obtained are taken as indicative for our study. Besides the valuable data, also the methodology employed inspired us to guide this research. Again, this study focuses on exports to France, leaving out of the study of the national commerce and lacks alternative proposal to improve the local system.
In “Sippel, 2015”, an onsite analysis of the location of tomato’s GHs as well as of other relevant crops in Souss Massa is performed. It also traces down the evolution of the cultivation in the region, helping to understand the current situation, stakeholders and markets. Overall, this study offered a general picture of the market, providing valuable information of the flows and farm emplacement, not covered in other studies.
In “Beatriz Cerezo Monje et al, 2011”, a study of Souss Massa agriculture situation from a commercial, political measurements and legislation, consumption and prices is made. It offers a cohesive summary of recent national and local policies aiming to push forward Souss Massa’s agriculture. For the purpose of this study, it helped to understand recent production and investment trend.
1.8.
Goals
After the analysis of the current situation, understanding strengths, weaknesses and the lack of literature and research on the topic, “Study of the energy consumed during the post-harvesting of tomato in the region of Souss-Massa, Morocco, and the impact of alternatives to reduce it”, a set of project goals are stablished:
• Create a model of the current Souss Massa’s tomato postharvest system energy consumption • Improve the energy system through the study of different alternatives, implement them in
the model and measure results
• Reduce tomato postharvest waste and measure its overall effect on the system • Ensure the economic viability of the solutions proposed
2. Methodology
This research followed a two-phase methodology to achieve the goals of this study: qualitative and quantitative. Below both stages are described.
• Qualitative phase: First phase of the study. This stage helped to comprehend the current system, set reasonable goals and develop scenarios to model, analyse and compare.
o Current situation analysis: A literature review was performed, gathering multiple and variable data that defines the current system. During this stage it was identified the different stakeholders, flows, technologies, locations and energy situation. By this study it was intended to identify weaknesses and potential improvements.
o Objectives setting: Once understood the system, research objectives were set. o Modelling approach: There are multiple methods to use for recollecting data and
model it. In this study, a geographical approach was chosen according to the suitability to the type of study. ArcGIS plus PYTHON were the software chosen.
o Scenarios developing: The system is broad and there are multiple variables that could potentially change the structure. To delimit the study in order to give an accurate and quantitative result, four scenarios were modelled, offering alternatives based on advanced technologies and policies.
o Current scenario modelling: All the data gathered, such as geographical information of the region, location of the actors, roads, annual tomato flows, ratio of tomato destined to export, was introduced into ArcGIS and PYTHON, extracting the energy consumption, emissions and cost of the different steps of tomato post-harvest in Souss-Massa region.
o Scenarios simulation: The proposed scenarios were implemented in the previously developed model. To measure the variations, different key performance indicators (KPIs) were used to monitor and compare results between scenarios and current situation and prove whether the research goals were achieved. These KPIs are energy cost, economic cost and CO2 equivalent emissions.
o Result analysis: The results obtained from the modelling were analysed and compared based on the mentioned KPIs. To facilitate the comprehension, the results are presented by standardized figures and described by the authors.
o Conclusions and recommendations: An interpretation of the results is given taking into account all the information gathered and previous studies from the authors. A set of recommended actions is proposed, and further work and research is suggested. In the APPENDIX is annexed the code developed for PYTHON.
2.1.
Life cycle analysis suitability
Due to the uncontrolled depletion of non-renewable and highly pollutant resources plus the dependency on foreign countries to supply the fossil fuels, the interest on methodical approaches to understand and estimate the footprint of the current system have increase. As agriculture’s footprint is variable and tricky to estimate due to the globality of the market and the data uncertainty, many methods were suggested that stablish the path to conduct this investigation. Among them, Life Cycle Analysis (LCA) has raised as the most respected and common used method since its standardization (ISO 14040, ISO 14044).
The core idea of LCA is to evaluate the impact over the environment of a product, process or activity along its life cycle by the quantification of the resources and emissions associated with the system that is evaluating. It covers all the life stages: extraction, production, distribution, use and end of life (recycle, reuse, elimination/disposition of residues/waste).
As specified in previous chapters, the scope of this master thesis is set only in the postharvest phase. This entails that the research only considers this stage, obviating the remaining stages as production and others mentioned before. In this case, LCA methodology is used as pathway to undergo the evaluation of the energy cost, economic cost and emissions associated to the tomato postharvest to offer sustainable alternatives.
2.2.
Datasets
Due to the nature of this study and the impossibility to travel to the targeted area to collect some of the data “on site”, all the information showed and processed along the report was collected from previous researches, governmental sites, open access GIS layers and other mediums. As the authors did not have the opportunity to certify this data by their own experience, it has been used alternative sources and researches from different authors to validate it.
2.2.1. Souss-Massa’s administrative boundaries
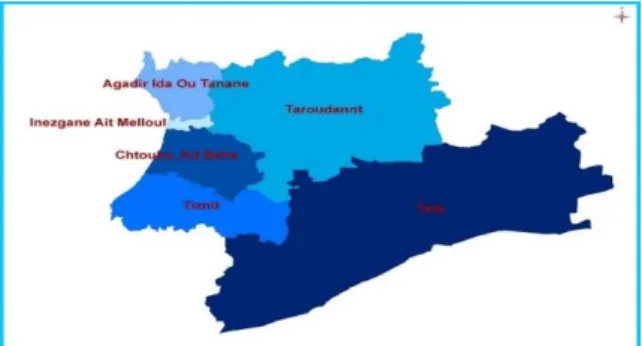
Since the data has to be in geographical format (GIS) for modelling purposes, several private and public open data servers with Morocco’s administrative boundaries shapefiles were visited. As the mentioned change of borders occurred relatively recently, no update data was available. Hence, the final map used to process the data (Global Administrative Areas [22], validated by Openstreetmap [23]) was readjusted from a general map of Morocco, using ArcGIS tools to readjust it to the new division. Figure 7 shows the representation of Souss-Massa region and provinces as seen in ArcGIS.
Once the scope of this study is clear and the geographical boundaries set, all post-harvesting
processes were identified, following every route that the crop takes from the production site until its final destination.
2.2.2. Modelling post harvesting activities
2.2.2.1.
Tomato production in greenhouses
85% of Morocco’s tomato production surface is grouped in the region of Souss-Massa [24]. Historically, the cultivation of tomato in Souss-Massa was mainly dominated by families with small open-air farms and, hence, low production. In recent years, big export companies have taken over the ownership of tomato production due to two reasons:
- The competitiveness of the international market, offering economies of scale advantages to vertical integrated business models [25] which displaced small farms with low access to packaging, transport and commercial partners.
- The propagation of tomato yellow leaf curl virus in 1999 [26]. This virus can only be controlled in greenhouses. Hence, the producers who could not afford the restructure of its farm into greenhouse or the construction of new one, got relieved. In 2017, 98% of tomato total farm’s surface was under GHs [27].
In this study, due to the irrelevant tomato production on open-air farms, only greenhouses were considered. Previous studies located the majority of greenhouses at the south of Agadir [28], as Figure 8 shows. With the aim of calculating the distances via ArcGIS, the layer “buildings” from Mapcruzin, which holds information of the ports, cities, villages, main buildings and relevant locations, was added. The representation of the greenhouses found in this layer are represented in Figure 9 .
Figure 7: Souss-Massa administrative boundaries with its provinces
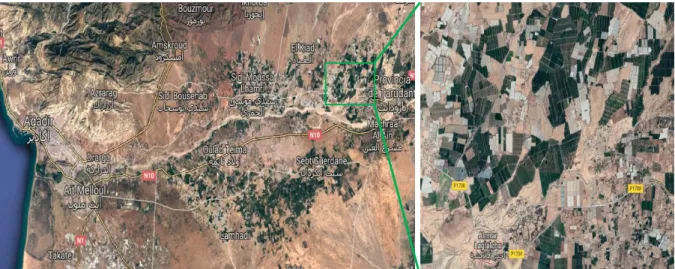
As the comparison of Figure 8 and Figure 9 shows, Figure 9 locates the majority of the GHs in the same region as S.Sipell, 2015 own study, strengthening and validating the data extracted from Mapcruzin. Although, there are also few GHs placed in Taroudannt province not reflected by Sipell research. To confirm the remaining GHs, Google Maps was checked using its satellite layer. Figure Figure 10 shows the precise location of the GHs pointed out by a green square in Figure 9. GHs appear with the white colour characteristic of the plastic/grey used by the GHs in this region. Similar information was obtained from the Association Marocaine des Producteurs Exportateurs de Fruits et Légumes (APEFEL), matching the other sources’ surfaces used for tomato cultivation [29].
Finally, the total area of all the GHs provided by the layer “buildings” (OpenStreetMap) mentioned before was compared with governmental information. According to Souss Massa Regional Council, GHs occupy a total area of 8,622 ha in Souss-Massa, being 69% of its production from tomato [27]. On the other hand, the data gathered in geographical format by OpenStreetMap in the “building” shapefile estimates that GH’s total area as 3,344 ha, 38,8% of the official data. Having proved that the location of the GHs of the GIS file was precise but incomplete, this dataset was used as an indicative of the location and size of the GHs per zones.
Figure 9: ArcGIS simulation of Souss massa tomato GHs Figure 8: The Souss plain: intensive agriculture and location of study areas
2.2.2.2.
Local market
There are two main fruits and vegetables markets, located in Oulad Teima and Inezgane [28]. Most of tomato production intended to local consumption goes to one of them and from there it is distributed along the country. For carefully locating the two markets, the shapefile “Places” (by OCHA Regional Office for the Middle East and North Africa, in Humdata webpage) was used.
2.2.2.3.
Packaging and storing stations
In the export case, packaging and storing plays a crucial role of the process as it ensures the preservation and quality of the produce while it also serves of merchandising to promote the name of the region. In Morocco, especially in Souss-Massa, there has been a big investment to meet the quality standards of Europe and other international markets. The quality legislation and control are responsibility of the autonomous public organism called “L'Établissement Autonome de Contrôle et de Coordination des Exportations” (E.A.C.C.E). The high standards imposed by E.A.C.C.E. about sanitary conditions and minimum capacity has help to modernize the installations, gradually eliminating small stations and replacing them with new ones equipped with advance technology and higher capacity.
There are 101 packaging and storing stations in Souss-Massa [30]. According to the chamber of commerce, 20 of them are located in Taroudant province and 81 in Inezgane [31]. Due to the lack of accurate data, Inezgane and Taroudant were considered as the location of the packaging and storing stations inside their respective province. Again, “Places” shapefile from Humdata was employed to locate these cities.
In the past year till now, there has been a renovation of the infrastructure and machinery employed for the packaging of tomato. Still the stations are not standardized. Modern stations have all the process automatized and equipped with specific lines per product. Most of them have a quality certification of their installation and services (ISO 9001). Old and small stations use a conveyer belt to bring the produce to the worker and handle all sort of vegetables and fruits.
Non-returnable packages are the most common type, being the corrugated carton the most used with more than 85%, followed by the wood package with an 8% share and the plastic package with a marginal representation [20].
Once the product is package and palletized, it is stored in a refrigeration chamber till the trucks come to pick up the pallets and transport it to foreign countries.
The direct energy consumed during packaging varies depending on the packaging technology available and the type of package employed. The critical data for our purpose is to break down the packaging steps and their energy consumption per kilo of the different packaging treatments depending on the material of the package. As a final result, 1,588 MJeq/kg provided by a packaging and storing station
that works with cardboard boxes within the region was used [32]. This value englobes the conditioning, packaging and palletizing (englobed in this study as packaging) and the storing. The average time that the pallets expend in the refrigerated room is 20 hours at a 8-9 ºC. As a result, the energy expended to refrigerate the tomatoes per kilo is 0.246 MJeq/kg [21].
Hence, the packaging energy coefficient is the result of subtracting the storing energy coefficient to the packaging and storing coefficient, resulting in a consumption of 1.342 MJeq/kg.
All the activities described in this chapter are fuelled by electricity.
2.2.2.4.
Transformation stations
As mentioned before, the surface dedicated to the cultivation of industrial tomato has declined in recent years. International markets prefer to acquire the product before transformation, which has led to a decrease of tomato processed, having a testimonial contribution to the current total tomato consumed locally and exported.
There are three transformation stations in Morocco, with one of them inside Souss-Massa, in the capital city, Agadir [33].
The tomatoes are transformed into double concentrated paste. The process that performs this activity was not provided nor found by other sources. Instead, the average energy consumption of the whole process was found, 4.749 MJel/kg [34].
2.3.
Modelling
2.3.1. Flows
The structure of the tomatoes chain in Souss Massa has been drawn following the study made by (S.Payen, 2016), where all the different paths that tomatoes from the gate of the farms may take are explained. They are divided into three main channels:
• Direct Market, when tomatoes are sold directly from the farmer to the local market. • Directly Delivery, when farmers are delivering directly to the packaging station. • Buyer, when is the export company that buy directly from the farm gate.
Figure 11 shows the flows of tomatoes (in Tons) over the last seven years was build using different data source provided by different local agencies [35].
Figure 11: Evolution of tomato production for export and local market
As Figure 11 shows, from 2010 to 2016, the local consumption has remained stable around 35’000 tons: this share of the production is divided between the two major wholesale market of the region, Inezganne and Oulad Teima [28]. In this study, these flows were divided using the proximity to the market as criteria, as it is explained in section .As results of this division, 89% of the tomatoes locally consumed is sold in Inezganne while the remaining 11%.
On the other hand, tomatoes destined to export are instead increasing every year, passing from 50% in 2013 to 63% in only 4 years. The quality of tomatoes for the export market requires high standard but is by far more convenient since the price per kilo of tomatoes in importing countries can reach up to 10 times the local one. Inezgane is the main hub for the tomato’s distribution, since It host both the majority of the packaging station (81 over 101) [30], followed by Taroudant that host 20% of the packaging stations of the region.
0 100000 200000 300000 400000 500000 600000 2010 2011 2012 2013 2014 2015 2016 To n s Pro d u ce d
Tomatoes Flows
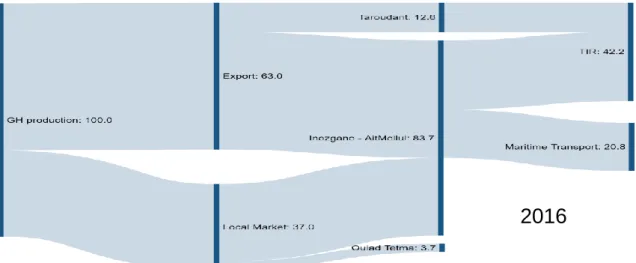
Figure 12 shows the tomato flow within Souss Massa, identifying the main destinations and ratios along 2016. Figure 13 shows the geographical distribution of the tomatoes: the red sections referrer to export quantities and the yellow to the local market quantities.
Regarding export tomatoes, once reached the packaging station, they are stored for an average of 16 hours, in conditioned room in order to preserve the quality of the product, before they are packed and sent either to the port (33%) or to the north of Morocco (66%) [32].
The industrial tomatoes production is following a completely different evolution. After a peak of production in 2011, the results of outdoor production (industrial tomatoes have to be produced outside of the greenhouse since they require low quality) shown to be insufficient and too unstable to keep the interest of the farmers. Following the trend of the production presented in the “Office Régional de Mise en Valeur Agricole du Tadla” it is possible to forecast the production of industrial tomatoes in 2017: the share of the tomatoes going to transformation rapidly fallen from 8.5 in 2010 to 0.77% in 2017, as seen in Figure 14 [36].
2016
Figure 12: Souss Massa's postharvest tomato flow
Figure 14: Evolution and projection of industrial tomato production
2.3.2. Postharvest distribution
Due to the lack of data regarding the tomato flows to the different packaging stations and local markets, some estimations were made for calculation purposes.
Local market
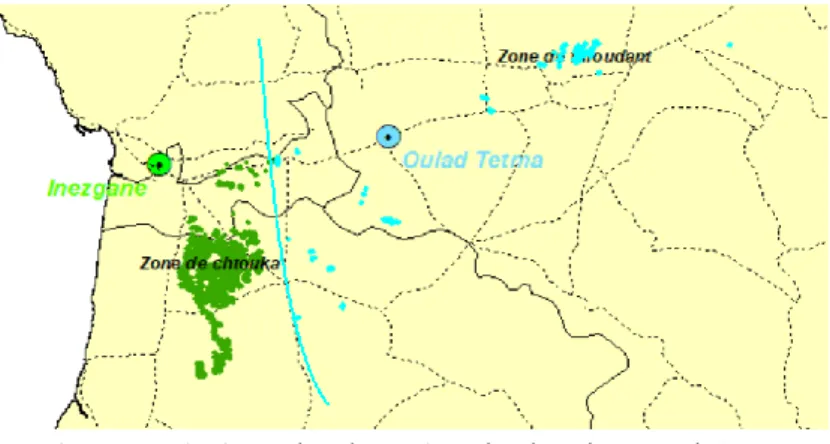
As explained in Local market section, there are 2 main local markets within Souss Massa: Oulad Teima and Inezgane. The total amount of tomatoes sold in those markets is known, although the proportion of tomatoes that each of the markets manage is unknown. To estimate this distribution, a proximity division between local markets and GHs was performed. The proportional production destined to national commerce of each of the GHs is directed to the nearest market. The calculation was carried out using ArcGIS data. Figure 15 shows the mentioned distribution, with green GHs selling in Inezgane market and blue GHs selling in Oulad Teima market. For visual illustration, a blue division line is drawn.
Under this criterion, the market of Inezgane receives and trades a considerable bigger amount of tomatoes than Oulad Teima market. Considering that Agadir (the capital and biggest city of the region) is located next to Inezgane, this distribution seems coherent.
Packaging stations
For dividing the tomato flow that each packaging station receives, they were grouped into two main areas, Taroudant and Inezgane. As Packaging and storing section explains, there are 20 packaging stations in Taroudant and 81 in Inezgane area [31]. The criteria followed in this case was to assign an equal amount of tomatoes received and processed per packaging station, ergo 20% of the tomatoes go to Taroudant and 80% to Inezgane approximately.
0 20000 40000 60000 80000 2009 2010 2011 2012 2013 2014 2015 2016 2017 To n n es Year
Production of Industrial Tomatoes
Figure 16 shows the division, with green GHs transporting their produce to Inezgane’s packaging stations and blue GHs to Taroudant’s packaging stations. For visual illustration, a blue circle is drawn separating the mentioned GHs.
2.3.3. Transport
Transportation is the main post-harvest process, moving the produce through its different steps till the consumption site. In order to calculate the energy consumed during transportation, it was identified the starting and ending point, road infrastructure, type of vehicle and refrigeration system, loading capacity, produce flow to each market and yearly total production.
Due to the special conditions of vegetables transport, the vehicle may carry a refrigeration chamber to preserve the quality, moisture and flavour of the produce.
Depending on the business scope, from local market to national or international, the transportation stage varies. In this chapter, all transportation steps are broken down with the aim of modelling them in detail.
As mentioned in flow chapter, local markets act as the big exchange of fruits and vegetables in Souss-Massa. Transfer is carried by the producers themselves or by intermediate parties, who buy the product at the production site, occasionally even contributing to part of the harvesting investment cost, and then pick up the produce and commerce it in the local market. In this study, the remaining transport from local market to its final consumers has not been considered due to lack of reliable data. Regarding exportation, the produce is carried out the country via shipping or freight transport depending on the destination country. For naval delivery, transport is divided into three phases: Farm to packaging and transformation station, packaging and transformation station to local port, port to destination port. Transportation by trucks, on land, is divided into two phases: Farm to packaging and transformation station, packaging and transformation station to export country. For both cases, the energy consumed during the transport outside Souss-Massa boundaries are not considered, in other words, maritime container transport and TIR outside of the region.
The method utilized relies on the following formulas: • Diesel Consumption during transportation
𝐿𝑑𝑖𝑒𝑠𝑒𝑙 =
𝐷 ∗ 𝐿𝑂𝐴𝐷 𝑘𝑐𝑜𝑛𝑠𝑚∗ 𝐶𝑎𝑝𝑎𝑐𝑖𝑡𝑦
Where 𝐿𝑑𝑖𝑒𝑠𝑒𝑙 are the litres of diesel consumed, D is the distance travelled, LOAD are the kgs of
tomatoes transported, and 𝑘𝑐𝑜𝑛𝑠𝑚 and 𝐶𝑎𝑝𝑎𝑐𝑖𝑡𝑦 stand relatively for the consumption factor and the
ability to transport of the specific truck used. This formula has been applied on each of the previously described flow
• The production of each farm:
𝑃𝑖,𝑦=
𝑇𝑃𝑦∗ 𝐴𝑖
𝐴𝑡𝑜𝑡
Where 𝑃𝑖,𝑦 is the production of the selected farm i during the year y, 𝐴𝑖 is its area (calculated using
ArcGIS), 𝐴𝑡𝑜𝑡 is total area of the farm in the region and 𝑇𝑃𝑦 is the total production of the relative year
y.
Once associated the relative production to each farm, it has been assumed that each farm production is destined into export and local market following the regional value:
𝑃𝑙𝑜𝑐𝑎𝑙𝑖,𝑦 = 𝑃𝑖,𝑦∗ (1 − %𝐸𝑥𝑝𝑦)
𝑃𝑒𝑥𝑝𝑜𝑟𝑡𝑖,𝑦= 𝑃𝑖,𝑦∗ (%𝐸𝑥𝑝𝑦)
Where %𝐸𝑥𝑝𝑦 is the regional export ratio during the relative year y.
Thus, the distance between each farm and its relative ending points has been calculated. The method consists in two main steps:
1. End Destination: Using different assumptions explained in previous chapters, each farm has been associated to one local market and one packaging and storing station area as ending destination.
2. Proximity Street: Using ArcGIS tool ‘’Near’’, for each farm has been identified the closest street. Thus, from the selected starting road, has been calculated the length of the path to reach the different final destinations (Figure 17)
Figure 17 Example of a transportation path
Once the inputs are analysed, it is possible to proceed with the calculation of the energy consumption in the transport of tomatoes:
𝑀𝐽𝑒,𝑇𝑟𝑎𝑛𝑠𝑝𝑜𝑟𝑡 = { 𝑇𝑟𝑙𝑜𝑐𝑎𝑙 = ∑ 2 𝐿𝐻𝑉𝑑𝑖𝑒𝑠𝑒𝑙 𝑘𝑚 ∗ 𝐿𝑜𝑎𝑑∗ 𝐷𝑙𝑜𝑐,𝑖∗ 𝑃𝑖 𝑖=3300 𝑖=0 ∗ (1 − %𝐸𝑥𝑝) 𝑇𝑟𝑝𝑎𝑐𝑘𝑎𝑔𝑖𝑛𝑔= ∑ 2 𝐿𝐻𝑉𝑑𝑖𝑒𝑠𝑒𝑙 𝑘𝑚 ∗ 𝐿𝑜𝑎𝑑∗ 𝐷𝑝𝑎𝑐𝑘,𝑖∗ 𝑃𝑖 𝑖=3300 𝑖=0 ∗ (%𝐸𝑥𝑝) 𝑇𝑟𝑡𝑟𝑎𝑛𝑠𝑓𝑜𝑟𝑚𝑎𝑡𝑖𝑜𝑛= 2 𝐿𝐻𝑉𝑑𝑖𝑒𝑠𝑒𝑙 𝑘𝑚 ∗ 𝐿𝑜𝑎𝑑∗ 𝑃𝑡𝑟𝑎𝑛𝑠𝑓∗ 𝐷𝑡𝑟𝑎𝑛𝑠𝑓
Where 𝐿𝐻𝑉𝑑𝑖𝑒𝑠𝑒𝑙 is the diesel lower heating value, 𝐷𝑙𝑜𝑐,𝑖 is the distance of the farm i from the nearest
local market, 𝐷𝑝𝑎𝑐𝑘,𝑖 is the distance from the attributed packaging area, 𝐷𝑡𝑟𝑎𝑛𝑠𝑓 is the average
distance of the open field where industrial tomatoes are produced and the transformation centre.
2.3.4.
Packaging, Storing and
Transformation
Regarding the other three energy intensities, the calculations relies on the different key factors found in the literature:
Table 2: Packaging, storing and transformation energy coefficients
𝑀𝐽𝑒,Packaging = 𝑇𝑃 ∗ %𝐸𝑥𝑝 ∗ 𝑓𝑝𝑎𝑐𝑘
𝑀𝐽𝑒,Storing= 𝑇𝑃 ∗ %𝐸𝑥𝑝 ∗ 𝑓𝑐𝑜𝑛𝑑
𝑀𝐽𝑒,Transformation= TT ∗ 𝐸𝑅 ∗ 𝑓𝑡𝑟𝑎𝑛𝑠𝑓
2.3.4.1.
From GHs to local market
The type of vehicles utilized for this purpose is small trucks, car with trailer or truck [20]. The energy coefficient of this type of vehicles is simplified to a common one, 4km/l fully loaded with 5.62 tons [37]. As every trip has a return to load again the freight vehicle and restart the journey, a different coefficient was applied as in the return trip the vehicle is empty, multiplying the previous coefficient by 1.5 to discount in fuel per km [38].
2.3.4.2.
From GHs to packaging and transformation station
The methodology implemented to estimate the energy consumption of transportation from GHs to transformation stations is the same as the previous methodology. Roads and GHs location shapefile is the same as in previous chapter as well as the mean of transport used. Packaging and transformation stations are located in Inezgane and Taroudant.
The trucks used in this stage have bigger capacity as the production is controlled by big organized companies, that control multiple GHs, therefore the pick-up of the produce is organized to cover larger number of crops per trips. The energy coefficient of these trucks is of 3.2 km/l with a 24 ton of capacity [37]. For the return trip, the same coefficient from previous chapter is applied, multiplying 3.2 km/l by 1.5.
2.3.4.3.
From packaging and transformation station to port
One of the two type of international transport utilize is themaritime transport. Souss-Massa port is placed in Agadir, being the main gateway and point of export for goods from south Morocco [39]. As previously explained, all the packaged tomato is exported, and no tomato can be exported without being enclosed in a certified package. Therefore, all the produce received and exported in Agadir port comes from the packaging and transformation stations. The location of the packaging and transformation stations was specified in previous chapter. The port of
Factors 𝑴𝑱𝒆⁄𝑲𝒈 Ref 𝒇𝒑𝒂𝒄𝒌 1.58 [32]
𝒇𝒔𝒕𝒐𝒓 0.408 [21]
𝒇𝒕𝒓𝒂𝒏𝒔𝒇 3.12 [34]
Agadir is located inside the city of Agadir, represented as a black triangle in Figure 18.
The package tomato is transported inside non refrigerated big trucks due to the proximity between the packaging and transformation stations and the port [20]. Trucks energy coefficient is the same as in previous chapter: 3.2 km/l loaded.
2.3.4.4.
From packaging and transformation station to exported country via
International Road Transport (TIR)
Although TIR is generally more expensive than the maritime, it has an important role due to its delivery time is shorter and is more reliable than its competence. Once the product is ready to be exported, refrigerated big trucks pick the produce directly from the packaging and transformation station and initiate the trip to northern countries, mainly Europe. As indicated before, the scope of this study is limited by the boundaries of the region, hence it has only been considered the transport from the packaging station to the northern boundaries of the country.
The type of truck employed is modern truck with refrigeration chamber, to preserve the quality of the produce throughout the long journey, with a consumption coefficient of 2.9 km/l [37]. Same as previous chapters, as the return trip is done with the chamber empty, a coefficient of 1.5 is multiplied.
2.3.5. Tomato Waste
Postharvest process entails a series of demanding activities that threats the final quality of the produce, generating considerable amounts of waste. The losses occur along the whole chain due to multiple factors, like interruption of the cold chain, physical damage during handling and transport, mismatch of the product with the cosmetic standards, along with others.
The only waste acknowledge after a careful investigation of the available literature on internet is the waste originated during the transportation of the produce from the farm to the packaging station and local market, produced mainly by the interruption of the cold chain. During this stage, high amount of waste is originated, rising up to 20% of the total produce transported in the worst case [35]. This high amount is the consequence of the precarious vehicle employed, generally small trucks, cars with trailer or trucks, without refrigeration chamber.
The methodology applied for calculating the total losses occurred over a year is based on stablishing the mentioned 20% waste on the longest distance travelled. As each journey from the GH to the local market and packaging station is studied separately, the waste originated during the journey is directly dependent on its distance compared to the maximum distance. The formula followed is:
𝑊𝑎𝑠𝑡𝑒𝐺𝐻 = 𝑃𝑟𝑜𝑑𝑢𝑐𝑡𝑖𝑜𝑛𝐺𝐻∗
𝐷𝑖𝑠𝑡𝑎𝑛𝑐𝑒
Maximum distance was estimated using ArcGIS, as Figure 19 shows.
After extrapolating the waste using the method explained, it is estimated that 8% of the total tomato production is wasted during this stage.
2.3.6. Grid
The electricity for transformation, storing and packaging activities is provided by the national grid.
Error! Reference source not found. shows the evolution over the last 30 years of the source of energy f
urnishing the electric grid in Morocco.
Figure 20: Evolution of Morocco's electricity mix
Domestic production only covers 85% of Moroccan consumption (2012). Morocco is a net importer of electricity (4.8 TWh in 2012), with 5.6 TWh imported and 0.8 TWh exported [40]. The majority of the electricity imported comes from Spain, which is connected synchronously by a 400 kilovolt (kV) interconnection with a 1.4 GW capacity.
Figure 20 shows the high dependency of the Moroccan energy system from fossil fuel, with an unusual large share produced directly from oil products and with coal being the major source. The share of renewable stands for 15% of the production in 2016.
Max Distance
The most distant GHs
2.3.6.1. Grid Efficiency
During the transformation of chemical/potential/kinetic/photovoltaic energy into electricity, some energy is wasted through the process due to different reasons not treated in this document. The efficiency of the grid is the result of the sum of all the efficiencies of the power plants that generate electricity to the mentioned grid. Each power plant has a specific efficiency of energy conversion depending on the type of fuel, technology, location among other variables. The formula followed to calculate the average efficiency of each type of powerplant is:
With the specific powerplant efficiency and their contribution to the electric grid, the efficiency of the grid was calculated following the formula:
Being Efgridy the efficiency of the grid, % share of total electricity production by fuel, Ef efficiency
of power generation by fuel.
The values of the shares and its evolution over the past years are shown in Figure 21.
Figure 21: Morocco's electricity production share
As Figure 21 shows, coal stands as the major fuel employed for power generation, while oil and hydro decreases and natural gas and renewable alternatives are penetrating in the market. Regarding he efficiencies of each power plant depending on the type of fuel, the values employed for the calculation are shown in Table 3 [40].
Table 3: Powerplants efficiency per fuel
Technology Efficiency Coal 0.34 Natural Gas 0.48 Oil 0.35 2009 2010 2013 2014 2015 Oil Products 20% 24% 21% 13% 7% Coal 50% 46% 43% 54% 55% Natural Gas 14% 12% 21% 19% 19% Hydro 14% 15% 10% 7% 7% Renewable 2% 3% 5% 7% 8% 0% 10% 20% 30% 40% 50% 60%
Electricity Production Share
𝐸𝑓𝑔𝑟𝑖𝑑𝑦= %𝐶𝑜𝑎𝑙𝑦∗ 𝐸𝑓𝐶𝑜𝑎𝑙+ %𝑁𝐺𝑦∗ 𝐸𝑓𝑁𝐺+ %𝑂𝑖𝑙𝑦∗ 𝐸𝑓𝑜𝑖𝑙+ %𝑅𝑒𝑛𝑦
𝐸𝑓𝑝𝑜𝑤𝑒𝑟𝑝𝑙𝑎𝑛𝑡=
𝑀𝐽𝑒𝑙𝑒𝑐𝑡𝑟𝑖𝑐𝑖𝑡𝑦
𝑀𝐽𝑓𝑢𝑒𝑙
Renewable 1
Once obtained the efficiency of the grid for a stablished year, it is possible to calculate the total megajoules equivalent used in the grid for generating the demanded power. For that purpose, the formula below was used:
Energy equivalent stands as the total energy contained within the fuel to produce the final electricity supplied into the grid- This value results valuable for the study as a standard indicator to compare the contribution of the different forms of electricity generation.
2.3.7. EMISSIONS
The calculations of the emissions of CO2 equivalent have been made using factors found in the IPCC literature (Table 4) [41].
Table 4: Emission factor per fuel
For calculating the emissions, it has been considered that 17% of the electricity from grid is generated by the coal power plant located in Agadir and the remaining imported from the national grid (shares of production in the national grid are explained in Grid efficiency chapter) [42]. The calculation of the emission relative to the electricity used from the grid and the year y is:
𝐶𝑂2𝑒𝑞,𝑦=(%𝑖𝑚𝑝∗ (𝑘𝐶𝑜𝑎𝑙∗ %𝐶𝑜𝑎𝑙𝑦+ 𝑘𝑁𝐺∗ %𝑁𝐺𝑦+ 𝑘𝑜𝑖𝑙∗ %𝑂𝑖𝑙𝑦) + %𝐿𝑜𝑐𝑎𝑙∗ 𝑘𝐶𝑜𝑎𝑙)
𝐸𝑓 ∗ 𝐸𝐶𝑜𝑛𝑠
Where %imp and %local are the share of electricity supplied respectively by the national grid and by the local production (Agadir), %Coal, %NG and %Oil are the share, during year y, of the national production of electricity, kcoal, kng and koil are the emissions factors (Table 4) and finally Econs and Ef are the energy consumption analysed and efficiency of production respectively.
Regarding the transportation emissions, since the only energy source considered is only diesel, the calculation is more immediate:
𝐶𝑂2𝑒𝑞,𝑦= 𝐸𝑡𝑟𝑎𝑛𝑠𝑝,𝑦∗ 𝑘𝑑𝑖𝑒𝑠𝑒𝑙
2.3.8. Revenues and Energy Cost
The economic impact of the different energy related activities along the postharvest chain of tomato in Souss Massa is crucial to get a general overview of the system and measure the viability of alternatives. Hence, this study analyses the energy related costs of every postharvest activity, its relevance in the total cost of the process and finally the impact on the revenues generated.
Factors 𝒕𝑪𝑶𝟐 𝑴𝑾𝒉𝒇𝒖𝒆𝒍 ⁄ 𝒌𝒄𝒐𝒂𝒍 0.364 𝒌𝑵𝑮 0.202 𝒌𝑫𝒊𝒆𝒔𝒆𝒍 0.267 𝑀𝐽𝑒𝑞=𝑀𝐽𝑒𝑙 𝐸𝑓 𝑃𝑟𝑜𝑑𝑢𝑐𝑡𝑖𝑜𝑛 ⁄
Revenue
As mentioned in previous chapters, Souss Massa tomatoes are mainly exported to a large variety of foreign countries. Therefore, the prices paid for the produce vary widely depending on the welfare of the country, the period of the year and the competence in that region. During this study it was performed a research of recent tomato prices in the main importing countries and the result was inconclusive. Different values depending on the website consulted plus the incoherence of them due to the lack of economical profit for Moroccan exporters based on those numbers, made the authors discard this approach.
Local market price was used as reference. The average price in Souss Massa wholesale market in 2015 (most recent value found) was around 0.24€/kg. This average was obtained from the evolution of the price shown in Figure 22 [43].
The average price was used for estimating the revenue obtained by tomato stakeholders
Energy cost
The energy consumption of the tomato postharvest activities in Souss Massa is divided in two sections based on the fuel utilized. Below, the criteria, assumptions, references and formulas followed are described:
• Electricity: As described in packaging, storing and transformation chapters, electricity is the unique fuel used during these processes. None of the stations consulted had local generation infrastructure, acquiring the electricity always from the grid. Based on this information, it was assumed that all the postharvest stations extracted the electricity from the grid. The cost of the energy, then, it is based exclusively on the price of the electricity at the moment that was purchased. Souss Massa’s tomato production season is mainly during winter because main import countries favour their local production over imports during warm seasons (tomato production natural season in Europe has placed in Summer) [44].
€ -€ 0,05 € 0,10 € 0,15 € 0,20 € 0,25 € 0,30 € 0,35 € 0,40
Tomato Price in SoussMassa Wholesale
Markets - 2015
Electricity cost during those months depends also on the hour of the day. Figure 23 shows the price of the electricity depending on the demand.
The hours of high and low demand are stablished following the criteria shown in Table 5 [45].
Table 5: Peak, Off-Peak and Base criteria
Assuming the production hours of the packaging, storing and transforming stations between 8am and 8pm, the average electricity price obtained is 1.7824€/MJ.
• Diesel: the transportation of tomatoes through the different postharvest stages is fully powered by diesel vehicles. To calculate the total cost of diesel per year, the average price of 0.8775€/diesel tonnes was used [46].
2.4.
Scenarios
In this section the different scenario analysed are presented.
2.4.1.
Business as Usual (BAU)
A Business as Usual scenario (BAU) was developed to serve as a reference to compare results obtained from the other scenarios. To build this scenario, the expected trend of the market, energy mix and postharvest system were modelled. BAU is based on the following assumptions:
•
High increase of tomatoes for export: The evolution of tomatoes produced for export willincrease at two speeds:
o
From 2016 to 2020: It follows the growth rate of the past 8 years, 4.7% increase per year. This recent high increase is justified due to the implementation of the Green Moroccan Plan which boosted agriculture production. As the national plan is valid till 2020, same projection is considered.Winter (from 1/10 to 31/03) Peak 18.00 to 20.00 Off-Peak 17.00 to 18.00 and 20.00 to 22.00 Base 22.00 to 17.00 Winter (from 1/10 to 31/03) Peak 18.00 to 20.00 Off-Peak 17.00 to 18.00 and 20.00 to 22.00 Base 22.00 to 17.00 Winter (from 1/10 to 31/03) Peak 18.00 to 20.00 Off-Peak 17.00 to 18.00 and 20.00 to 22.00 Base 22.00 to 17.00
Figure 23: MV and HV electricity price during Peak, Off-Peak and Base periods