The Impact of Augmented
Reality on Product
Purchase Intention in the
Swedish Eyewear Industry
BACHELOR DEGREE PROJECT
THESIS WITHIN: BUSINESS ADMINSTRATION NUMBER OF CREDITS: 15
PROGRAMME OF STUDY: INTERNATIONAL MANAGEMENT AUTHORS: Wakim, Riad Samir
Drak Al Sebai, Lara Miladinovic, Mira JÖNKÖPING May 2018
Bachelor Degree Project in Business Administration
Title: The Impact of Augmented Reality on Product Purchase Intention in the Swedish Eyewear Industry.
Authors: Wakim, Riad Samir Drak Al Sebai, Lara Miladinovic, Mira Tutor: Ozturkcan, Selcen Date: 21 May 2018
Key terms: Augmented Reality, Swedish Eyewear Industry, Retail, Smart Devices, Product Purchase Intention, Synsam.
Abstract
Background: During the recent years, the applications of Augmented Reality (AR) have increased due to advances in technology and improved accessibility of smart devices. The novel technological use of Augmented Reality is being introduced in the retail sector to create value both for retailers and customers. Through Augmented Reality, potential customers can virtually try and interact with different products on online platforms, saving both time and efforts needed to make their purchase decisions.
Purpose: The purpose of this study was to examine the impacts of Augmented Reality on Product Purchase Intentions among millennials in the Swedish eyewear industry; and whether there was a relationship between the use of the technology and the purchasing decisions of customers. Due to the novelty of AR technology and its applications in the eyewear retail industry, there is a lack of theoretical development on the impacts of this technology on purchasing intention of eyewear products.
Method: The study was based on the theory of Technology Acceptance Model (TAM), and the Unified Theory of Acceptance and Use of Technology 2 (UTAUT2). A quantitative research and an explanatory research approach were conducted and followed by surveying (103) participants belonging to Generation Y in Sweden. The AR mobile application of the largest Scandinavian eyewear retailer, ‘Synsam’ that sells various brands was utilised to carry out the research. Multiple Linear Regression was used to test for the relationship between use of AR technology determinants and the purchase intentions of eyewear products of customers.
Conclusion: The findings of this study showed that AR technology had an impact on Product Purchase Intentions. The technology characteristics that were of high importance included information about products (Product Information), virtual interaction with the product (Telepresence) and the enjoyment of using this technology (Hedonic Motivation). Furthermore, Millennials in Sweden have found that using the AR technology to be a useful method for purchasing eyewear products, and that such a technology assisted them in making their purchasing decisions. These findings are useful for managers to satisfy their customers and provide them with unique experiences through AR technology embedded in marketing channels, which serves as a powerful tool for retaining customers and building a unique competitive advantage.
Acknowledgments
We would like to acknowledge everyone who played a great role in this academic journey. First of all, our parents, who gave us unconditional love and support through out this thesis. Without them, we could never have attained this work.
Secondly, our spectacular thesis tutor, Selcen Ozturkcan, who has provided a great deal of guidance and patient advise through every step of the research process. Thank you all for the unwavering support.
Riad Wakim Lara Alsebai Mira Miladinovic
Riad Wakim Lara Alsebai Mira Miladinovic
Table of Contents
1 INTRODUCTION 1 1.1 Background 1 1.2 Problem Discussion 2 1.3 Purpose 3 1.4 Research Question 4 1.5 Delimitation 4 2 LITERATURE REVIEW 52.1 Augmented Reality and its Evolution in the Retail Industry 5
2.2 The Era of Smart Devices 6
2.3 Eyewear Retail Industry 6
2.4 Previous research on Augmented reality and Online Retailing 7
2.5 Technology Acceptance Model (TAM) 9
2.6 Unified Theory of Acceptance and Use of Technology (UTAUT) 10
2.7 Research Conceptual Model 12
2.7.1 Product information (PI) 14
2.7.2 Telepresence 14
2.7.3 Hedonic Motivation (HM) 15
2.7.4 Perceived Ease Of Use (PEOU) 15
3 METHODOLOGY 16 3.1 Research Philosophy 16 3.2 Research Approach 17 3.3 Research Purpose 18 3.3 Data Collection 18 3.4 Sample 19 3.5 Questionnaire Design 21
3.7 Reliability and Validity 24
3.8 Research Ethics 25 3.9 Synsam AB 25 4 EMPIRICAL FINDINGS 28 4.1 Reliability Analysis 28 4.2 Descriptive Statistics 29 4.2.1 Constructs 30
4.3 Multiple Linear Regression Analysis 31
4.3.1 First Regression model with “ Product Purchase Intention” as the dependent variable 31
4.3.1.1 Pearson’s Correlation Analysis 31
4.3.1.2 Normality of the residuals diagnostics 32
4.3.1.4 Multicollinearity 34 4.3.1.5 Model Evaluation of Product Purchase Intention as the dependent variable 34
4.3.1.6 Evaluation of Each of The Independent Variables 35
4.3.2 Second Regression Model with “Hedonic Motivation” as the dependent variable 36
4.3.2.1 Pearson’s Correlation Analysis 36
4.3.2.2 Normality of the Residuals Diagnostic 37
4.3.2.3 Homoscedasticity of the Residuals Diagnostics 38
4.3.2.4 Multicollinearity 39
4.3.2.5 Model Evaluation of Hedonic Motivation as the dependent variable 39
4.3.2.6 Evaluation of each of The Independent Variables 40
4.4 Hypotheses Testing 40
5 CONCLUSION 44
6 DISCUSSION 46
6.1 General Discussion 46
6.2 Revised Conceptual Model 49
6.3 Implications 50 6.4 Research Limitations 51 6.5 Further Research 52 7 REFERENCE LIST 53 8 APPENDIXES 66 Appendix I 66 Appendix II 72 Appendix III 73 Appendix IV 74 Appendix V 74 Appendix VI 78
List of Figures
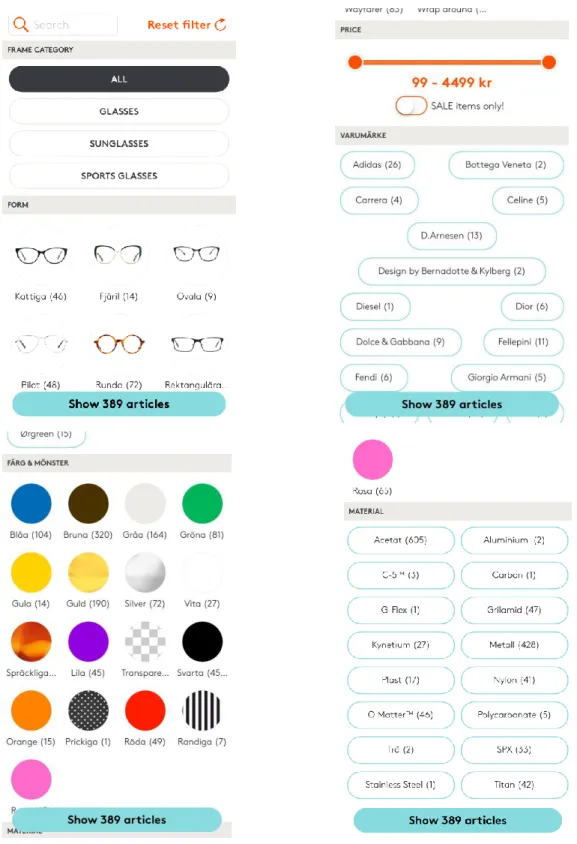
Figure 1. An illustration of mixed reality spectrum using Synsam Mobile Application 2 Figure 2. Technology Acceptance Model by Venkatesh and Davis (1996) pp.453 10 Figure 3. Research Model: UTAUT2 by Venkatesh et al. (2012) pp.160 11 Figure 4. Theoretical model with proposed constructs to Product Purchase Intention (Conceptual model) 13 Figure 5. Different filters in the App (Frame Category, Form, Price, Brand, Material, Colour and Design). 26 Figure 6. The virtual try-on after choosing a certain product, with a front and side view. 27 Figure 7. Information available after choosing the product (The Price, Payment Plans, and booking an
appointment at the nearest store). 27
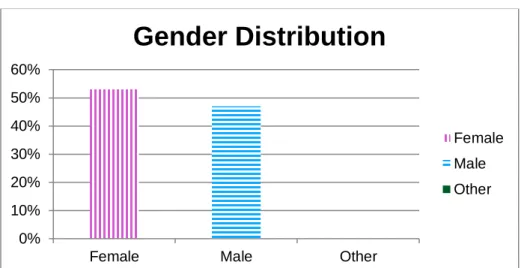
Figure 8. Gender distribution across the group 29
Figure 9. Employment status of participants 29
Figure 10. Product Purchase Intention mean & Standard Deviation 30
Figure 11. Normal P-P Plot of Regression Standardized Residual 32
Figure 12. Jarque-Bera Normality Test 33
Figure 13. Scatterplot of Standardized Residual of PPI 33
Figure 14. Normal P-P Plot of Regression Standardized Residual 37
Figure 15. Jarque-Bera normality test 38
Figure 16. Scatterplot of Standardized Residual of HM 38
Figure 17. Results of multiple regression analyses (HM & PPI each as a dependent variable) 43
Figure 18. Revised Conceptual Model 49
List of Tables
Table 1. Questionnaire Construction 22
Table 2. Reliability of Constructs 28
Table 3. Descriptive Statistics of the Constructs 30
Table 4. Pearson correlation analysis 31
Table 5. Multicollinearity Diagnostics 34
Table 6. Multiple Linear Regression analysis (Beta coefficient and Sig. value) 36
Table 7. Pearson correlation analysis 36
Table 8. Multicollinearity Diagnostics 39
1
Introduction
__________________________________________________________________________ The purpose of this chapter is to introduce the reader on the topic of Augmented Reality (AR). Primarily, the background to the technology of Augmented Reality and its uses in online retailing is explored, and then the problem discussion of the literature gap is conferred. Lastly, the research question, purpose and the delimitations of this study will be presented at the end of this chapter.
1.1 Background
According to Cerf (2014, p.7), “Whoever thinks computer science is boring has not been paying attention”. As the gradual but definitive progress of technology continues to impact online shopping, it becomes imminent that online apparel retailers will have to adopt new technologies to enhance their web efficacy and boost their sales (Yaoyuneyong, Foster & Flynn, 2014). There has also been seen growth in online purchasing, which is expected to continue in the future (Tiago, Alhinho, Rita & Dhillon, 2017; Lee, Sujin & Zachary, 2017). Likewise, customers are increasingly trying the products in physical shops and then decide to buy them online, or research online before purchasing them in stores (Ankosko, 2012; Kisseberth, 2014).
Mobile phones, tablets and wearable devices are increasingly becoming more popular tools for interaction rather than desktop-based communication (Nieuwdrop, 2007). Users now are increasingly interacting through pervasive computing, that can occur at any location, format or time (Ebling, 2016; Jungum, Mohamudally & Nissanke, 2016). The real and digital worlds are integrated into one, which enables new technology applications and businesses to be established (Olsson, Lagerstam, Kärkkäinen & Väänänen, 2011).
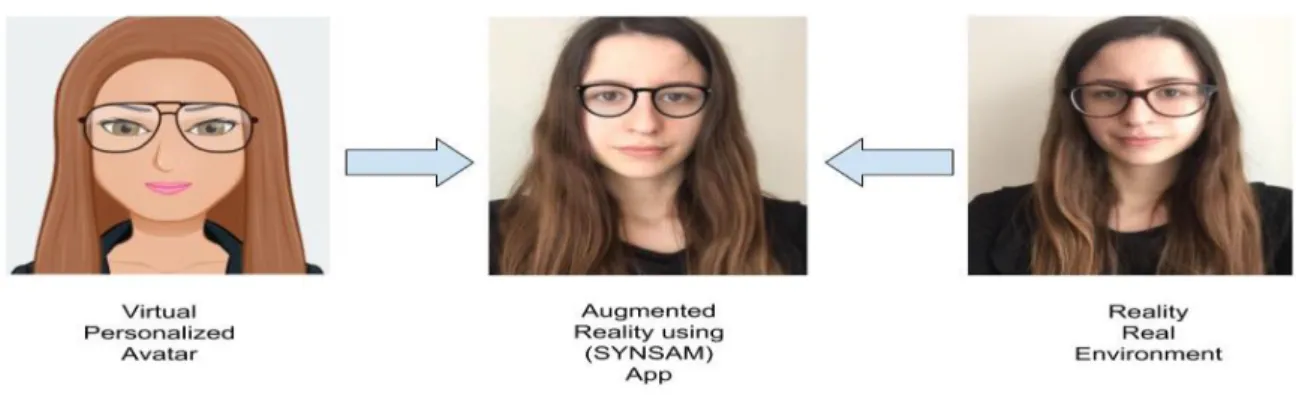
Augmented Reality (AR) is a concept of bringing parts of the virtual world into people's perception by using a device to enhance their environment. AR is sometimes misunderstood with the idea of Virtual Reality (VR). Unlike VR that requires a user to inhabit a completely virtual environment, AR uses the user’s natural environment and overlays virtual information on it, thus enhances the real world. Hence, AR is closer to the real environment, as opposed to VR (Milgram & Kishino, 1994).
Figure 1 Demonstrates an illustration of how the mixed reality spectrum is formed. The image on the left was created using a VR inducing platform that creates a virtual avatar using a virtually implemented eyewear product. On the other hand, the image on the right shows a real environment situation of the participant trying on an eyewear product. The picture in the middle is a mixed reality (Augmented Reality), which is created using a smart device App of the Swedish eyewear retailer ‘Synsam AB’. This image is a combination of a real environment (the participant's real face) and a virtual input (the eyeglasses) creating a mixed AR (Lamantia, 2009).
Figure 1. An illustration of mixed reality spectrum using Synsam Mobile Application
1.2 Problem Discussion
The implications of AR have increased during the recent years due to the accelerated technological advancement and the higher accessibility of users to smart devices, compared to before (Javornik, 2016; Carmigniani et al., 2011). AR is not only introduced in fields such as tourism, education, medicine and military but also in businesses; where it has been used as a marketing tool to deliver products to consumers (Kim & Forsythe, 2008). Moreover, by using the technology of AR customers can try different products and assess alternatives on various platforms, therefore, saving time and efforts while having the ability to compare prices (Carmigniani et al., 2011).
Although online shopping has many perks compared to in-store shopping, customers do not have a physical interaction with the items nor a two-way communication, which might hinder their willingness to buy the products online (Beck & Crié, 2018). As a result, businesses tend to face a more significant challenge in how to reach out for customers, influence their online shopping experience and try to have a positive effect on consumers’
AR has been used in both high-involvement and low-involvement products. Eyewear products, for instance, are considered high involvement products in which consumers spend more time and put more efforts on assessing alternatives as well as gathering information compared to low involvement products. Therefore customers tend to be more critical while choosing such products (Kim & Forsythe, 2008; Zaichkowsky, 1985). Whereas buying low-involvement or fast fashion products such as daily clothing is accompanied by lower risk since they have lower price tag compared to high-involvement products. Thus, customers put fewer efforts when evaluating such alternatives (Hasan, Subhani & Osman, 2012). According to Huang and He (2011), e-tailing is defined as a short term for “electronic retailing”, and it was defined as the process of selling products online instead of stores. The novelty of the AR technology and its implications particularly in e-tailing raises awareness to investigate more on this topic to gain a thorough understanding by addressing the existing literature gaps. The application of AR in the eyewear e-tailing industry and how could its implications influence the product purchasing intention of customers will be further studied in this paper. Previous research papers (Pantano, Rese & Baier, 2017; Javornik, 2016; Schwartz, 2011) have touched upon the topic of applying AR and how it affects customer behaviour. However, those papers directed their studies towards specific countries (Germany and Italy), while focusing their research on a single brand (Ray-Ban), rather than the overall market, and websites were the primary platform of application that was used.
A significant gap is noticed, and further research is needed to examine this relation in countries that were not investigated before using various eyewear brands as well as using an AR mobile application on smart devices rather than websites. Therefore, this study will concentrate on the Swedish market, since it was not examined earlier. Moreover, and for the sake of studying many brands instead of one, the mobile application of one of the most prominent Swedish retailers that sell various brands, ‘Synsam’, will be utilised while carrying out the study (Cvc.com, 2018). Hence, this paper could be considered as an original and an unprecedented work that contributes to the existing literature.
1.3 Purpose
The purpose of this research was to investigate the impact of AR in smart devices in the Swedish eyewear industry on Product Purchasing Intention (PPI) of consumers. Whether there was any direct relationship between the use of such technology and the buying intentions of an eyewear product was investigated. This paper focused on millennials in Sweden as a targeted population (Generation Y) and went in depth to investigate what are the AR technology determinants that best explain this relation. A theoretical framework was utilised, along with a progressive course of hypothesis and relationships in order to map the path between augmented reality in the eyewear industry and PPI. This theory along with hypotheses were analysed and examined through a quantitative empirical study to determine if this technology signifies purchasing intention of an eyewear product or not.
1.4 Research Question
RQ1: Does AR have a positive impact on the Product Purchase Intention in the Swedish eyewear industry among millennials in Sweden?
RQ2: If so, what are the AR technology determinants that have a positive impact on the Product Purchase Intention of eyewear products among millennials in Sweden?
1.5 Delimitations
A delimitation of this study was that it focused on the eyewear retail industry and its products, not on other retail sectors. Likewise, this research concentrated on the AR mobile application in the eyewear retail industry and its effect on Product Purchase Intention. Hence, other AR platforms in the industry such as websites and augmented mirrors were not investigated in this study (Pantano et al., 2017; Fera, 2014; Kugelmann et al., 2018).
This research was also limited to examining certain technology characteristics that may directly affect Product Purchase Intention through AR mobile applications. Hence, indirect or second-line constructs that might also have influenced PPI in the eyewear industry were not included in this research.
Furthermore, this study focused on effects of AR in smart devices on Product Purchase Intention of generation Y or the millennials in Sweden through surveying students at Jönköping University. Therefore, the results of this study could not be generalised on other generations or the population of Sweden as a whole (Graziano & Raulin, 2004; DePoy & Gitlin, 2005). Likewise, since the sample consists of millennials in Sweden, it may not be accurate for other nations due to cultural or economic differences (Tarhini, 2013; Polit & Beck, 2010).
2
Literature Review
The following frame of reference is elaborated and presented. It firstly discusses the technology that lies behind AR and its significance in the retail industry, and then the authors amplify the relevance of smart devices and the reasons behind investigating AR with the focus on smart devices. Secondly, the eyewear industry is reviewed and its presence in e-commerce is investigated. Moreover, The subsequent sections will discuss the previous research that has been conducted in this field, its focuses, and its limitations. From this perspective, further analysis of relevant frameworks is conducted and a model adapted to various motivational factors is constructed.
2.1 Augmented Reality and its Evolution in the Retail Industry
AR is a series of technologies that integrate virtual inputs with the real world by that enhancing the reality (Lamantia, 2009). AR is based on mechanisms developed for Virtual Reality (VR). However, it does not outplace the realness of the surrounding environment, but it applies the real environment as a background (Fonseca, Martí, Redondo, Navarro & Sánchez, 2014). The specification of AR that distinguishes it from current models of Virtual Reality (VR) is the feature of generating a “mixed reality” wherein the actual surrounding environment is real. However, the objects illustrated in this environment are virtually implemented (Cho & Schwarz 2010; Drascic & Milgram 1996). On the other hand, VR is an environment that is entirely formed by a synthetic set-up, in which it can mimic the real-world environment without having any real construct (Milgram & Kishino, 1994).
AR is considered to be one of the smartest and most recognised approaches that have the potential to create value for both retailers and customers (Huang & Liu, 2014; Pantano, 2014). The smart technology is said to add value to retailers by influencing customer engagement and customer decisions (Pantano, 2009). Nevertheless, applying this technology to retail industries boosts online customer experiences (Pantano & Timmermans, 2014), giving them a unique and meaningful involvement by allowing them to make decisions with more information and hence more certainty (Oh, Yoon, & Shyu, 2008). The lack of knowledge and inadequate product specifications restricts customers from making risky purchases, but AR can atone for this inadequacy of inputs, by creating a three-dimensional augmented stimulation of the products integrated with the shopper's environment, which allows buyers to better evaluate desired products (Kim & Forsythe, 2008).
Moreover, for many different products AR gives customers the possibility of trying on products that they never tried on before since the technology allows for fast and easy application, this offers customers the opportunity to experiment many more options that they would not normally consider while shopping (Drugstorenews, 2017). Lastly, other previous research has shown that AR can significantly increase the user's willingness to buy and hence influence their purchasing decisions in a way the traditional shopping platforms cannot attain (Poushneh & Vasquez-Parraga, 2017).
2.2 The Era of Smart Devices
Smart devices are personal communication tools that include smartphones, tablets, and smart wearable accessories that shifted multitasking from an industrial environment to an advanced smart environment at home or in the office (Zhang et al., 2013). Smartphones, in particular, have become an inseparable part of our daily lives, and according to Poushter (2016) smartphone ownership rates around 68% in advanced economies, and around 37% in emerging economies, which makes these tools an optimum mean of communication and interaction with people worldwide. Moreover, smart devices are considered a dream appliance for the developers of augmented reality, since the main input modules required to drive Augmented Reality are already built-in in these devices, this includes GPS sensors, camera and gravity sensors (Oh, 2014).
According to Dacko (2017), Mobile AR provides benefits that cannot usually be attained in a shopping experience, and most users of such smart apps expect them to be mainstream in the next five years, making it evident for retailers that investment in such technology is crucial for further growth. Mobile AR apps using smart devices are mobile services that progressively liberate customers from time and place constraints (Benou & Vassilakis, 2010). Therefore, discovering the different methods that mobile AR apps are used in retail can grant a great deal to the advancement of further theory and frameworks that would take the retail industry to a whole new level.
In this research, AR is thus appropriated to be a live mobile view of a real-world background whose aspects are being augmented by computer-generated inputs. Mobile AR on smart devices gives the users real-world surroundings, the advancement of being highly interactive and digitally malleable, detached from time and place restraints (Chen, Tsai, Vedantham, Grzeszczuk & Girod, 2009).
2.3 Eyewear Retail Industry
Retail Eyewear is divided into three different categories; Prescription Glasses, Sports-Oriented Sunglasses, and Frame Sales (for both fashionable sunglasses and prescription glasses) (Gailmard, 2008). According to a market research report that was carried out by Sperduto (2017), stated that the global eyewear market was worth 102.66 billion US Dollars in 2015. The increasing dependence on electronic gadgets has led to eyesight related issues, and the increase in the elderly population, are expected to increase the eyewear market significantly, making the eyewear one of the most prosperous markets in retail (Sperduto, 2017).
Just as the textile industry, the eyewear industry faces the challenge of being innovative and trendy as well as being customised in accordance with the different facial dimensions of the populations in various countries. Moreover, the challenges in the eyewear industry are more sophisticated since eyeglasses are used as a medical solution that requires specific criteria that differs from a state to another. Hence, high-involvement products face a more complex challenge compared to low-involvement products due to the development of the industry and the necessity of products customisation, medical standards, and aesthetic appearance (Montalto, Graziosi, Bordegoni & Di Landro, 2016).
Due to the ageing population, the Swedish eyewear market is expanding at a rate of five to eight percent per year and is worth 357 million euros (Challinor, 2004). The number of eyewear users is estimated to be five million in comparison to the whole population in Sweden, which is nine million. Last but not least, there are 800 to 850 optical selling points spread around Sweden (Challinor, 2004).
2.4 Previous research on Augmented reality and Online Retailing
Pantano, Rese and Baier (2017) have investigated consumer behaviour when using AR during online shopping. The outcomes of this study (Pantano et al., 2017) could be used as a blueprint for businesses to understand how and what technological characteristics to focus on when setting their online platforms, to take advantages of their implications. Hence, they can effectively exploit the technology of AR and impact their consumers’ behaviour positively. This study (Pantano et al., 2017) serves as a starting point for marketers since it investigated consumers’ motivation to interact with online products. As a consequence of this interaction, the consumer’s buying decision was proven to be influenced positively, since the utilisation of AR facilitated their buying decision. Moreover, these results could aid in constructing the marketing strategies following the economic context of the country where the company operates. The results depicted that consumers from diverse economic conditions appreciated the implication of AR and found it as a convenient tool in which it provides consumers with the ability to try the products and checking if they fit their needs or not; hence, making the right selection choice (Pantano et al., 2017). On the other hand, there are differences between countries when it comes to preferences regarding the elements of enjoyment while others focus on the usefulness of the platform and the quality of the information provided.
Another study that was carried out by Huang and Liao (2014) tested the same technology acceptance variables (usefulness, aesthetics, service excellence, playfulness, ease of use). This test was developed to examine the factors that make the consumer’s relation more sustainable when using AR. However, this study linked the level of user’s cognitive innovativeness and the using intentions with the previous technology acceptance framework. Moreover, they suggested that these two factors are connected to the continuity of the usage of this technology. People with high cognitive innovativeness sense the perk of accomplishing tasks when using advanced technologies, while people with lower cognitive innovativeness lack the ability to recognise the usefulness of this technology when solving tasks. This study found that users with higher cognitive innovativeness value usefulness, aesthetic quality and service excellence to accomplish a sustainable relationship with retailers. On the other hand, users that have lower cognitive innovativeness concentrated on playfulness and ease of use (Huang & Liao, 2014).
Beck and Crié (2018) established that the existence of Virtual Fitting Rooms on a retailer’s website as a sales aid increase the curiosity of customers, therefore influencing their exploratory behaviour and their buying intentions online and in-store. Furthermore, Schwartz (2011) initiated a study to check if there is a direct interaction between AR and the purchasing intention of consumers in the retail industry. The application of AR provides more product information, and the direct interaction increases the product knowledge, thus, boosting the purchasing probability. However, Dacko (2017) examined the positive role of mobile applications on the consumer’s shopping experience by ensuring that the bought item is what the consumer wanted. Consumers attained both extrinsic benefits such as efficiency and better shopping value, as well as intrinsic benefits like entertainment when using mobile applications.
Rese et al. (2017) carried out a study on four different mobile applications in which two have a virtual mirror (marker-based) while the others used a combination with products catalogue (marker-less). Marker-based applications such as Ray-Ban proved to have a greater enjoyment effect on perceived usefulness; however, marker-less applications like IKEA were found to have informativeness on perceived usefulness. The study concluded, that marker-less applications surpass marker-based ones in terms of recommendations and using intentions, since they are more informative and can be used to get further knowledge on the products.
On the other hand and according to Poushneh, Vasquez-Parraga and Arturo (2017), AR Technology could have adverse effects on customers if there is a variance between the anticipations they have in mind about this technology compared to the experience they gain after utilising it. For instance, if the quality of AR is low or customers cannot interact and get a quick response while using this technology, then customers will not enjoy their experience. Hence, the less the interactivity of the customer's, the less the probability of the customers getting positively affected by the AR technology.
A common point was found in the studies mentioned above; likewise, in Javornik (2016) and Pantano (2009), they indicate the importance of creating a pleasant experience for customers through a more realistic and interactive design to make it extra beneficial for users. As well as, grant more information to customers in which the risk is reduced. Nevertheless, providing vivid experiential perks while reducing the gap between online and in-store selling, would make the implications of AR appealing to a limitless number of consumers. Moreover, all prior studies agreed on the potential that this technology would have on consumers, and its ability to influence their buying intentions.
However, after conducting the preceding thorough research on previous peer-reviewed studies in the field of interest, the authors discovered a significant gap in these papers. It was found that no previous study examined the purchasing intentions of customers while using AR mobile application in the eyewear industry. Thus, the effects of this technology on this specific retail sector is seen to be of high importance, and the need to examine its outcomes is of great value, to help guide businesses into more progressive and effective practices.
2.5 Technology Acceptance Model (TAM)
End-user technology acceptance is one of the prominent areas in various systems research, and this is mainly because consumer acceptance is a vital aspect of the market success of any rising technology (Sutherland, 1964). According to Davis (1986, 1989), Technology acceptance model (TAM) suggested the factor that motivates users to use a system is best described by the users' Attitude towards using (AT). Both Perceived Usefulness (PU) and Perceived Ease Of Use (PEOU) explain AT, and TAM is seen to be a direct predictor of Behavioural Intentions to use (BI) an innovative system. Numerous empirical studies have stated that TAM frequently explained a substantial amount of the variance of behavioural intentions of use (around 40%) and that the model approvingly agrees with alternative models such as the Theory of Reasoned Action (TRA) and the Theory of Planned Behavior (TPB) (Venkatesh, 1999).
However, TAM as a framework has often been criticised due to its modesty, and its likelihood to turn the research target away from “design and implementation based antecedents” (Benbasat & Barki, 2007, p.212). Hence, the TAM framework was enlarged with different variables that add antecedents to PU and to PEOU, e.g. the TAM2 and TAM3 models (Venkatesh & Davis, 2000; Venkatesh & Bala, 2008) that were focusing on different features of different Information Technology (IT) systems.
Figure 2. Technology Acceptance Model by Venkatesh and Davis (1996) pp.453
Perceived Ease of Use (PEOU) is defined as the extent of how much this application is user-friendly, effortless to utilise or learn how to work with. PEOU could be measured by many factors; one of them is the number of instructions that should be read by users. Perceived Usefulness (PU) represents the user’s acknowledgement on how much added value this system has for the user, and how convenient it is while using. Attitude towards using (AT) describes the user’s evaluation of the system’s quality and the features it has, Finally, Behavioural intentions (BI) indicate the degree of the user’s tendency to utilise the system (Pantano et al., 2017).
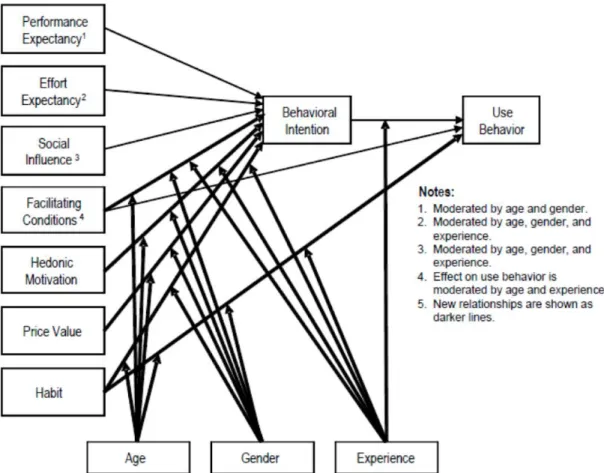
2.6 Unified Theory of Acceptance and Use of Technology (UTAUT)
There are several theoretical models that try to explain individual acceptance and use of technology. A combination of eight of these models, including the TAM model have resulted in the Unified Theory of Acceptance and Use of Technology (UTAUT) by Venkatesh, Morris, Davis and Davis (2003). Since it was introduced, UTAUT has been used as a framework applied to many studies of acceptance and use of technologies (Venkatesh, Thong & Xu, 2012). The UTAUT suggests four key factors that influence technology-use intentions. These factors include first, performance expectancy or the benefits gained when using technology. Effort expectancy or the ease associated with the use of the system is the second key factor, followed by the social influence as the influence of others on individuals technology use. Facilitating conditions or the availability of resources to aid the use of technology is the last key factor that influences using intentions (Venkatesh et al., 2003).
Perceived Usefulness Perceived Ease of Use Attitude towards use Behavioral Intentions
The first three constructs are direct determinants of behavioural intention. However, the fourth is a direct determinant of use behaviour as seen in Figure 3. According to the theory, Gender, Age and Experience moderate the impact of the four factors on the usage intention and behaviour (Venkatesh et al., 2003). The UTAUT model has been later extended to UTAUT2 due to gained popularity and to better suit different contexts (Figure 3). UTAUT was extended by the addition of new constructs that help explaining user intention (Venkatesh et al., 2012). The three new constructs include Hedonic Motivation defined as the ‘fun or pleasure derived from using a technology’ (Venkatesh et al., 2012), Price Value or the tradeoff between benefits and monetary cost of the technology use (Dodds, Monroe & Grewal, 1991), and Habit or the extent individuals perform behaviours due to prior learning (Limayem, Hirt & Cheung, 2007).
The UTAUT2 offered a significant improvement to the variance explained by technology acceptance of users (from 56 to 74 percent) and use (from 40 to 52 percent) (Venkatesh et al., 2012). The key limitation of the model is that it focuses on a single task at a given point in time. However, longitudinal studies have been suggested to provide better generalisations (Williams, Rana & Dwivedi, 2015).
2.7 Research Conceptual Model
Intentions in the retail industry using e-commerce digital-apps and websites was analysed through various theoretical frameworks in previous research (Pantano et al., 2017; Huang & Liao, 2014; Beck & Crié, 2018; Rese et al., 2017; Vijayasarathy, 2004; Venkatesh et al. 2012). Among the most discussed is the Technology Acceptance Model (Davis, 1989) in Figure 2, as well as the Unified Theory of Acceptance and Use of Technology 2 (UTAUT2) in Figure 3 (Venkatesh et al. 2003). The TAM model was developed to explain the phenomenon of the use of technology in determining different behavioural intentions, both from psychological and sociological points of view (Davis 1989). Various previous empirical findings had shown that TAM is a robust model for the acceptance of new technologies (Gefen & Straub, 2000). On the other hand, the UTAUT model had been a popular theoretical choice in the field of information and communication technology, which explained acceptance and usage of technology by employees (Williams, Rana, Dwivedi & Lal, 2011). The UTAUT explained a substantial amount of employee behaviour intention and technology use (Venkatesh et al. 2003). Additionally, it has also been applied to the consumer context in many studies, which had later lead to the development of UTAUT2 to specifically explain consumer acceptance of information and communication technologies (Venkatesh et al. 2012).
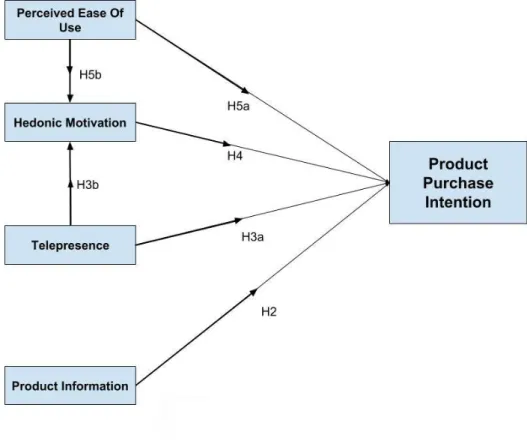
The developed model (Figure 4) is constructed using the two frameworks that were mentioned earlier. The purpose of this study is to examine the intentions to purchase an eyewear product using AR technology, which will focus on four main constructs; Perceived Ease of Use, Hedonic Motivation, Product Information, and Telepresence. Since these variables are excessively studied in the previous related literature as the leading AR technology characteristics and are said to be significant determinants of attitudes and intentions (Pantano et al., 2017; Rese et al., 2017; Vijayasarathy, 2004; Schwartz, 2011; Huang & Liao, 2014).
Product Purchase Intention (PPI) is seen as the intention to purchase a product (Fiore, Kim & Lee, 2005). In this study, PPI is defined as the intention of a consumer to buy a product using AR technology on a smart device, regardless of the chosen retailer or provider. This definition will allow the study to examine the effects of AR on the purchase intention of eyewear products, irrespective of external market factors.
Primarily, this model will discover whether AR has a positive effect on the purchase intention of an eyewear product, answering the research question that was introduced earlier. Virtual model technology is seen as a tool that enhances customer purchase intention when shopping online (Fiore et al., 2005). Nevertheless, when examining the effects of AR on purchase intention in retail Schwartz (2011) discovered no significant impact of the former on the latter. However, these assumptions were based on a low involvement product. The authors suggested the possibility that a high involvement product might lead to a positive purchase intention and assumed that their results might be product specific and hard to generalise on different apparel (Schwartz, 2011). Consequently, this research implies that AR technology imposes a positive effect on the intentions of eyewear customers to purchase a product through four different technology characteristics. Thus, Hypothesis 1 is as follows: H1: The interaction with the product via using AR application leads to a positive intention to purchase an eyewear product.
Figure 4. The Theoretical model with proposed constructs to Product Purchase Intention (Conceptual model)
2.7.1 Product information (PI)
Kim and Lennon (2008) found that despite the importance of the visual presentation of a product, product information nonetheless is very critical to positively influence online consumers to purchase a product. Increased product information also resulted in more knowledgeable customers that can take more informed decisions (Cook & Coupey, 1998; Glazer, 1991).
Internet shopping is often associated with a higher level of risk or uncertainty due to the incompetence of the platform to provide a physical inspection of the product (Park, Lennon & Stoel, 2005), and this risk has an adverse effect on the behaviours and intentions (Kim & Lennon, 2000). As a solution to this risk, the higher level of product information available acts as a risk-reducing strategy that combats the high risk associated with online shopping and hence has a positive effect on shopping outcomes (Kim & Lennon, 2000). Park et al. (2005) have found that product presentation and information has a direct positive impact on the apparel purchase intention of customers. Hence, Hypothesis 2 is as follows:
H2: Eyewear product information has a positive effect on Product Purchase Intention.
2.7.2 Telepresence
Presence and Telepresence are Two terms that have been utilised reciprocally by previous researchers (Mollen & Wilson, 2010; Huang & Liao, 2014; Steuer, 1992; Schwartz, 2011). According to Steuer (1992) and Witmer and Singer (1998), presence was defined as the experience of being located in an environment or a place even though that person is physically situated in a different location. While, Telepresence is built on the former definition and it means being present in an environment with the help of a communication medium (Steuer, 1992).
It is of great importance for this research to include the term “Telepresence” in the framework since there is no physical interaction between the product and the consumer. Hence, the retailer’s ability in delivering the products to the consumer with the usage of the AR technology is crucial to be examined. Moreover, previous related studies have found Telepresence to have a significant effect on the purchasing intentions and attitudes of consumers purchasing online (Fiore et al., 2005; Schwartz, 2011; Huang & Liao 2014). Thus it is assumed that Telepresence positively affects Product Purchase Intention, hence, Hypothesis 3a is:
Moreover, Former studies found a connection between Telepresence and Hedonic Motivation (HM) (Sautter, Hyman & Lukosius, 2004; To & Sung, 2018). The better the ability of the retailer to deliver the store environment, the higher the consumer enjoyment factor is; meaning that the better the Telepresence, the higher the hedonic motivations (Fiore et al., 2005). Thus, Hypothesis 3b is:
H3b: Telepresence has a positive effect on Hedonic Motivation.
2.7.3 Hedonic Motivation (HM)
Another factor that was added to this framework is HM. It is the extent of perceived enjoyment, fun and pleasure that online shopping experience gives consumers (Rese et al. 2017; Babin, Darden & Griffin, 1994). Previous studies found that enjoyment and hedonic factors are vital factors when it comes to using of a new technology (Childers, Carr, Peck, & Carson, 2000; Brown & Venkatesh, 2005), and had a direct impact on purchasing intention and decision-making (Venkatesh et al., 2012). Hence, Hypothesis 4 is as follows:
H4: Hedonic motivation has a positive effect on Product Purchase Intention.
2.7.4 Perceived Ease Of Use (PEOU)
PEOU is explained as the “degree to which a person believes that using a particular system would be free of effort” (Davis, 1989). The word ‘Ease’ in this factor is defined as “the freedom from difficulty or great effort”. An effort is an unlimited resource that could be allocated by an individual to a specific activity (Radner & Rothschild, 1975). According to Gefen, Karahanna and Straub (2003), PEOU was found to directly impact the user's intentions when using new technology. Nevertheless, a technological application that is perceived to be easy to use has a higher chance of being accepted by users (Davis, 1989). On a study case on AR effects on consumer intentions, PEOU was found to be a significant variable determining user intentions (Vijayasarathy, 2004). Lee, Fiore, and Kim (2006) also found that PEOU had a critical effect on deciding behavioural intentions of online customers. Given these findings and the significance of PEOU in accepting new technologies, Hypothesis 5a is as follows:
H5a: Perceived Ease Of Use of the AR application positively affects the intention to purchase a product.
Nevertheless, according Davis, Bagozzi, and Warshaw (1992), empirical findings supported a robust positive relationship between PEOU and hedonic values; the easier the use of a particular application implied that users would enjoy the experience a lot more. Hence, it is hypothesised that:
H5b: Perceived Ease of Use of the AR application has a positive effect on Hedonic Motivation.
3
Methodology
__________________________________________________________________________ The purpose of this chapter is to present the methodological approaches used for this research. Primarily, the research philosophy that underpins author’s assumption is justified, followed by the research approach and purpose. Then, the methods of data collection and sampling are described. Furthermore, the questionnaire design and data analysis methods are presented, followed by reliability and validity discussion as well as ethics in this research. Lastly, the company of Synsam AB and its online AR mobile application is discussed and explained.
3.1 Research Philosophy
The research philosophy that was adopted holds significant assumptions on the way the world is viewed as a whole, which in return underpinned the research strategy and the methods chosen (Saunders, Lewis & Thornhill, 2009). As business and management researchers need to be conscious of the philosophical choices they make since such decision will have significant effects on how they reach an understanding of what is investigated (Saunders et al., 2009). However, the more critical aspect was defending the reasons behind the adopted philosophy in relation to other philosophies that could have been selected (Johnson & Clark, 2006).
Alavi and Carlson (1992) have found that the philosophy that was widely applied and popular in Information systems was Positivism. Moreover, many links between Positivism and the field of social sciences as well as business studies were found (Orlikowski & Baroundi, 1991). Positivism as a research philosophy argues that social sciences should deal with common methodological principles that deal with facts and observations, and not values. The philosophy also states that the inquiry should be based on scientific observations, and therefore on empirical methods (Gray, 2014). The positivist usually adopts a framework for research by using existing theories, from which hypotheses are then developed and tested (Saunders et al., 2009).
This study used the positivism philosophy for researching AR’s impact on Product Purchase Intention, as it used existing theories and previous studies. The current research found on this topic provided a base on which the hypotheses and constructs were derived, and which will be either confirmed or rejected (Saunders et al., 2009).
Likewise, according to the positivist philosophy the research builds on what has already been known or studied and can be observed and measured objectively. For example,” Even Einstein’s radical theories are a development from Newton’s” (Walliman, 2011, p.21). Therefore, the findings of this research should apply to certain generalisations and should allow other people to replicate it (Welman, Kruger & Mitchell, 2005). Hence, the positivist philosophy calls for quantitative data that can be statistically analysed to make generalisations (Saunders et al., 2009).
3.2 Research Approach
The aim of the literature review varies in accordance with the research approach that is going to be applied by the researcher (Saunders et al., 2009). If the researcher is planning to use the inductive approach, he/she commences with looking into the data he/she has, and later derive new theories relying on the data examination results (Ade Bilau, Witt & Lill, 2018). Hence, it is more interpretivism (Easterby-Smith, Thorpe & Jackson, 2008). While if the deductive approach is going to be applied, first the researcher uses the theories that were found in previous literature and uses them to develop hypotheses to subsequently test them using the collected data (Ade Bilau et al., 2018).
The research approach needed to be linked to the previously chosen research philosophy (Malhotra & Birks, 2006). Since a quantitative approach was more likely to be associated with a deductive approach, this approach was used (Greener, 2008). The study built on previous theoretical framework found in the literature review and focused on expanding the current frameworks in different settings.
The constructs used and the hypotheses developed were based on previous research. The proposed conceptual model was designed from TAM and UTAUT2 models using earlier studies on AR in the retail context. By testing the theory in a new setting, the research contributes to the existing research (Malhotra & Birks, 2006). This paper examined a developed conceptual, theoretical model that adjusted to different settings of AR mobile applications in the eyewear industry, and within individuals belonging to generation Y in Sweden.
Nevertheless, Quantitative research quantifies observations and findings and analyses them through mathematical relations using statistical methods, while a qualitative approach involves the collection of descriptive data and analysing it through interpretative methods (Greener, 2008). Furthermore, according to Curwin and Slater (2007) quantitative approach allows for higher accuracy in the results it provides when it is compared to the qualitative approach since it studies a larger sample which makes it applicable to generalisations. Nevertheless, Scholars (Polit & Beck, 2008; Steen & Roberts, 2011) assert that the Positivist philosophy is linked to quantitative research. Therefore, This study used the quantitative method that goes in line with the positivist research philosophy, which was statistically analysed and tested for hypotheses.
3.3 Research Purpose
The research purpose was to answer the introduced research questions; this could be achieved by enforcing different forms such as exploratory purpose, which was to discover new insights or to give a better understanding of a phenomenon. A descriptive purpose could also be used; which is to depict the features of a phenomenon or individuals. An explanatory purpose is another form that finds relations or effects of different constructs in a tested situation (Kothari, 2004). Thus, this research adopted an explanatory purpose, to discover the effects or impact of using AR technology on the Product Purchase Intention in the Swedish eyewear industry, and what technology characteristics cause such impact, if it occurred.
With regards to the time constraints, the research can either take a cross-sectional or longitudinal format (Saunders et al., 2009). Most academic research on social sciences tend to be cross-sectional as they are usually completed in a limited time. Longitudinal studies on the other hand typically need external funding to protract the extended time period (Greener, 2008).
Cross-sectional studies are used to gather information at a single point in time, and such studies would be able to determine the impact of a certain factor on another (Macdonald & Headlam, 2008). Since our research did not study change or development over time, it did not require a longitudinal time horizon (Saunders et al., 2009) Therefore, according to the time constraints, the means available in conducting this research, and the purpose of this research, the cross-sectional time horizon was used.
3.3 Data Collection
To make the data in this research more reliable, a combination of both primary and secondary data was to be utilised (Saunders et al., 2009). The collection of the primary data depends on the research approach to the research if it is qualitative or quantitative. If it is quantitative, then the applied strategies to gather primary data are experiments or surveys. While if the qualitative approach is being carried out, researchers can gather primary data by doing intensive interviews attaining a significant amount of information from a small sample or conduct a focus group for instance (Hox & Boeije, 2005).
For this research, secondary data was firstly used due to the chosen deductive research approach. Secondary data was the data that has been firstly collected by previous researchers or organisations for a different purpose or study and was reused in later research (Hox & Boeije, 2005). The secondary data was used to explore previous theories of TAM, UTAUT2 and studies that were carried out on the influence of AR on purchase intentions, from which a literature review was then derived. The TAM along with UTAUT2 models were used in previous research, and were employed to build the research model for this study as well as to construct the hypotheses. The secondary data were mainly gathered from Jönköping University’s online library database ‘Primo’ and Google Scholar. The searched keywords that were used to find previous studies were ‘augmented reality’, ‘eyewear industry’, ‘purchase intention’, ‘TAM’, ‘UTAUT’, ‘UTAUT2’, ‘consumer behaviour’, ‘smart devices’, ‘research methodology’ and also a combination of these keywords. It is worth mentioning that all of the collected secondary data were peer-reviewed articles to assure the reliability of this paper and to be able to build on trustworthy resources.
Primary data was the data collected by the researchers specifically for answering their research purpose and objectives. The main reason for the collection of primary data is due to the lack of information to answer the research questions in addition to that previous secondary data were gathered to test different times (Hox & Boeije, 2005). In this study, primary data was collected through a survey to make sure that the research questions were tackled, and the received data suited the research problem.
A survey is a research strategy that collects information about the experiences, feelings or opinions of the participants by asking standardised questions that are previously constructed by the researcher (Hox & Boeije, 2005; DePoy & Gitlin 2005). Therefore, all participants got the same questions listed in a fixed order. Researchers were able to attain many perks when using surveys to collect primary data, such as higher accessibility to a larger number of responses and low expenditure. To sum up, the intention of collecting a primary data for this study was to give valuable information on the different constructs that affected Product Purchase Intention.
3.4 Sample
A population is a group of people or objects of primary interest to the researchers (Lohr, 2009; Singh, 2007). On the other hand, a sample is a subgroup of a population (Levy & Lemeshow, 2008). In a positivist research study, the sample is used to be a representative of the whole population (Collins & Hussey, 2013). The population identified for this research was composed of people belonging to the Generation Y (Millennials) in Sweden. These individuals are generally defined as the generation cohort born between early 1980’s to early 2000’s (Brosdahl & Carperter, 2011; Shepherdson, 2000; Muskat, Muskat, Zehrer & Johns, 2013). The key characteristic of Generation Y (Millennials) is that they are early adopters and regular users of technology (Immordino-Yang, Christodoulou, & Singh, 2012; Bolton et al., 2013; Martin 2005).
Moreover, individuals belonging to generation Y have a higher purchasing power comparing to previous generation cohorts (Straus, Howe & Markiewicz, 2006), they are highly brand-conscious and demanding customers (Morton, 2002). Therefore, the population of this research consisted of individuals belonging to Generation Y (millennials), specifically those born between the years 1981 to 1999, due to the aforementioned reasons (Bolton et al., 2013).
Since most of the students at Jönköping University were born between 1981 and 1999 (J. Johansson, personal communication, April 6, 2018), this research applied both convenience and self-selection sampling of the Jönköping University students, due to time and resource constraints. Convenience sampling is a type of non-probability sampling that involves the sample to be drawn from a population that is easy to reach or get in contact with (Singh, 2007). Furthermore, there is no other criterion to convenience sampling apart that the people are willing to participate in the study (El-Masri, 2017). Researchers due to its advantages often use convenience sampling. Their advantages include easiness, time efficiency and cost-effectiveness (Henry, 1990). Although convenience sampling is easy to acquire, it has the disadvantage of being prone to sampling bias since the participants do not have an equal probability to be selected (Bornstein, Jager & Putnik, 2017; Cooper & Schindler, 2011), and therefore may not correctly represent the population. However, the sampling bias is less when there is lack of variation in the population (Bornstein et al., 2017; Saunders et al., 2009).
Self-selection sampling is also a non-probability sampling method in which the individuals show the willingness to take part in the study (Saunders et al., 2009). The critical component is that the individuals volunteer to take part in the study rather than being persuaded by researchers directly (Doyle, 2011). The research used self-selection sampling in addition to the convenience sampling, for individuals who want to take part in the study and they will be reached through publicising the survey on various online platforms. The utilised publicity platforms were social media such as Facebook groups, Messenger and emails. Individuals that were willing to participate in the study through self-selection were interested in the research topic and considered it important (Saunders et al., 2009).
When it comes to the non-probability samplings, the question of sample size is vague, and unlike in probability sampling, there are no specific rules (Saunders et al., 2009). The sample size in non-probability sampling is dependent on the research question and purpose (Patton, 2002). Likewise, according to Yin (1994), the grounds for generalisation from non-probability case studies are based on expanding and generalising theories or ‘analytical generalisations’ instead of measuring frequencies or ‘statistical generalisations’. Since the purpose of this research was to test the impact of AR on Product Purchase Intention, the size of the sample was made as large as possible with the time and resources constraints and was aimed at around 100 participants.
3.5 Questionnaire Design
There are different instruments for surveys according to Graziano and Raulin (2004), for this research a questionnaire was carried out to collect the primary data. Questionnaires could be self-administered or interviewer-administered. Interviewer-administered questionnaires are accompanied with the interviewer being with the participants to explain the questions and give further information to the participants when needed (Saunders et al., 2009; Graziano & Raulin, 2004). Thus, this study adopted the interviewer-administered questionnaire, where participants were going to fill out the survey that was constructed for this study with the assistance of the researchers of this paper. The reason for joining the participants during the questionnaire was to answer their inquiries and to make further explanations regarding the survey or the AR mobile application in the case of any.
The questions used were closed as in accordance with a quantitative research method (Stone, 1993). Closed questions are composed of alternative answers from which the participant is asked to choose (Dillman, 2007). The advantages of closed questions are that they are quicker and more straightforward to answer, as they require minimal writing effort. Likewise, the responses from closed questions are easier to compare. The type of closed items that was utilised is rating questions, where questions were presented on a standard scale, usually from negative to positive (David & Sutton, 2004).
Many researchers (Dillman, 2000; Brace, 2004), found that five to seven scales responses are the most frequently used while designing questionnaires. On the other hand, many argue against five, and favour seven scale responses (Jamieson, 2004). For this study, the researchers wanted to examine the extent to how much people agree or disagree with the introduced statements in the questionnaire (Dillman, 2007). Therefore, a Likert-style scale with seven-scale response, which ranges from 7 ‘Strongly Agree' to 1 ‘Strongly Disagree’, was used. A Likert-scale is a commonly used scale in surveys and gauges the attitude of participants (Jamieson, 2004; Awang, Afthanorhan & Mamat, 2016).
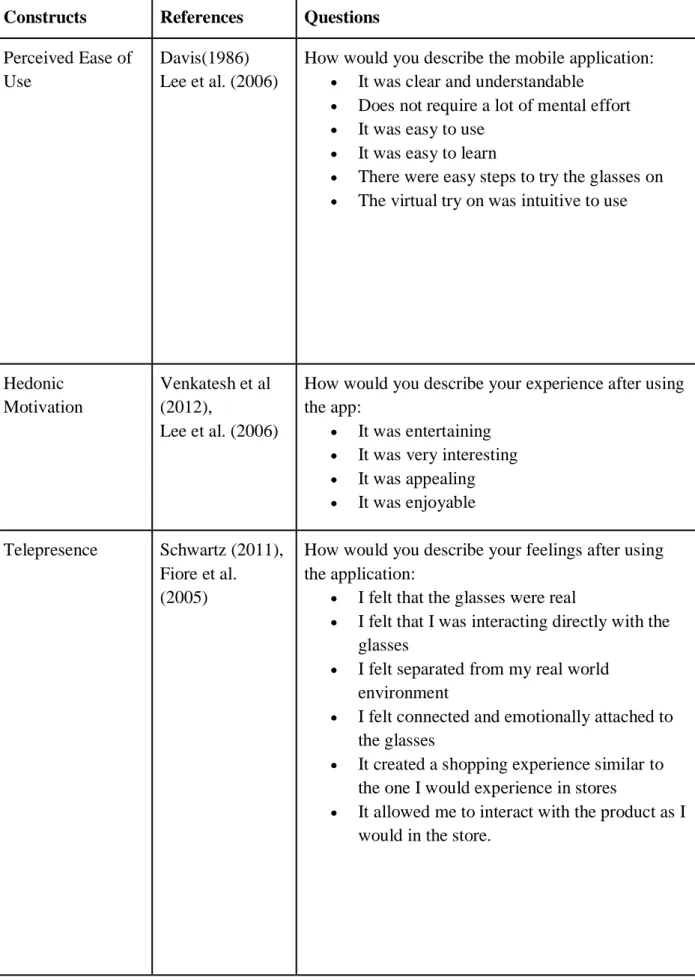
Last but not least, three screening questions were used at the beginning of the questionnaire to help to eliminate and filter the participants who are not eligible or applicable to this study (Rea & Parker, 2014). For instance, if a participant did not wear prescription glasses or sunglasses, or if he/she did not belong to generation Y, or if they have not tried all the features that are included in the mobile application; the researchers disregarded their answers when analysing the collected data (Appendix I). Table 1 shows the different questions that were used for every construct.
Table 1. Questionnaire Construction
Constructs References Questions Perceived Ease of
Use
Davis(1986) Lee et al. (2006)
How would you describe the mobile application:
• It was clear and understandable
• Does not require a lot of mental effort
• It was easy to use
• It was easy to learn
• There were easy steps to try the glasses on
• The virtual try on was intuitive to use
Hedonic Motivation
Venkatesh et al (2012),
Lee et al. (2006)
How would you describe your experience after using the app:
• It was entertaining
• It was very interesting
• It was appealing
• It was enjoyable Telepresence Schwartz (2011),
Fiore et al. (2005)
How would you describe your feelings after using the application:
• I felt that the glasses were real
• I felt that I was interacting directly with the glasses
• I felt separated from my real world environment
• I felt connected and emotionally attached to the glasses
• It created a shopping experience similar to the one I would experience in stores
• It allowed me to interact with the product as I would in the store.
Constructs References Questions Product
information
Kim et al.(2016) Kim and Lennon (2000)
Pantano et al. (2017)
How would you describe the informativeness of the application:
• Improved my information seeking performance
• It made it easier to seek information
• I found it useful in seeking information.
• I have learned a great deal about the product
• It helped me make a more informed purchase decision
• I can fully trust information given by the app
• The virtual try-on provided needed information about eyeglasses Product Purchase
Intention
Schwartz (2011) How do you agree with the following statements:
• I believe I have enough information to make a purchase decision
• If I were to make a purchase decision I would feel confident doing that decision
• I feel that the virtual try-on helped me decide to buy a product
3.6 Data analysis method
As mentioned earlier the quantitative approach was applied for analysing the collected data. Firstly, descriptive statistics were implemented since it permitted the researchers to summarise a significant amount of data as well as simplify them applying measurements that were easy to be used by the researchers. Thus, gender and employment status in the questionnaire were analysed using descriptive statistics. Likewise, descriptive statistics were used to measure both the central tendency and variability of the constructs. The central tendency measures include the mean, mode and median. While variability measures are the range, standard deviation and variance (Graziano & Raulin, 2004; Burns, 2000).
The strength and the direction of the relationship between variables were measured using correlation as it gauges the possible link between variables. Pearson correlation was applied since it computes the linear relationship between variables and it varies from -1.00 to +1.00 in which the first indicates a perfect negative relationship and the latter indicates a perfect positive relationship (Burns, 2000).
Inferential statistics aids researchers to explain, understand and generalise the results obtained from the sample (Graziano & Raulin, 2004; Burns 2000). Hence, inferential statistics allows for hypothesis testing and uses data for making deductions about the population. Furthermore, Multiple Linear Regression was used, since it is one of the inferential statistical procedures that will model the relationship between two or more explanatory variables and the dependent variable (Pallant, 2005). SPSS and E-Views were both used for data analysis.
3.7 Reliability and Validity
The reliability and validity of the measurements that were applied during the research were of great importance. Commencing with reliability, which means attaining stable, consistent and accurate data since it is of a great significance to base the conclusions on them, otherwise, researchers will not be able to rely on the gathered data if they are not consistent (Burns, 2000). There are different types of methods for reliability estimates such as alternate forms method, test-retest reliability, split-half method, and internal consistency reliability (Graziano and Raulin, 2004). Internal consistency method was developed by Kuder and Richardson, is the ability of the measurements to quantify or assess the same constructs (Litwin, 1995; Thigpen, Kappenman & Keil, 2017).
According to Graziano and Raulin (2004), proper measurements give stable outcomes, and one of the commonly used internal consistency measurement is Cronbach coefficient alpha which measures the consistency of variables, and it can be done using SPSS (Burns, 2000; Streiner, 2003). For this paper, the Cronbach coefficient was tested to assure the reliability of the collected data since it has been extensively used (Thigpen et al., 2017). In accordance with Hinton, McMurray, and Brownlow (2004) findings, Cronbach's alpha above 0.90 demonstrates excellent internal consistency. While if it ranges between .70 and .90, it indicates high internal consistency, and alphas from .50 to .70 show intermediate internal consistency, last but not least if a coefficient is below .50, it is considered inferior.
On the other hand, the validity of the quantitative research is to which degree does the research measurements measures the constructs in which the examiner is interested in (Balnaves & Caputi, 2001). Same as reliability, there are different types of validity such as construct validity, internal validity and external validity. However, for this research face validity as well as content validity were applied to assure the validity of this research. Face validity is the process of asking people who do not have a broad knowledge on the examined topic to make sure that the questions are clear and easy to understand, and the constructed instruments measure the proposed topic (Burns, 2000; Heale & Twycross, 2015). Whereas content validity is the extent to which the designed instruments measure the constructs that are intended to be studied by the researcher (Heale & Twycross, 2015: Litwin, 1995). Since the survey questions were constructed and selected from peer-reviewed previous studies that have already examined the same constructs, content validity was achieved in this research.