IN
DEGREE PROJECT MATERIALS SCIENCE AND ENGINEERING,
SECOND CYCLE, 30 CREDITS ,
STOCKHOLM SWEDEN 2018
Prestressed glue laminated beams
reinforced with steel plates
Comparison between prestressed, reinforced
and non-reinforced glue laminated beams
according to the Eurocode and the Swedish
annex
JAFAR AL-DJABER
NAJIB VEGHAR
KTH ROYAL INSTITUTE OF TECHNOLOGY
Latin lower case letters
Parameter
Definition
Unit
𝑏
Width / Breadth
𝑚𝑚
𝑏
𝑒𝑑Horizontal edge distance to reinforcement
𝑚𝑚
𝑏
𝑠Width of steel reinforcement
𝑚𝑚
𝑏
𝑠𝑡
𝑠Carved area where reinforcement is put
𝑚𝑚
2𝑒
Load eccentricity
𝑚𝑚
𝑓
𝑐,0,𝑔,𝑑Design compression strength parallel to grain
𝑀𝑃𝑎
𝑓
𝑐,0,𝑔,𝑘Characteristic compression strength parallel to grain
𝑀𝑃𝑎
𝑓
𝑚,𝑔,𝑑Design bending strenght
𝑀𝑃𝑎
𝑓
𝑚,𝑔,𝑘Characteristic bending strength
𝑀𝑃𝑎
𝑓
𝑡,0,𝑔,𝑑Design tension strength
𝑀𝑃𝑎
𝑓
𝑡,0,𝑔,𝑘Characteristic tension strength
𝑀𝑃𝑎
𝑓
𝑣,𝑔,𝑑Design shear strength
𝑀𝑃𝑎
𝑓
𝑣,𝑔,𝑘Characteristic shear strength
𝑀𝑃𝑎
𝑓
𝑦Yield strength
𝑀𝑃𝑎
ℎ
Depth / height
𝑚𝑚
ℎ
𝑙Depth / height of a lamella
𝑚𝑚
𝑖
1Index for steel for transformed section
-
𝑖
𝑟Index for reference material for transformed section
-
𝑘
Instability factor
-
𝑘
𝑐𝑟Factor accounting for influence of cracks on the shear strength of
member subjected to bending
-
𝑘
𝑑𝑒𝑓Deformation factor
-
𝑘
ℎDepth factor
-
𝑘
𝑚𝑜𝑑Modification factor accounting for load duration and moisture
content
-
𝑞
𝐸𝑑Design load with even distribution
𝑘𝑁/𝑚
𝑞
𝐸𝑑,𝜔Evenly distributed load with respect to deformation limit
𝑘𝑁/𝑚
𝑡
𝑠Thickness of reinforcement
𝑚𝑚
𝑧
𝑓𝑖𝑐Fictitious center of gravity, measured from an arbitrarily chosen
point of reference
Latin upper case letters
Parameter
Definition
Unit
𝐴
𝑤Cross sectional area of the web in the section, before
transformation
𝑚𝑚
2𝐺
𝑚𝑒𝑎𝑛Mean value of shear modulus
𝐺𝑃𝑎
𝐶𝐺
Centre of gravity
𝑚𝑚
𝐸
𝐵Stress check at bottom beam for beam type 3
-
𝐸
𝑚𝑒𝑎𝑛Mean value of modulus of elasticity
𝐺𝑃𝑎
E
RStress check at reinforcement level for beam type 3
-
𝐸
𝑇Stress check at top beam for beam type 3
-
𝐼
𝑦Second moment of area about the strong axis
𝑚𝑚
4𝐿
Beam span
𝑚𝑚
𝑃
𝐸𝑑Design point load
𝑘𝑁
𝑃
𝐸𝑑,𝜔Design load with respect to deformation limit
𝑘𝑁
𝑃
𝑝𝑟𝑒Prestressing axial force
𝑘𝑁
Red
Reduction to account for relaxation losses of prestressed steel
%
𝑆
𝑦First moment of area about the strong axis
𝑚𝑚
3𝑊
𝑦Section modulus about the strong axis
𝑚𝑚
3𝑋
𝑓𝑖𝑛Index for concept of final condition, to handle creep problem
-
𝑋
𝑖About i-axis, (X-,Y- or Z- axis)
-
𝑋
𝑖𝑛𝑠𝑡Index for concept of instantaneous condition, to handle creep
problem
-
𝑋
𝑆𝐿𝑆Index for serviceability limit state
-
𝑋
𝑈𝐿𝑆Index for ultimate limit state
-
Greek lower case letters
Parameter
Definition
Unit
𝜎
𝑐,0,𝑔,𝑑Design compressive stress
𝑀𝑃𝑎
𝜎
𝑀Design bending stress
𝑀𝑃𝑎
𝜏
𝑑Design shear stress
𝑀𝑃𝑎
𝜔
Deformation
𝑚𝑚
𝜓
2Factor for quasi-permanent value of a variable action
-
𝜔
𝑚𝑎𝑥Maximum deformation allowed according to recommendations 𝑚𝑚
𝜇
Parameter for concepts of instantaneous and final conditions
-
𝛾
𝑀Partial factors for material properties and resistances
-
Table of Contents
Acknowledgements ... 1
Abstract ... 2
1
Introduction ... 3
1.1
Background ... 3
1.2
Aim and goal ... 3
1.3
Limitation ... 3
1.4
Relevant literature review ... 4
2
Methodology ... 7
2.1
Theoretical model ... 8
2.2
Numerical model ... 15
3
Results ... 16
4
Analysis ... 17
5
Conclusion ... 19
6
Future Research ... 21
7
References ... 22
8
Swedish Summary – Sammanfattning ... 23
9
Appendix ... 24
Appendix A, Result diagrams ... A-1-to A-16
Appendix B, Result data ... B-1 to B-30
Appendix C, Raw data ... C-1 to C-68
Appendix D, PTC MathCad script ... D-1 to D-21
Acknowledgements
We would like to express our gratitude to supervisor Bert Gunnar Norlin for his useful
comments and reviews and thank Melissa Rude and Thaddeus Rude from the United States
for proofreading the paper.
Furthermore, we would like to thank Mr. Adam Ryan, known as user "Ajryan88" in
excelforum.com, for scripting an Excel macro to sort and filter the results of the calculations.
In recognition of his kindness, we have donated to the RiseForAlex Fund in addition to a gift.
Mr. Ryan invested many working hours into scripting a macro that automatically filters the
result database without the need to manually work with excel filtering. His script saved us
valuable time and eased much of our work.
2
Abstract
The paper presents details of a numerical analysis and simplified construction of
strengthened glue laminated beams. Glue laminated beams are strengthened through the
use of steel reinforcements embedded between the lamellas of the beams. The study
compares the numerical results from reinforced and prestressed beams, simply reinforced
beams and non-modified beams. Parametric studies were undertaken to evaluate the effects
on reinforcement thickness, beam span, prestressing force and prestressing loss.
Modified and prestressed beams with wide spans and large dimensions had a significantly
higher design load compared to non-modified beams with similar geometry and span. In the
most beneficial cases, a load increase of 438% was observed for point load at midspan and
346% for uniformly distributed load.
1
Introduction
1.1 Background
Many attempts have been made to improve the load capacity of glulam beams by adding
reinforcement. The reinforcements used have included metallic, organic and polymer
materials. Some reinforcement techniques are applied to existing glue laminated beams to
enhance load capacity by attaching the reinforcement onto the exterior of the wood
material, exposing the reinforcement to weather and fire risk. An alternative method is to
use embedded reinforcements inside the glue laminated beam making it possible to
prestress the reinforcement material and also provide protection from exposure to weather
and fire. Fiber-reinforced polymers (FRP) are ideal to use as a prestressing method due to
the high strength and stiffness of the FRP materials, but have lower prestressing capabilities
compared to steel reinforcement. The analysis of an embedded steel reinforcement is
evaluated in the paper due to most comparable and modern scientific reports covering
materials other than steel (mostly FRP materials).
1.2 Aim and goal
The purpose of the paper is to present a large set of data to analyze the benefits of
prestressing and strengthening homogenous glue laminated beams and to provide
manufacturers and structural engineers with a set of data to analyze whether it is viable to
strengthen the beams with the presented method. The goal is to provide results for several
steel reinforcement thicknesses, beam spans and qualities to find the greatest load increase
for the modified beam compared to the non-modified beam.
1.3 Limitation
The paper is focused on the structural analytical aspect of the steel reinforcement method.
1.3.1 Limitation in analysis
Self-weight of the beam is excluded in the analysis. It is a small fraction of the total load and
the load increase is measured in percent of the original load before applying modifications to
the beam. The load duration was set to permanent without any variable loads to set 𝜓
2, the
factor for quasi-permanent value, to “one” giving the same ultimate limit state and
serviceability limit state creep related factors. This is to reduce the results and make it easier
to interpret and draw clear conclusions from the results. No slip is assumed between
reinforcement material and glulam beam, the layers are assumed to have equal deflections.
The materials remain linear elastic and the calculation model is assumed as full composite
action giving overestimated capacity and underestimated deformation. Welding design and
the transfer of shear forces to welds have not been taken into account.
Prestressing a beam is favorable for fatigue resistance according to the authors’ previous
knowledge in concrete design but the effect and magnitude have not been studied in the
4
Calculations do not account for fire safety according to Eurocode 1995-1-2:2004 (Structural
fire design of timber structures). Practical aspects, manufacturing and cost analysis for the
reinforcement method are not part of the paper.
The script uses a numerical solution to a problem without taking into account whether the
values provided are of a practical use, therefore some design loads may be too small. The
script may obtain design loads below the self-weight of the beam.
1.3.2 Limitation in MathCad model
Since there are infinite solutions for the reinforced and prestressed case, due to the
possibility of altering prestressing force, the program code was developed to calculate all
solutions for every 500 Newtons of change in the prestressing force, from 500 N to highest
possible. Some of the limitations in the model are only to decrease the amount of data
obtained and might be adjusted in the Mathcad worksheet to achieve more extended
results, such as scripts for iterations and increments for beam span and steel thickness.
Pre-camber was excluded throughout the calculations and the deformation limit was set to the
length divided by 500 for the instantaneous and divided by 300 for the final condition. The
deformation limit could be changed in the programming script. The result matrix is unitless
and the only way to obtain the corresponding units is to either study the MathCad script or
to export the result to the provided Excel sheet where the units are specified.
1.4 Relevant literature review
An excessive literature study was carried out to analyze different prestressing methods and
their benefits and restrictions. Since the paper is according to the Eurocode, the literature
was only a tool to identify possible pitfalls that could alter the results in a way that would
make the paper of less scientific value. Many reports, especially when analyzing the
structures in finite element methods, made assumptions that impact the results with great
magnitude without further discussion, leaving the reader less confident in the outcome of
the paper. The reports regarding steel reinforcement were either made according to old
standards or had restrictions in the analysis, making the paper a complement to previous
knowledge, focusing on presenting engineering tools and a large set of numerical data of
interest to glulam manufacturers and structural engineers.
Some authors and researchers have studied the behavior and benefits of reinforced glue
laminated beams through the use of metal reinforcement. The flexural behavior of
unreinforced, reinforced and prestressed-reinforced glue laminated beams were studied
with the use of steel bars at a steel to timber ratio of approximately 1%. For the reinforced
and prestressed beams, the load increased about 40% (De Luca and Marano, 2011).
The disadvantage of using the presented reinforcement method is the need for adhesive
between the glulam and the metal rod (or rebar), making the manufacturing process more
time-consuming than friction-based connections due to adhesive dry time before load
application. The adhesive was allowed to set for one month before load application.
A study to analyze different types of metal reinforcement by wire mesh was conducted
where observations were made about the positioning of the reinforcement and its effect on
the properties of the laminated veneer lumber (Hu et al. 2010). The authors of this paper
had already taken into effect the height positioning and the impact of the reinforcement in
the planning phase.
A laboratory experimental study was conducted at the Lebanese American University where
reinforced glue laminated beams were subjected to destructive tests and identified possible
failure modes. One of the reinforcement techniques studied was reinforcement by a flat
surface steel plate with adhesive connected to the bottom of the glue laminated beam. A
bonding failure between the steel plate reinforcement and wood occurred, shown in Figure
1 (A.Issa and Kmeid, 2005).
Figure 1 ”Failure of the steel reinforced glulam beam”, (A.Issa and Kmeid, 2005, 103)
Strengthening solid timber beams through the use of high strength steel cord reinforcement
was executed in a laboratory experiment with different types of cords and adhesives. The
paper discussed some theories adapted in other reports to determine the ultimate bending
moment. One method is Bernoulli’s theorem where plane sections remain plane after being
strained (Borri and Corradi, 2011). Reinforcement methods can be divided into two
categories: those that yield benefits in local effects and those having global effects. Changes
affecting the global behavior of the beam are considered more beneficial due to affecting
the stiffness and overall behavior of the beam.
6
Beams prestressed by inserting compressed wooden blocks with low moisture content into
fitting holes in the glulam beam have been studied. The local prestressing affect is achieved
by swelling along the beam length when humidity equilibrium is achieved. Local effects are
obtained when implementing the modification of a beam with a load capacity increase of
around 11%. Delamination of the beam along with cracking occurred during a destructive
test (Anshari et al. 2011). The method requires a careful selection of wood without natural
defection and heating the reinforcement blocks to 180 °C. Dried wood requires complicated
logistic solutions or risks being exposed to humidity.
2
Methodology
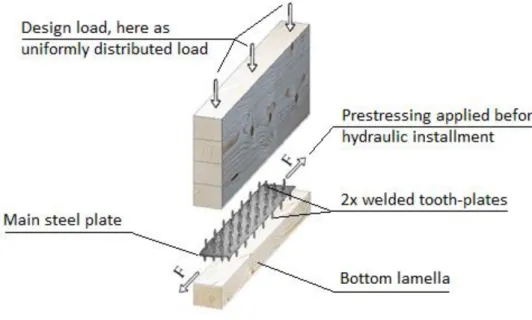
The concept of the reinforced beam is to use a main steel plate with welded thin toothed
plates, also known as punched metal plates, on each side for a friction-based connection
through hydraulic installment between the bottom lamellas of a glue laminated beam. A full
composite action can be ensured by using a large amount of small evenly distributed teeth,
thereby minimizing the risk of delamination or slip.
Figure 2 Principal construction sketch of the prestressed and modified glulam beam
To avoid any relaxation of the steel, all necessary welding should be performed before the
prestressing process. The reinforcement is added between the lamellas and pressed
hydraulically before connecting the bottom lamellas of a glulam beam.
The steel reinforcement placement is in the tension zone of the beam to manipulate the
fictitious cross section with a significant magnitude and to benefit from the deflection
caused by the prestressing. The fictitious cross section methodology scales the steel on a
geometric basis at a ratio between the elastic modulus for the materials compared. The
steel geometric values are scaled by the tens, giving the difference between the elastic
modulus for steel and glulam.
Two major benefits are protecting the reinforcement from fire exposure and reducing the
risk of bonding failure between the reinforcement and timber as shown in Figure 1.
The construction time is greatly reduced by using a hydraulic solution for the construction of
the reinforced beam instead of a metal to wood adhesive solution, due to lack of adhesive
set time before load application.
8
2.1 Theoretical model
A theoretical model of the beam according to the Eurocode was established to evaluate the
increased strength of the glulam beam when modified. The model includes ultimate limit
state (ULS) and final limit state (SLS) with respect to stress and deformation. Three types of
beams were investigated for each homogenous glulam quality, span and dimension available
at a larger European glulam manufacturer according to standard BS EN 1194:1999.
The design shear strength is taken from the Swedish annex related to SS-EN 1194.
Beam type 1: non-modified homogenous glue laminated beam.
Beam type 2: strengthened and unstressed homogenous glue laminated beam, by steel
reinforcement.
Beam type 3: strengthened and pre-tensioned homogenous glue laminated beam, by steel
reinforcement.
2.1.1 Material properties
When dealing with timber structures according to the Eurocode, the design value for
resistance (𝑅
𝑑) is expressed as
𝑅
𝑑=
𝑘
𝑚𝑜𝑑𝑅
𝑘𝛾
𝑀EN-1995-1-1:2004 (2.14)
Where 𝑘
𝑚𝑜𝑑is a modification factor that takes into account the effect of load duration and
moisture content, 𝑅
𝑘is the characteristic value of the load capacity, and 𝛾
𝑀is the partial
factor for material property at the ULS. The values for glulam strength class are given in BS
EN 1194:1999.
At failure condition, ULS values of modulus of elasticity and shear modulus are the fifth
percentage values while at SLS the design values are the mean values.
Equation for mean final value at the SLS condition (𝑋
𝑚𝑒𝑎𝑛,𝑆𝐿𝑆,𝑓𝑖𝑛) for shear modulus and
modulus of elasticity are defined as
𝑋
𝑚𝑒𝑎𝑛,𝑆𝐿𝑆,𝑓𝑖𝑛=
𝑋
𝑚𝑒𝑎𝑛Equation for fifth percentile final value at the ULS condition (𝑋
0.05,𝑈𝐿𝑆,𝑓𝑖𝑛) for shear modulus
and modulus of elasticity are defined as
𝑋
0.05,𝑈𝐿𝑆,𝑓𝑖𝑛=
𝑋
0.051 + 𝜓
2𝑘
𝑑𝑒𝑓EN-1995-1-1:2004 (2.10)
Where 𝜓
2is the factor for the quasi-permanent value of the variable action causing the
largest stress in relation to the strength, given in Eurocode 0 (EC0). The value is set to 1.0 for
permanent load. Deformation factor 𝑘
𝑑𝑒𝑓is dependent upon the choice of service class and
is given in Table 3.2, Eurocode 5 (EC5). The value is set to 0.6 and corresponds to the
deformation factor for glued-laminated timber in service class 1.
For strength related calculation, the fifth percentile for the shear modulus is defined as
𝐺
0.05=
𝐸
0.0516
2.1.2 Geometric properties
For beam type 1, the second moment of area (𝐼
𝑦) and the section modulus (𝑊
𝑦) are defined
as
𝐼
𝑦=
𝑏ℎ
312
, 𝑊
𝑦=
𝑏ℎ
26
Beam type 2 and 3
For reinforced beams containing materials with different elastic modulus, such as steel and
glulam beam, the analysis is simplified by transforming the real cross section to a fictitious
cross section where the width of the steel is changed such that the same modulus of
elasticity is achieved through the entire section. The stresses for the fictitious section are
assumed to be uniformly distributed along the fictitious width and must be distributed over
the real width. When dealing with fictitious cross sections, it is recommended to use the
mean values of the modulus for each material instead of the lower fifth percentile.
10
EC5 uses the concepts of instantaneous and final conditions to handle creep phenomenon,
referred to in the paper and MathCad script as “inst” and “fin” (Crocetti et al. 2011, 5.4).
Parameter 𝜇
1for concepts of inst and fin conditions is defined as
𝜇
1,𝑈𝐿𝑆,𝑖𝑛𝑠𝑡= 𝜇
1,𝑆𝐿𝑆,𝑖𝑛𝑠𝑡=
𝐸
𝑠,𝑚𝑒𝑎𝑛𝐸
𝑚𝑒𝑎𝑛𝜇
1,𝑈𝐿𝑆,𝑓𝑖𝑛=
𝐸
𝑠,𝑚𝑒𝑎𝑛(1 + 𝜓
2𝑘
𝑑𝑒𝑓)
𝐸
𝑚𝑒𝑎𝑛(1 + 𝜓
2𝑘
𝑠,𝑑𝑒𝑓)
𝜇
1,𝑆𝐿𝑆,𝑓𝑖𝑛=
𝐸
𝑠,𝑚𝑒𝑎𝑛(1 + 𝑘
𝑑𝑒𝑓)
𝐸
𝑚𝑒𝑎𝑛(1 + 𝑘
𝑠,𝑑𝑒𝑓)
When permanent load is applied, the factor for quasi-permanent value (𝜓
2) is 1.0.
Therefore, 𝜇
1is the same for ULS and SLS under fin condition.
Since the value for 𝜇
1is dependent upon inst and fin state, the center of gravity, second
moment of inertia and bending stiffness must be calculated for both states with Steiner’s
theorem.
Figure 3 Fictitious cross-section about the y-y axis with the glulam part as the reference material
The fictitious center of gravity about the y-y axis, with the zero point at the bottom of the
homogenous glue laminated beam:
𝑏ℎ
ℎ
2
− 𝑡
𝑠𝑏
𝑠ℎ
𝑙+ 𝑡
𝑠𝜇
1𝑏
𝑠ℎ
𝑙= 𝑧
𝑓𝑖𝑐(𝑏ℎ + 𝜇
1𝑏
𝑠𝑡
𝑠− 𝑏
𝑠𝑡
𝑠)
Center of gravity for each part according to Error! Reference source not found.:
𝐶𝐺
𝑧,1=
ℎ
𝑙−
𝑡
2
𝑠2
, 𝐶𝐺
𝑧,2= ℎ −
ℎ − ℎ
𝑙−
𝑡
2
𝑠Fictitious second moment of area about the y-y axis:
𝐼
𝑦,𝐶𝐺𝑧,1=
𝑏 (ℎ
𝑙−
𝑡
𝑠2
)
312
+ 𝑏 (ℎ
𝑙−
𝑡
𝑠2
) (𝑧
𝑓𝑖𝑐− 𝐶𝐺
𝑧,1)
2𝐼
𝑦,𝐶𝐺𝑧,2=
𝑏 (ℎ − ℎ
𝑙−
𝑡
2
𝑠)
312
+ 𝑏 (ℎ − ℎ
𝑙−
𝑡
𝑠2
) (𝑧
𝑓𝑖𝑐− 𝐶𝐺
𝑧,2)
2𝐼
𝑦,𝐶𝐺𝑧,3=
𝑏
𝑒𝑑𝑡
𝑠 312
+ 𝑏
𝑒𝑑𝑡
𝑠(𝑧
𝑓𝑖𝑐− 𝐶𝐺
𝑧,3)
2𝐼
𝑦,𝐶𝐺𝑧,4=
𝜇
1𝑏
𝑠𝑡
𝑠 312
+ (𝜇
1𝑏
𝑠)𝑡
𝑠(𝑧
𝑓𝑖𝑐− 𝐶𝐺
𝑧,4)
2𝐼
𝑦= ∑ 𝐼
𝑦,𝐶𝐺𝑧,𝑖 4 𝑖=1= 𝐼
𝑦,𝐶𝐺𝑧,1+ 𝐼
𝑦,𝐶𝐺𝑧,2+ 2(𝐼
𝑦,𝐶𝐺𝑧,3) + 𝐼
𝑦,𝐶𝐺𝑧,4The fictitious section modulus about the y-y axis:
𝑊
𝑦,𝑚𝑜𝑑,𝑏𝑜𝑡=
𝐼
𝑦𝑧
𝑓𝑖𝑐𝑊
𝑦,𝑚𝑜𝑑,𝑡𝑜𝑝=
𝐼
𝑦ℎ − 𝑧
𝑓𝑖𝑐Value at steel level defined as;
𝑊
𝑦,𝑚𝑜𝑑,𝑟𝑒𝑖=
𝐼
𝑦12
2.1.3 Modification factors
Size factor for depth less than 600mm, else the size factor is 1.0:
𝑘
ℎ= 𝑚𝑖𝑛 {
1.1
(
600𝑚𝑚
ℎ
)
0.1
EN-1995-1-1:2004 (3.1)
Influence of cracks, according to Swedish Annex:
𝑘
𝑐𝑟= 𝑚𝑖𝑛
{
1.0
(
3.0𝑀𝑃𝑎
𝑓
𝑣,𝑔,𝑘)
BFS 2015: 6-EKS 10 (6.1.7(2))
2.1.4 Actions
Design bending stress about y-y axis for all beam types are defined.
For point load at mid span:
𝜎
𝑀=
𝑀
𝑠𝑑𝑊
𝑦=
𝑃
𝐸𝑑𝐿
4𝑊
𝑦For uniformly distributed load:
𝜎
𝑀=
𝑀
𝑠𝑑𝑊
𝑦=
𝑞
𝐸𝑑𝐿
28𝑊
𝑦Design bending stress about the y-y axis caused by prestressing force for beam type 3 is
defined.
𝜎
𝑀.𝑝𝑟𝑒=
𝑃
𝑝𝑟𝑒𝑒
𝑊
𝑦Where 𝑒 is the fictitious load eccentricity about the y-y axis, defined as
𝑒 = 𝑧
𝑓𝑖𝑐− ℎ
𝑙The smallest fictitious section modulus between bottom value (𝑊
𝑦,𝑚𝑜𝑑,𝑏𝑜𝑡) and
top value (𝑊
𝑦,𝑚𝑜𝑑,𝑡𝑜𝑝) is chosen for beam type 2. For beam type 3, a stress check is
performed, see 2.1.5 Design criterion.
Design shear stress about y-y axis for all beam types are defined as
𝜏
𝑑=
𝑉
𝑑𝑆
𝑦Where 𝐼
𝑦is the fictitious cross section and 𝑆
𝑦is the first order moment (see Appendix D
page D-6). To simplify the equations, the prestressing force is assumed to have no influence
on the shear stress.
Design compression stress about the y-y axis caused by prestressing force for beam type 3 is
defined.
𝜎
𝑐=
𝑃
𝑝𝑟𝑒𝑏ℎ
2.1.5 Design criterion
Design criterion with respect to moment resistance
𝜎
𝑀≤ 𝑓
𝑚,𝑑𝑘
ℎDesign criterion with respect to shear resistance at support
𝜏
𝑑≤ 𝑓
𝑣,𝑔,𝑑Design criterion for beams subjected to combined bending moment and compression should
be satisfied.
Stress check at top beam for beam type 3, according to EN 1995-1-1 (6.35):
Equation labeled as 𝐸
𝑇in appendix D page D-8
𝜎
𝑀− 𝜎
𝑀.𝑝𝑟𝑒𝑓
𝑚,𝑔,𝑑𝑘
ℎ+ (
𝜎
𝑐𝑓
𝑐,0,𝑔,𝑑)
2≤ 1
Fictitious section modulus (𝑊
𝑦,𝑚𝑜𝑑,𝑡𝑜𝑝) at top beam is used to calculate the design bending
stress.
Stress check at bottom beam for beam type 3:
Equation labeled as 𝐸
𝐵in appendix D page D-8
−𝜎
𝑀+ 𝜎
𝑀.𝑝𝑟𝑒𝑓
𝑚,𝑔,𝑑𝑘
ℎ+ (
𝜎
𝑐𝑓
𝑐,0,𝑔,𝑑)
2≤ 1
Fictitious section modulus (𝑊
𝑦,𝑚𝑜𝑑,𝑏𝑜𝑡) at bottom beam is used to calculate the design
14
Stress check at reinforcement level for beam type 3:
Equation labeled as 𝐸
𝑅in appendix D page D-8
−𝜎
𝑀+ 𝜎
𝑀.𝑝𝑟𝑒𝑓
𝑦𝛾
𝑀0+ (
𝜎
𝑐𝑓
𝑦𝛾
𝑀0)
2≤ 1
Fictitious section modulus (𝑊
𝑦,𝑚𝑜𝑑,𝑟𝑒𝑖) at reinforcement level is used to calculate the design
bending stress.
The equations 𝐸
𝐵and 𝐸
𝑅may give negative values for allowable bending moment stress
ratio but cannot be considered favorable in equation (6.35). The equations have been
modified in Appendix D page D-8 to obtain absolute values for allowable bending moment
stress ratio.
2.1.6 Deformation
Mean values for shear modulus and modulus of elasticity are used in the deformation check,
a SLS problem for both inst and fin conditions.
Bending deflection caused by a point load at midpoint
𝜔 =
𝑃
𝐸𝑑𝐿
3
48𝐸
𝑚𝑒𝑎𝑛𝐼
𝑦+
𝑃
𝐸𝑑𝐿
4𝐴
𝑤𝐺
𝑚𝑒𝑎𝑛Where 𝐴
𝑤is the cross-sectional area of the web in the section before transformation,
assumed as the real cross-section.
Bending deflection caused by a uniformly distributed load
𝜔 =
5𝑞
𝐸𝑑𝐿
4
384𝐸
𝑚𝑒𝑎𝑛𝐼
𝑦+
𝑞
𝐸𝑑𝐿
28𝐴
𝑤𝐺
𝑚𝑒𝑎𝑛Negative bending deflection, at midpoint caused by prestressing force for beam type 3
𝜔 =
𝑃
𝑝𝑟𝑒𝑒𝐿
2
2.2 Numerical model
A numerical model in MathCad was the primary tool used to evaluate the benefit of the
prestressing theory (see appendix D).
2.2.1 MathCad model
The functions used in the numerical MathCad script in appendix D are described and
explained on the script sheets. The reader is recommended to view the script to have an
understanding of the functions and the results obtained. The MathCad script is divided into
three different files that are linked with scripting: one for input and output, one for defining
the equations, and the last for executing the full calculations according to the analytical
model with automated scripting functions that loop for every increment change in each of
the varying values.
MathCad sheet “UseMe.xmcd”
The input file is labeled as UseMe.xmcd (see appendix D page D-1 to D-3). It contains the
necessary input values for beam dimension and material properties for both steel and
timber, Eurocode partial factors that may depend on the National Annex and deformation
limits.
The input file executes the calculation command and performs the export of completed data
to Excel. The Output section of the worksheet transforms the full and unitless data matrix
into strings for export to Excel.
Programming script, part 1 “Script_part1.xmcd”
The programming script contains all equations needed to perform the calculation in a
function style scripting method (see appendix D page D-4 to D-11). The script does not
perform any calculations. It only defines functions to be later used. Geometric, modification
factors, action and deformation design equations are defined in the worksheet.
The file contains some programming utilities of significance for creating increments, vectors
and optimizations including matrix related functions to add labels and input data to the
result matrix. The last segment of the file includes output functions to organize the results
obtained.
Programming script, part 2 “Script_part2.xmcd”
With the previously defined equations, a final function is defined for every beam type and
loading condition. The final function performs calculation tasks and returns a set of result
data to the input file. Due to scripting limitations in MathCad, the final result matrix is
unitless and the units have been defined in the Excel sheet (see appendix D page D-12 to
D-21). The resulting matrices are unfiltered with a large set of increments of the prestressing
force.
16
2.2.2 Excel filter macro
An Excel macro was made for filtering the results for beam type three and choosing the most
beneficial prestressing force among those calculated. Some manual sorting of data was
performed to compare the different beam types with a non-modified beam with increased
number of lamellas. In the interest of a quick, precise answer, it is recommended to filter
one beam dimension at a time. Appendix B to C are exported from the Excel file.
3
Results
Due to the high number of interactions and different beam geometries, beam types and a
variation in steel reinforcement thickness, the results have been included in appendix A
(page A-1 to A-12) as charts and in Appendix B as tables.
4
Analysis
When applying a filtering function to the results in Excel with respect to highest load
increase, there is a pattern among the beams with the most advantage. The selected cases
studied are beams in the final limit state (SLS).
Comparisons with increased number of lamellas have been made to have a logical
understanding of the improvement for the different reinforcement techniques. Increasing
the number of lamellas may be a less demanding than the reinforcement techniques
presented in the paper. The author and reader can determine if the presented
reinforcement techniques are viable for some geometrical conditions and beam spans.
A limitation occurs when comparing results from increased number of lamellas when
reaching max height of every beam width and span calculated because there is no data to
obtain from the results in Appendix B. In some cases, the maximum beam height in Appendix
B is 495 mm and there is no reference to obtain from a higher beam with the same quality,
width and span. The same logic is applied for the second highest beam. Only one reference
with one extra lamella is possible to obtain from the results in Appendix B.
Appendix A page A-13 to A-16 contains charts to analyze the behavior of some beam
geometries and spans for all satisfactory solutions with a prestressing force increment of one
kilo Newton. The script was engineered to export the most beneficial results to minimize the
number of exported values. For some geometries and spams thousands of satisfactory
solutions where calculated.
A higher quality steel reinforcement is preferred due to increased design resistance and
decreased deflection when engineering steel structures, according to the Eurocode standard
for steel structures (i.e. BS EN 1993-1-1:2005 (E) equation 6.55).
Changing the yield strength of steel does not affect the elastic modulus when adapting the
fictitious cross section theory for the steel reinforcement, as the yield strength of the steel
material no longer affects the design strength other than improving the stress check at
reinforcement level, according to EN 1995-1-1 (6.35).
A stress analysis is performed between load and resistance in the wood engineering, and the
fictitious cross section theory takes into effect the elastic modulus ratio between the glulam
and steel. The elastic modulus for a steel material remains the same if another steel quality
is chosen.
When transmuting the steel reinforcement to a fictitious material with increased geometry
values to be considered as a glulam material, the effect of the yield strength is lost. A
laboratory experiment could be performed to take into consideration the effect of improved
steel quality and to redefine the theory for future research. Another method is to use a
well-defined finite element solution to the problem where the focus is to accurately and
18
4.1 Prestressing analysis
The prestressing analysis is included in Appendix A page A-13 to A-16 as charts for some
beam geometries and spans.
Figure 4 Prestressing analysis chart for beam GL24h 65x225 with 5m span, point load at midspan, see Appendix A.
Some observations are made in the prestressing analysis that are valid for every chart and
beam type analyzed. A larger steel reinforcement thickness is beneficial for smaller
prestressing forces between 0 kN up to a certain point, here called point A. A smaller steel
reinforcement thickness is most beneficial for prestressing forces above point A. The location
of point A in the prestressing force increment spectrum varies from one beam geometry to
another. As Figure 4 shows, point A is approximately at a prestressing force of 40 kN for
beam GL24h 65x225 mm and with the span of 5 meters with a point load at midspan and
steel reinforcement types as described in the paper.
In some of the analyzed beams, the increase in loading capacity from prestressing force
equal to zero up to point A is linear (𝑦 = 𝑚𝑥 + 𝑐), while in other cases the increase is
parabolic (𝑦 = −𝑚𝑥
2+ 𝑛𝑥 + 𝑐). The shape of the increase may be affected by what failure
mode is achieved first in the satisfactory solution.
The most beneficial result (maximum point on the y-axis) and highest loading capacity in the
analyzed beams occurred always beyond point A, here called point B. Point B may
hypothetically overlap with point A if no satisfactory solutions are obtained for further
prestressing increments. Point B may occur before a fictitious location of point A. This
scenario may hypothetically occur if the beam capacity of different steel thickness cases
merge outside the satisfactory solution boundary.
In all of the analyzed cases, the most beneficial result was the one with steel reinforcement
thickness of 10 mm for beam type 3. A larger reinforcement thickness brings the fictitious
center of gravity of the beam closer to the reinforcement level causing a smaller lever, and a
smaller design bending stress caused by prestressing force and eccentricity 𝜎
𝑀.𝑝𝑟𝑒. If the
design stress check (according to 2.1.5 Design criterion) is at top beam then a smaller
reinforcement thickness will give the most beneficial results (maximum y-value in Figure 4)
and that was the case for all prestressing analysis.
4.2 Most beneficial results
Some observations are made by studying the visualized results in the charts provided in
appendix A page A-1 to A-12 or the numerical values provided in appendix B.
A larger steel reinforcement thickness is advantageous to the beam capacity for all studied
dimensions and spans for beam type 2. Increasing the beam span for a specific geometry
resulted in a higher load capacity increase for beam type 2 in percentage to an unmodified
glulam beam with corresponding geometry and span.
A smaller steel reinforcement thickness is advantageous to the beam capacity for all studied
dimensions and spans for beam type 3, with a steel thickness of 10 mm (see 4.1 Prestressing
analysis). Increasing the beam span resulted in a higher beam capacity increase for all beams
in beam type 3 in comparison to beam type 1.
The most beneficial load capacity increase among all beam type 2 data is found at large
dimensions and spans. Beam GL28h 115x405 mm with the span of 9 m had a load increase of
106% for point load at midspan and 105% for uniformly distributed load. The load increase
values are calculated in Appendix B.
Results for beam type 3 were always higher than adding one lamella except for beam quality
GL24h, dimension 65x225 mm and a span of 2 to 2.5 meters.
The most beneficial load capacity increase among all beam type 3 data is found at large
dimensions and spans. Beam GL28h 90x360 mm with the span of 11m had a load increase of
438% for point load at midspan and 346% for uniformly distributed load.
4.3 Least beneficial results
The load capacity increase for beam type 2 is smaller than the load capacity increase when
adding a lamella (where comparison to a larger height is applicable) in the case of a small
beam geometry, span and a low beam quality (see results for glulam beams with the quality
GL24h, dimensions 65x225 mm and 65x270 mm around the span of 2 meters in Appendix A
page A-1 and A-7).
20
5
Conclusion
With the defined methodology, benefits of up to 438% to load increase is achieved for
beams with wider spans affected by point load at midpoint and up to 346% for similar beams
affected by a uniformly distributed load. Adding an extra lamella proved more beneficial
than reinforcing the beam in some cases with short spans and slim cross sections.
The adapted fictitious cross section theory does not take into account the yield strength of
the chosen steel quality other than in the stress check equations, giving all results in the
lowest possible steel grade from the input data (due to the MathCad functions used). The
main benefit of beams type 2 and 3 is obtained through the fictitious cross section due to
the elastic modulus of the steel being larger than the glulam elastic modulus by
approximately 20 times.
The prestressed strengthening method studied in the presented paper is assumed to not
improve the shear capacity of a glue laminated beam. Design loads provided in appendix A
may exceed the design criterion with respect to shear resistance at the support. There are
several implemented reinforcement methods not discussed in the paper that are available to
strengthen a glue laminated beam with respect to shear resistance at the supports.
A slender beam combined with the edge fire safety distance to reinforcement limits the
fictitious cross section increase. Therefore, a limited steel reinforcement width is possible.
The edge distance to steel reinforcement with respect to fire safety is a larger percentage of
the total width of a slender beam compared to a wider beam. A logical conclusion based on
the safety edge distance aspect, is that wider beams will benefit from steel reinforcement.
A unified conclusion cannot be made for all cases. In some cases where comparison is
possible to increased beam height in appendix A, the reinforcement method for beam type 3
had a significantly greater value than adding extra lamellas to the beam height, making it a
viable reinforcement option from a structural engineering standpoint. In other few cases,
the use of the reinforcement methods in beam type 2 or 3 had a smaller value than adding
one or two extra lamellas but may have a practical use if there are requests in other
disciplines that limit the cross sections of a beam to be engineered.
6
Future Research
More accurate prestressing loss, expand the model to account for reinforced
non-homogenous glue laminated beams. Expand the model to calculate variable loads and
different load cases. Expand the model to adapt to fire safety according to
Eurocode 1995-1-2:2004 (or newer versions). Expand the model to approximate the real
behavior between steel and timber with possibility for slip. Expand the model to adapt for
the risk of the lower lamella fracturing due to prestressing force if a certain amount of the
lower lamella is removed. Modeling of the prestressing force, with respect to economic
analysis, to determine the value of increasing the beam dimension versus the work load and
cost of the reinforcement technique presented in the paper.
By assuming full composite action, the capacity is overestimated and the deformation is
underestimated for the reinforced cases. The error is in reality too large to be disregarded
but using many small tooth-plated connectors with the glued area would decrease the error.
The main aim of the thesis is to study if the modification method used gives any noticeable
result. A more accurate analysis could be performed later by modifying the MathCad script.
A modification of the numerical methodology presented, mainly the fictitious cross section
equations, is strongly advised to take into account the benefit of a higher-grade steel to
obtain more beneficial results for beam type 3 due to utilization from a higher yield strength.
The MathCad script can be improved by adding the type of the chosen design criterion on
each beam case to help analyze the data.
Studying the effect of fatigue behavior on modified glulam beams compared to a
non-modified glulam beams may provide an alternative use of the beam concept.
22
7
References
Anshari, Guan, Kitamori, Jung and Komatsu. 2011. Structural behavior of glued laminated
timber beams pre-stressed by compressed wood. Construction and Building Materials 29
(2012) 24-32. University of Liverpool (UK), Kyoto University (Japan), University of Mataram
(Indonesia) and Shizuoka University (Japan). Elsevier Ltd.
BFS 2015:6 – EKS 10 (2015), Boverkets författningssamling (Swedish Annex to the Eurocode),
Boverket.
Borri and Corradi. 2011. Strengthening of timber beams with high strength steel cords.
Composites: Part B 42 (2011) 1480-1491. University of Perugia, Italy. Elsevier Ltd.
Crocetti, Johansson, Kliger, Mårtensson, Norlin, Pousette and Thelandersson. 2011. Design
of timber structures. Swedish wood.
De Luca and Marano. 2011. Prestressed glulam timbers reinforced with steel bars.
Construction and Building Materials 30 (2012) 206-217. University of Basilicata, Italy. Elsevier
Ltd.
EN 1995 (2004), Eurocode 5 – Design of timber structures, European Committee for
Standardization.
Hu, Li, Cheng and Zhang. 2010. Design and property analysis of the metal mesh reinforced
LVL. Advanced Materials Research Vols 113-114 (2010) 2145-2149. Northeast Forestry
University, Harbin, China. Trans Tech Publications.
Issa and Kmeid. 2004. Advanced wood engineering: glulam beams. Construction and Building
Materials 19 (2005) 99-106. Lebanese American University, Byblos, Lebanon. Elsevier Ltd.
Porteous Jack & Kermani Abdy. 2009. Structural Timber Design to Eurocode 5. Edition 3.
Blackwell Science Ltd.
8
Swedish Summary – Sammanfattning
Vetenskapsrapporten analyserar numeriska nyttan av armerade och förspännda limträbalkar
med stålband försedda med ståltänder. Jämförelse mellan förspända och armerade samt
endast armerade balkars görs med icke modifierade limträbalkar. Resultatpåverkan av
varierande spännvidder, tvärsnittsgeometrier och armeringstjocklekar utvärderas med hjälp
av en Mathcadskript för två lastfall; fritt upplagd balk med punktkraft i balkmitt och en jämnt
utbredd last över balklängden. En jämförelse mellan den procentuella lastökningen
tillämpas även för ett ökat antal lameller för respektive balk.
I huvuddel består teorin av att transmutera stålets geometri till en kvotrelaterad storhet där
elasticitetmodulen för ingående stål- och trämaterial beaktas. Vidare antas den armerade
balken vara homogen till följd av tillämpningen av den fiktiva tvärsnittsteorin.
Rapporten beaktar endast den analytiska metodiken utan hänsyn till kostnads- eller
arbetsrelaterade aspekter.
Fördelar i bärförmåga noterades där mest fördelaktiva värden för punktlast i balkmitt
uppgick till 438% i bärförmågeökning och 346% i bärförmågeökning vid jämnt fördelad last.
Noteringarna gjordes för långa balkar med grövre dimensioner och tunnare stålförstärkning.
En förspänningsanalys dokumenterade att tunnare stål gav högre bärförmåga än tjockare
armeringsförstärkning för analyserade förspända och modifierade limträbalkar. Vilket
förklaras av att det fiktiva tvärtsnittets tyngdpunkt hade en mindre värdeminskning än
balkar med grövre stålarmering och därmed nyttjades en högre hävarm till den excentriska
stålförspänningen, något som var gynnsamt för det aktuella spänningsbrottmoden.
24
9
Appendix
Relevant information about the attached appendixes
Appendix A, Result diagrams
All charts are based on final limit state values. For beam type 3, values are without reduction
for prestressing losses due to relaxation. Red is set to 0%.
Page A-1 to A-12 are final solution charts providing the most beneficial prestressing force for
each beam dimension and span.
Page A-13 to A-16 are charts for some of the beam dimensions and spans showing the effect
of prestressing with the increment of 1 kN. The number of satisfactory solutions calculated
for each chart are presented in Table 1.
Table 1 Number of solutions calculated to create the charts in appendix A page A-13 to A-16.
Number of solutions
presented in the charts
Quality
Dim.
Span (m) Point load at
midspan
Uniformly
distri. load
GL24h
65x225
2
409 409GL24h
65x225
5
403 405GL24h
65x315
2
563 563GL24h
65x315
5
567 550GL28h
90x270
5
748 738GL28h
90x270
8
744 744GL28h
90x495
5
1203 1220GL28h
90x495
8
1215 1216GL28h
115x270
5
952 952GL28h
115x270
8
948 948GL28h
115x495
5
1583 1583GL28h
115x495
8
1573 1579Appendix B, Result data
Appendix B is a comparison of the raw data in appendix C for beam type 1, 2 and 3
presented in the same row, including values when adding one or two lamellas to the beam
(if data is available at appendix C). Values that are faded out in color are identical to the
value on the row above. New beam dimensions (width and height) are marked with a color
highlight. The load increase is given, and a value of 100% means double the capacity.
Appendix C, Raw data
Raw data where the most beneficial solution for the prestressing increment on each beam
dimension and span is exported to the appendix. Appendix C is used to calculate percentage
gain in appendix B and to make the final solution charts in appendix A page A-1 to A-12.
Beam type 2 Beam type 3, no relaxation G L2 4 h 6 5 x 2 2 5 G L2 4 h 6 5 x 2 7 0 G L2 4 h 6 5 x 3 1 5 0 25 50 75 100 2 3 4 5 Lo ad i n cr e as e % Beam span m 0 50 100 150 200 2 3 4 5 Lo ad i n cr e as e % Beam span m 0 25 50 75 100 2 3 4 5 6 Lo ad i n cr e as e % Beam span m 0 50 100 150 200 2 3 4 5 6 Lo ad i n cr e as e % Beam span m 0 25 50 75 100 2 3 4 5 6 7 Lo ad i n cr e as e % Beam span m 0 50 100 150 200 250 2 3 4 5 6 7 Lo ad i n cr e as e % Beam span m
Appendix A, Result diagrams
Point load at midpoint
Beam type 2 Beam type 3, no relaxation G L2 8 h 9 0 x 2 2 5 G L2 8 h 9 0 x 2 7 0 G L2 8 h 9 0 x 3 1 5 0 25 50 75 100 4 5 6 7 Lo ad i n cr e as e % Beam span m 0 50 100 150 200 250 300 4 5 6 7 Lo ad i n cr e as e % Beam span m 0 25 50 75 100 4 5 6 7 8 Lo ad i n cr e as e % Beam span m 0 50 100 150 200 250 300 350 4 5 6 7 8 Lo ad i n cr e as e % Beam span m 0 25 50 75 100 125 4 5 6 7 8 9 Lo ad i n cr e as e % Beam span m 0 50 100 150 200 250 300 350 4 5 6 7 8 9 Lo ad i n cr e as e % Beam span m
Beam type 2 Beam type 3, no relaxation G L2 8 h 9 0 x 3 6 0 G L2 8 h 9 0 x 4 0 5 G L2 8 h 9 0 x 4 5 0 0 25 50 75 100 125 4 5 6 7 8 9 10 11 Lo ad i n cr e as e % Beam span m 0 50 100 150 200 250 300 350 400 4 5 6 7 8 9 10 11 Lo ad i n cr e as e % Beam span m 0 25 50 75 100 125 4 5 6 7 8 9 10 11 Lo ad i n cr e as e % Beam span m 0 50 100 150 200 250 300 350 4 5 6 7 8 9 10 11 Lo ad i n cr e as e % Beam span m 0 25 50 75 100 125 4 5 6 7 8 9 10 11 Lo ad i n cr e as e % Beam span m 0 50 100 150 200 250 300 4 5 6 7 8 9 10 11 Lo ad i n cr e as e % Beam span m
Appendix A, Result diagrams
Point load at midpoint
Beam type 2 Beam type 3, no relaxation G L2 8 h 9 0 x 4 9 5 G L2 8 h 1 1 5 x 2 2 5 G L2 8 h 1 1 5 x 2 7 0 0 25 50 75 100 125 4 5 6 7 8 9 10 11 Lo ad i n cr e as e % Beam span m 0 50 100 150 200 250 300 4 5 6 7 8 9 10 11 Lo ad i n cr e as e % Beam span m 0 25 50 75 100 4 5 6 7 Lo ad i n cr e as e % Beam span m 0 50 100 150 200 250 300 4 5 6 7 Lo ad i n cr e as e % Beam span m 0 25 50 75 100 4 5 6 7 8 Lo ad i n cr e as e % Beam span m 0 50 100 150 200 250 300 350 4 5 6 7 8 Lo ad i n cr e as e % Beam span m
Beam type 2 Beam type 3, no relaxation G L2 8 h 1 1 5 x 3 1 5 G L2 8 h 1 1 5 x 3 6 0 G L2 8 h 1 1 5 x 4 0 5 0 25 50 75 100 125 4 5 6 7 8 9 Lo ad i n cr e as e % Beam span m 0 50 100 150 200 250 300 350 4 5 6 7 8 9 Lo ad i n cr e as e % Beam span m 0 25 50 75 100 125 4 5 6 7 8 9 Lo ad i n cr e as e % Beam span m 0 50 100 150 200 250 300 4 5 6 7 8 9 Lo ad i n cr e as e % Beam span m 0 25 50 75 100 125 4 5 6 7 8 9 Lo ad i n cr e as e % Beam span m 0 50 100 150 200 250 300 4 5 6 7 8 9 Lo ad i n cr e as e % Beam span m
Appendix A, Result diagrams
Point load at midpoint
Beam type 2 Beam type 3, no relaxation G L2 8 h 1 1 5 x 4 5 0 G L2 8 h 1 1 5 x 4 9 5 0 25 50 75 100 125 4 5 6 7 8 9 Lo ad i n cr e as e % Beam span m 0 50 100 150 200 250 4 5 6 7 8 9 Lo ad i n cr e as e % Beam span m 0 25 50 75 100 125 4 5 6 7 8 9 Lo ad i n cr e as e % Beam span m 0 50 100 150 200 250 4 5 6 7 8 9 Lo ad i n cr e as e % Beam span m
Beam type 2 Beam type 3, no relaxation G L2 4 h 6 5 x 2 2 5 G L2 4 h 6 5 x 2 7 0 G L2 4 h 6 5 x 3 1 5 0 25 50 75 100 2 3 4 5 Lo ad i n cr e as e % Beam span m 0 50 100 150 200 250 2 3 4 5 Lo ad i n cr e as e % Beam span m 0 25 50 75 100 2 3 4 5 6 Lo ad i n cr e as e % Beam span m 0 50 100 150 200 250 300 2 3 4 5 6 Lo ad i n cr e as e % Beam span m 0 25 50 75 100 125 2 4 6 Lo ad i n cr e as e % Beam span m 0 50 100 150 200 250 300 2 4 6 Lo ad i n cr e as e % Beam span m
Appendix A, Result diagrams
Uniformly distributed load
Beam type 2 Beam type 3, no relaxation G L2 8 h 9 0 x 2 2 5 G L2 8 h 9 0 x 2 7 0 G L2 8 h 9 0 x 3 1 5 0 25 50 75 100 4 5 6 7 Lo ad i n cr e as e % Beam span m 0 50 100 150 200 250 300 350 4 5 6 7 Lo ad i n cr e as e % Beam span m 0 25 50 75 100 4 5 6 7 8 Lo ad i n cr e as e % Beam span m 0 50 100 150 200 250 300 350 400 4 5 6 7 8 Lo ad i n cr e as e % Beam span m 0 25 50 75 100 125 4 5 6 7 8 9 Lo ad i n cr e as e % Beam span m 0 50 100 150 200 250 300 350 400 4 5 6 7 8 9 Lo ad i n cr e as e % Beam span m
Beam type 2 Beam type 3, no relaxation G L2 8 h 9 0 x 3 6 0 G L2 8 h 9 0 x 4 0 5 G L2 8 h 9 0 x 4 5 0 0 25 50 75 100 125 4 5 6 7 8 9 10 11 Lo ad i n cr e as e % Beam span m 0 50 100 150 200 250 300 350 400 450 500 4 5 6 7 8 9 10 11 Lo ad i n cr e as e % Beam span m 0 25 50 75 100 125 4 5 6 7 8 9 10 11 Lo ad i n cr e as e % Beam span m 0 50 100 150 200 250 300 350 400 450 4 5 6 7 8 9 10 11 Lo ad i n cr e as e % Beam span m 0 25 50 75 100 125 4 5 6 7 8 9 10 11 Lo ad i n cr e as e % Beam span m 0.0 50.0 100.0 150.0 200.0 250.0 300.0 350.0 400.0 4 5 6 7 8 9 10 11 Lo ad i n cr e as e % Beam span m
Appendix A, Result diagrams
Uniformly distributed load
Beam type 2 Beam type 3, no relaxation G L2 8 h 9 0 x 4 9 5 G L2 8 h 1 1 5 x 2 2 5 G L2 8 h 1 1 5 x 2 7 0 0 25 50 75 100 125 4 5 6 7 8 9 10 11 Lo ad i n cr e as e % Beam span m 0.0 50.0 100.0 150.0 200.0 250.0 300.0 350.0 4 5 6 7 8 9 10 11 Lo ad i n cr e as e % Beam span m 0 25 50 75 100 4 5 6 7 Lo ad i n cr e as e % Beam span m 0 50 100 150 200 250 300 350 4 5 6 7 Lo ad i n cr e as e % Beam span m 0 25 50 75 100 4 5 6 7 8 Lo ad i n cr e as e % Beam span m 0 50 100 150 200 250 300 350 400 4 5 6 7 8 Lo ad i n cr e as e % Beam span m
Beam type 2 Beam type 3, no relaxation G L2 8 h 1 1 5 x 3 1 5 G L2 8 h 1 1 5 x 3 6 0 G L2 8 h 1 1 5 x 4 0 5 0 25 50 75 100 125 4 5 6 7 8 9 Lo ad i n cr e as e % Beam span m 0 50 100 150 200 250 300 350 400 4 5 6 7 8 9 Lo ad i n cr e as e % Beam span m 0 25 50 75 100 125 4 5 6 7 8 9 Lo ad i n cr e as e % Beam span m 0 50 100 150 200 250 300 350 400 4 5 6 7 8 9 Lo ad i n cr e as e % Beam span m 0 25 50 75 100 125 4 5 6 7 8 9 Lo ad i n cr e as e % Beam span m 0 50 100 150 200 250 300 350 4 5 6 7 8 9 Lo ad i n cr e as e % Beam span m
Appendix A, Result diagrams
Uniformly distributed load
Beam type 2 Beam type 3, no relaxation G L2 8 h 1 1 5 x 4 5 0 G L2 8 h 1 1 5 x 4 9 5 0 25 50 75 100 125 4 5 6 7 8 9 Lo ad i n cr e as e % Beam span m 0.0 50.0 100.0 150.0 200.0 250.0 300.0 4 5 6 7 8 9 Lo ad i n cr e as e % Beam span m 0 25 50 75 100 125 4 5 6 7 8 9 Lo ad i n cr e as e % Beam span m 0.0 50.0 100.0 150.0 200.0 250.0 300.0 4 5 6 7 8 9 Lo ad i n cr e as e % Beam span m