ANALYSIS OF DIESEL PARTICULATE MATTER USING ELECTRON MONOCHROMATOR-MASS SPECTROMETRY, BACTERIAL
IDENTIFICATION USING MASS SPECTROMETRY AND LATERAL FLOW IMMUNOCHROMATOGRAPHY, AND
DETECTION OF LEVAMISOLE AS A CUTTING AGENT IN PATIENTS USING COCAINE
by
c
Copyright by Kirk Richard Jensen, 2014 All Rights Reserved
A thesis submitted to the Faculty and the Board of Trustees of the Colorado School of Mines in partial fulfillment of the requirements for the degree of Doctor of Philosophy (Applied Chemistry).
Golden, Colorado Date
Signed:
Kirk Richard Jensen
Signed: Dr. Kent J. Voorhees Thesis Advisor Golden, Colorado Date Signed: Dr. David T. Wu Professor and Head Department of Chemistry and Geochemistry
ABSTRACT
Three studies and one review involving analytical mass spectrometry and one article on rapid bacterial diagnostics are presented herein. Electron monochromator-mass spectrom-etry (EM-MS) literature is presented outlining the development history and relevant ana-lytical applications including nitro compounds in cigarette smoke, resonance energy studies, explosives, and bacterial identification.
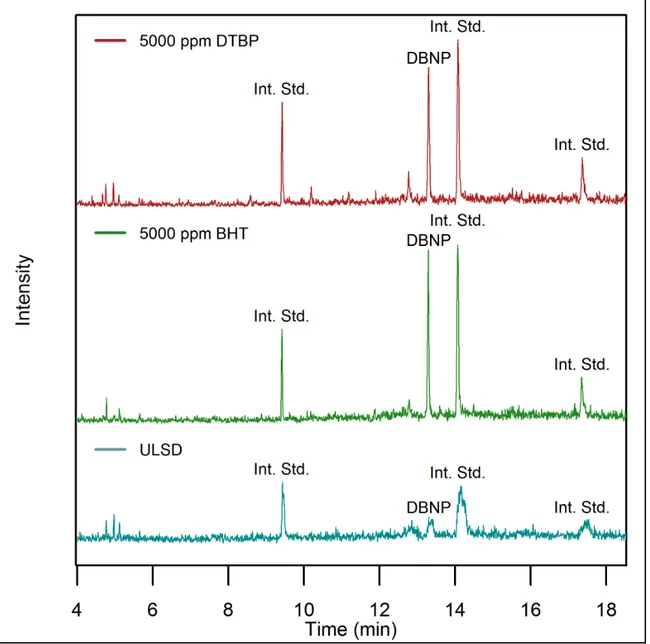
Diesel particulate matter and the effect of antioxidant fuel additives on nitro polycyclic aromatic production during diesel engine operation was investigated using EM-MS. Results showed a strong correlation between production of 2,6-di-tert -butyl-4-nitrophenol (DBNP) and the addition of two antioxidant precursors to the fuel prior to combustion. No correla-tions were observed between DBNP production and engine load or speed. Results indicate that the role of fuel additives in combustion byproducts must be carefully considered.
When using CaO as a matrix-replacement in matrix-assisted laser desorption/ionization mass spectrometry, fatty acids are cleaved from phospholipids in situ by laser-induced py-rolysis. Ten bacterial genera were investigated using CaO as a matrix. Fatty acid profiles were observed and exported for statistical analysis. Principal components analysis of fatty acid profiles revealed distinct separation of bacterial genera. Cross-validation resulted in greater than 94% correct assignment. Future applications could provide clinicians a rapid and reliable method of bacterial detection.
Outbreaks of infectious bacteria and concerns over bioterrorism have increased the de-mand for methods of rapidly and easily detecting bacteria. A lateral flow immunoassay (LFI) device was developed to detect Bacillus anthracis indirectly by using gamma phage amplification. Phage-based LFI detection of B. anthracis Sterne was consistently observed within four and as little as two hours of the onset of phage amplification with a threshold sensitivity of 2.5 × 10³ cfu/mL. Ease and speed of the device could find application in the
field by military personnel.
Finally, individuals admitted to a hospital following cocaine use showed symptoms of levamisole poisoning. Levamisole, an antihelminthic used in veterinary science and a known lacing/cutting agent for cocaine, was detected in urine samples from these patients. Tissue and blood samples were also analyzed, but no concentration was detected. While no direct correlation could be made between patient symptoms and levamisole, its presence in their urine is a strong indication that the cocaine had been cut/laced with levamisole.
TABLE OF CONTENTS
ABSTRACT . . . iii
LIST OF FIGURES . . . xi
LIST OF TABLES . . . xv
LIST OF SCHEMES . . . xvii
LIST OF ABBREVIATIONS . . . xviii
ACKNOWLEDGMENTS . . . xxii
DEDICATION . . . xxvi
CHAPTER 1 INTRODUCTION . . . 1
1.1 Analytical Applications of Electron Monochromator-Mass Spectrometry . . . 1
1.2 Formation of 2,6-Di-tert -butyl-4-nitrophenol during Combustion of Diesel Fuel Antioxidant Precursors . . . 2
1.3 Modified Matrix-Assisted Laser Desorption/Iionization MS Fatty acid profiling for bacterial identification . . . 2
1.4 Rapid Detection and Identification of Bacillus anthracis by γ Phage Amplification and Lateral Flow Immunochromatography . . . 3
1.5 Detection of Levamisole in Hospital Patients Presenting with Symptoms of Cocaine Abuse . . . 3
1.6 References Cited . . . 4
CHAPTER 2 ANALYTICAL APPLICATIONS OF ELECTRON MONOCHROMATOR-MASS SPECTROMETRY . . . 9
2.1 Introduction . . . 9
2.2.1 Ion Formation . . . 10
2.2.2 Chemical Ionization . . . 12
2.3 The Electron Monochromator . . . 12
2.3.1 Early Development of the Electron Monochromator . . . 13
2.3.2 Other Low-Energy Electron Sources . . . 14
2.3.3 Commercialization . . . 14
2.3.4 Operation . . . 15
2.4 Research at Oregon State University Prior to Commercialization . . . 17
2.4.1 Integration with Mass Spectrometry . . . 18
2.4.2 Addition of Gas Chromatography . . . 18
2.4.3 Analysis of Organophosphate Pesticides . . . 20
2.4.4 Analysis of Phthalates . . . 23
2.4.5 Buffer Gases in EM-MS . . . 25
2.4.6 Analysis of Polychloro-p-Dioxins (PCDD) . . . 26
2.4.7 Integration with Time-of-Flight (TOF) Technology . . . 29
2.5 Data Collected Using a JEOL USA TEEMTM . . . 31
2.5.1 Direct Analysis of Bacteria . . . 31
2.5.2 NPAH Cigarette Research . . . 37
2.5.3 Analysis of Explosives . . . 43
2.5.4 Diesel Exhuast Particulate Research . . . 47
2.5.5 Analysis of Exhaust Particulate from Heavy Equipment . . . 50
2.5.6 Theoretical Resonance Energy Studies . . . 53
2.7 References Cited . . . 55
CHAPTER 3 FORMATION OF 2,6-DI-TERT -BUTYL-4-NITROPHENOL DURING COMBUSTION OF DIESEL FUEL ANTIOXIDANT PRECURSORS . . . 64
3.1 Introduction . . . 64
3.2 Experimental . . . 65
3.3 Results and Discussion . . . 67
3.4 Supplemental Information Submitted to Energy and Fuels . . . 76
3.4.1 Particulate Matter Sampling . . . 76
3.5 Supplemental Experimental Information . . . 79
3.5.1 Extraction . . . 79
3.5.2 DBNP Molecular Ion . . . 82
3.5.3 Filters #10 and #11 . . . 82
3.6 Data from Collaboration with Keene State College . . . 83
3.7 References Cited . . . 95
CHAPTER 4 MODIFIED MATRIX-ASSISTED LASER DESORPTION/IONIZATION MS FATTY ACID PROFILING FOR BACTERIAL IDENTIFICATION . . . 98
4.1 Introduction . . . 98
4.2 Materials and methods . . . 100
4.2.1 Bacterial strains and growth conditions . . . 100
4.2.2 Lipid extraction . . . 102
4.2.3 Mass Spectrometry . . . 102
4.2.4 Statistical analysis . . . 103
4.4 Discussion . . . 110
4.5 Conclusions . . . 112
4.6 Appendix A: Additional Experimental and Discussion of the Prepare Program . . . 112
4.6.1 Corrected Values for Variance in Negative-Ion Data . . . 112
4.6.2 Basic Resolve and the Switch to R . . . 113
4.6.3 Prepare Software . . . 114
4.6.4 Statistical Analysis with R . . . 118
4.7 Appendix B: Code for PCA data analysis . . . 118
4.8 References Cited . . . 125
CHAPTER 5 RAPID DETECTION AND IDENTIFICATION OF BACILLUS ANTHRACIS BY γ PHAGE AMPLIFICATION AND LATERAL FLOW IMMUNOCHROMATOGRAPHY . . . 128
5.1 Introduction . . . 128
5.2 Materials and Methods . . . 131
5.2.1 Bacteria and Phage Stocks . . . 131
5.2.2 Characterization of Bacterial Growth . . . 132
5.2.3 Anti-Phage Antibodies . . . 132
5.2.4 Nanoparticle Reporter Preparation . . . 133
5.2.5 Laterial Flow Device Fabrication . . . 134
5.2.6 Determination of LFI Limit of Detection . . . 134
5.2.7 Phage Amplification and LFI Analysis . . . 135
5.3 Results . . . 135
5.3.2 Characterization of Bacterial Growth . . . 136
5.3.3 Determination of Optimal Detection Time . . . 138
5.4 Discussion . . . 139
5.5 Appendix A: Supplemental Information not Included in Article Submission . 141 5.5.1 LFI Sample Application . . . 141
5.5.2 Running Buffers . . . 141
5.5.3 Wet vs Dry Readings . . . 142
5.5.4 Propagation of New Phage, New Antibody, and the New LFI Strips . 142 5.5.5 Concentration of Antibodies and Reporter Particles . . . 142
5.5.6 The Effect of Sporulation . . . 143
5.6 References Cited . . . 143
CHAPTER 6 DETECTION OF LEVAMISOLE IN HOSPITAL PATIENTS PRESENTING WITH SYMPTOMS OF COCAINE ABUSE . . . 148
6.1 Introduction . . . 148
6.2 Experimental . . . 149
6.3 Results and Discussion . . . 152
6.4 Conclusion . . . 159
6.5 References Cited . . . 159
CHAPTER 7 CONCLUSION . . . 162
7.1 Analytical Applications of Electron Monochromator-Mass Spectrometry . . . 162
7.2 Formation of 2,6-Di-tert -butyl-4-nitrophenol during Combustion of Diesel Fuel Antioxidant Precursors . . . 162
7.3 Modified Matrix-Assisted Laser Desorption/Iionization MS Fatty Acid Profiling for Bacterial Identification . . . 163
7.4 Rapid Detection and Identification of Bacillus anthracis by γ Phage
Amplification and Lateral Flow Immunochromatography . . . 163 7.5 Detection of Levamisole in Hospital Patients Presenting with Symptoms of
Cocaine Abuse . . . 163 APPENDIX - SUPPLEMENTAL ELECTRONIC FILES . . . 164
LIST OF FIGURES
Figure 2.1 Mass spectrum of atrazine with a chlorine adduct. . . 13
Figure 2.2 Schematic of the EM-MS designed at OSU. . . 15
Figure 2.3 Schematic of the TEEMTM. . . 16
Figure 2.4 Resonance energy scans of the (a) molecular ion, (b) nitro fragment, and (c) phenyl fragment of nitrobenzene. . . 19
Figure 2.5 HCB and TNT mixture at (a) 0.03 eV and (b) 2.4 eV. . . 21
Figure 2.6 Chloride chromatograms (m/z 35) for (a) Arochlor 1254, (b) expanded region of panel (a), and (c) arctic trout muscle. . . 22
Figure 2.7 Resonance energy maps for (a) parathion and (b) paraoxon. . . 23
Figure 2.8 Three-dimensional REC-MS spectrum of CCl4. . . 29
Figure 2.9 Electron energy spectra of CCl4 fragment ions. . . 30
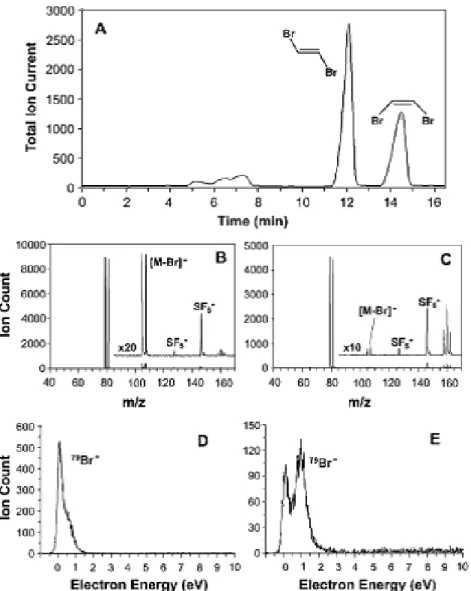
Figure 2.10 Data for cis- and trans-dibromoethene. (a) GC elution profile. (b) Mass spectrum of trans-dibromoethene. (c) Mass spectrum of cis-dibromoethene. (d) Resonance energy spectrum of trans-dibromoethene. (e) Resonance energy spectrum of cis-dibromoethene. . . 32
Figure 2.11 Bacillus cereus spores at 100%, 60%, and 1% concentrations. . . 34
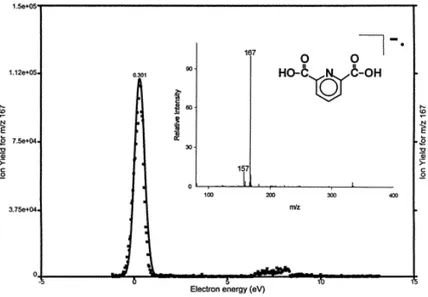
Figure 2.12 Electron energy versus ion yield for DPA with corresponding mass spectrum (inset) showing the molecular ion. . . 35
Figure 2.13 Bacillus cereus spores at 1% analyzed at 0.3 eV. . . 35
Figure 2.14 Electron energy and SIM profiles of P. fluorescens. . . 36
Figure 2.15 Chromatograms at m/z 46 for (a) 2R4F, (b) Burley, (c) Bright, and (d) oriental tobaccos. . . 39
Figure 2.17 Chromatograms at m/z 46 for 2R4F (a) mainstream tobacco smoke (b) tobacco extract. . . 42 Figure 2.18 (a) Positive-ion scan of unknown peak in 2R4F extract. (b) NIST
database search result. . . 42 Figure 2.19 Total ion chromatogram showing separation and identification of
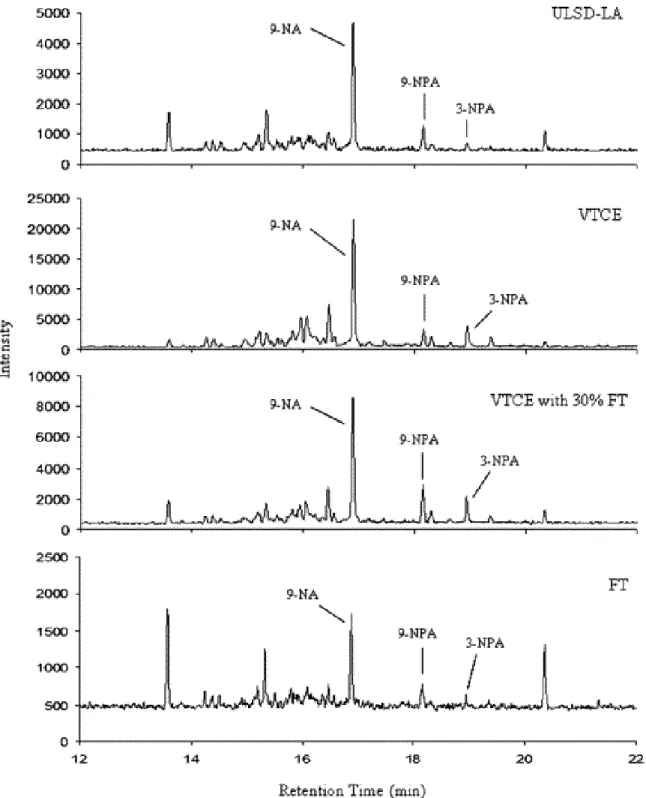
compounds in EPA 8095 Matrix Spike solution A. . . 44 Figure 2.20 Total ion chromatograms comparing methods A and B. . . 46 Figure 2.21 Total ion chromatograms for methods C and D. . . 46 Figure 2.22 The m/z 46 chromatograms showing some identified NPAHs in each
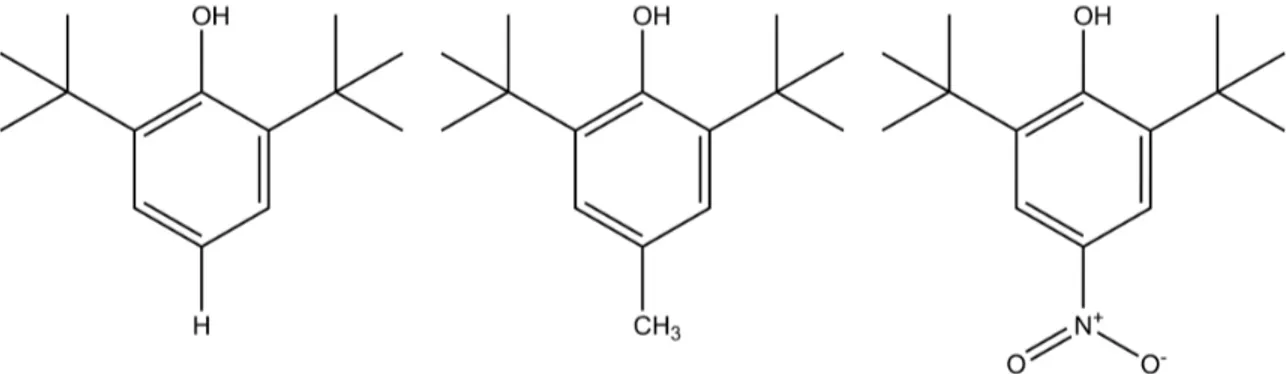
tested fuel. . . 48 Figure 2.23 Chromatograms at m/z 46 for ULSD (Cert), B20, and B100. . . 50 Figure 2.24 NO−2 chromatogram of biodiesel. . . 52 Figure 3.1 Structures for 2,6-di-tert -butylphenol (DTBP),
2,6-di-tert -butyl-4-methylphenol (BHT), and
2,6-di-tert -butyl-4-nitrophenol (DBNP). . . 65 Figure 3.2 Chromatogram for m/z 46 of 100% biodiesel from previous studies
showing the unknown (Unk) peak at 13.6 min. A majority of the
unmarked peaks have been identified and reported by Ratcliff et al. . . . 68 Figure 3.3 Chromatogram for m/z 46 of extracted cabin air particles from a heavy
front-end loader using a 20% biodiesel blend. . . 69 Figure 3.4 Chromatograms for m/z 46 of the three spiking conditions at 1500
rpm-2 bar. . . 71 Figure 3.5 Quantity of DBNP detected in exhaust PM for each fuel tested at
various engine speeds/loads. . . 73 Figure 3.6 DBNP produced per kilogram of fuel consumed at different engine
speeds/loads for each sample type. . . 74 Figure 3.7 Data and results of ANOVA analysis from the BHT study. . . 77 Figure 3.8 Data and results of ANOVA analysis from the DTBP study. . . 78
Figure 4.1 Positive-ion mass spectra of fatty acids for selected bacteria. (a) E.
faecalis, (b) B. anthracis, (c) E. coli and (d) Y. pestis. . . 105 Figure 4.2 Spectra illustrating steric effects on fatty acid peak intensities from
phospholipid standards: (a)
1-Oleoyl-2-palmitoyl-sn-glycero-3-phosphocholine. (b)
1-Palmitoyl-2-oleoyl-sn-glycero-3-phosphocholine. . . 105 Figure 4.3 PCA plot of bacterial MOLI MS spectra derived in positive-ion mode. . 106 Figure 4.4 Negative-ion mass spectra of fatty acids for selected bacteria: (a) E.
faecalis, (b) B. anthracis, (c) E. coli and (d) Y. pestis. . . 108 Figure 4.5 PCA plot of bacterial MOLI MS spectra derived in negative-ion mode. . 109 Figure 4.6 Basic Resolve PCA plot of MOLI spectra collected for B. anthracis (B),
E. faecalis (E), C. putrefaciens (C), L. monocytogenes (L), S. aureus (S), A. baumannii (a), E. coli (e), F. tularensis (f), S. typhimurium (t), and Y. pestis (y). . . 114 Figure 4.7 Basic Resolve PCA plot of MOLI spectra after refinement of extraction
procedure. B. anthracis (B), E. faecalis (E), C. putrefaciens (C), L. monocytogenes (L), S. aureus (S), A. baumannii (a), E. coli (e), F.
tularensis (f), S. typhimurium (t), and Y. pestis (y). . . 115 Figure 4.8 Basic Resolve PCA plot of MOLI spectra collected on the JEOL
SpiralTOF. B. anthracis (B), E. faecalis (E), C. putrefaciens (C), L. monocytogenes (L), S. aureus (S), A. baumannii (a), E. coli (e), F.
tularensis (f), S. typhimurium (t), and Y. pestis (y). . . 116 Figure 4.9 Basic Resolve PCA plot of MOLI spectra collected on the JEOL
DART. B. anthracis (B), E. faecalis (E), C. putrefaciens (C), L. monocytogenes (L), S. aureus (S), A. baumannii (a), E. coli (e), F.
tularensis (f), S. typhimurium (t), and Y. pestis (y). . . 116 Figure 5.1 Phage amplification and LFI for bacterial identification. A.
Species-specific γ phage infection of B. anthracis results in host cell lysis and release of progeny phage. B. Anti-γ phage antibody-surface conjugated dyed nanoparticle reporters bind phages and concentrate them on LFI detection membrane. C. Phage-nanoparticle complex concentration on detection membrane results in formation of colored
line as indicator of the presence of B. anthracis. . . 130 Figure 5.2 Exploded diagram of a phage amplification-coupled LFI device. . . 136
Figure 5.3 Determination of limit of γ phage LFI detection in the presence of B.
anthracis. . . 137 Figure 5.4 B. anthracis growth curve. Bacterial growth was tracked over 9 hrs and
cfu/mL correlated to OD625 in order to derive a quick reference curve for determining bacterial concentration during phage amplification LFI detection experiments. . . 138 Figure 5.5 Determination of γ phage amplification-based B. anthracis detection
time. . . 139 Figure 6.1 Structure of levamisole. . . 149 Figure 6.2 Photos of a patient who had recently used crack cocaine contaminated
with levamisole. . . 150 Figure 6.3 Vasculitis from levamisole-laced cocaine resulting in skin ulcerations
and necrosis. . . 151 Figure 6.4 Total ion chromatogram of urine sample P1 showing the presence of
levamisole and cocaine. . . 153 Figure 6.5 Mass spectra for (a) cocaine and (b) levamisole in urine sample P1. . . 154 Figure 6.6 Total ion chromatogram of the New Jersey urine sample. Levemisole
and cocaine are indicated at their appropriate retention times, however, peaks are not sufficiently above the noise for identification based on
standard retention time. . . 155 Figure 6.7 Total ion chromatogram of the New Orleans urine sample. The cocaine
peak is not suffiently higher than the noise. . . 156 Figure 6.8 SIM chromatogram of the New Jersey urine sample confirming the
presence of levamisole and cocaine by the presence of their major mass
spectral peaks. . . 157 Figure 6.9 SIM chromatogram of the New Orleans urine sample confirming the
LIST OF TABLES
Table 2.1 Resonance energies for fragments produced by substituted phthalates;
N/A = not applicable, X = not observed. . . 24
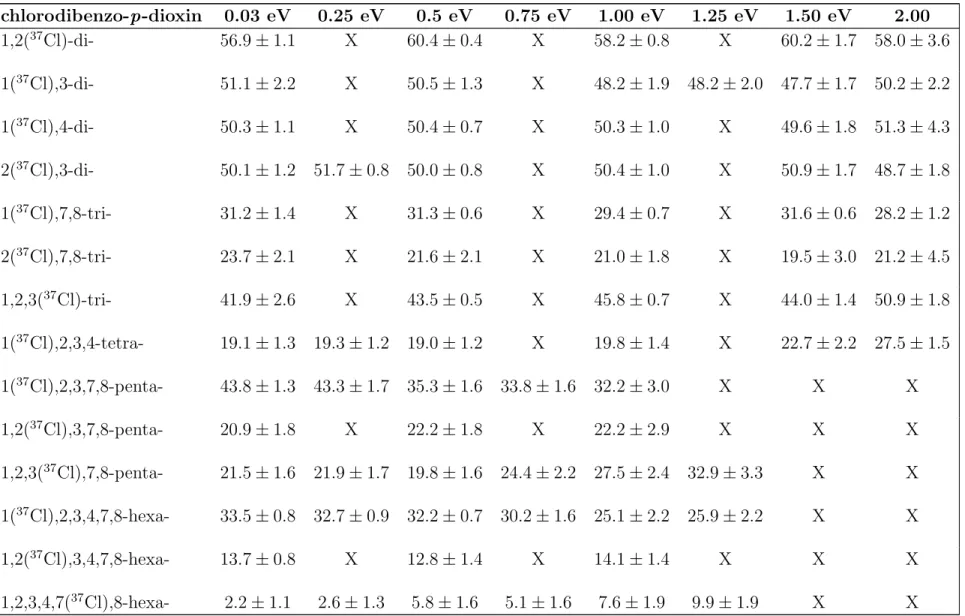
Table 2.2 Percent 37Cl loss of total Cl− loss from the labeled position at the indicated electron energies (eV). . . 27
Table 2.3 Quantities of nitro aromatics in 2R4F mainstream cigarette smoke. . . 40
Table 2.4 Quantities of nitro aromatics in Burley mainstream cigarette smoke. . . 40
Table 2.5 Components of EPA 8095 Matrix Spike solution A. . . 44
Table 2.6 Results from SPME extraction of explosives from complex matrices. . . 45
Table 2.7 NPAH content of analyzed fuels. . . 49
Table 2.8 Engine-out NPAH emissions from 8-mode composite PM samples in picograms per brake horsepower-hour (pg/bhp-hr). . . 51
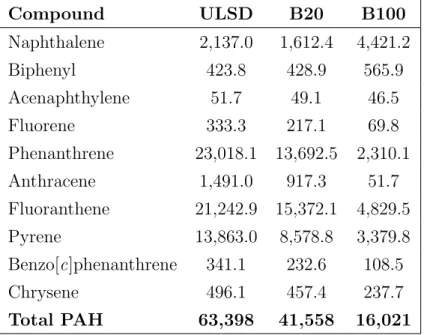
Table 2.9 Engine-out PAH emissions from 8-mode composite PM samples in picograms per brake horsepower-hour (pg/bhp-hr). . . 51
Table 3.1 Regression coefficient p-values for DBNP production for engine speed, engine load, and antioxidant content. . . 72
Table 3.2 Summary of PM, DBNP, and NO2 quantities and exhaust temperatures measured as a function of engine speed/load. . . 75
Table 3.3 Specifications of the GM A20DTH 2.0L European diesel engine. . . 79
Table 3.4 Engine conditions for each PM sample collected. . . 80
Table 3.5 Soxhlet cycle information and final volumes of samples. . . 81
Table 3.6 PAH content of PM collected at Keene Recycling Center in 2009. . . 84
Table 3.7 NPAH content of PM collected at Keene Recycling Center in 2009. . . 86
Table 3.9 NPAH content of PM collected at Keene Recycling Center in 2011. . . 92
Table 4.1 Bacterial phylotypes used in this study. . . 101
Table 4.2 Fatty acids used in principal components analysis. . . 103
Table 4.3 Percentage of total variance for each principal component. . . 107
Table 4.4 Corrected percentage of total variance for each principal component in negative-ion data. . . 113
Table 6.1 Summary of qualitative results indicating positive (+) or negative (-) presence of levamisole and cocaine. . . 159
Table A.1 Description of files for the Prepare software. . . 164
LIST OF SCHEMES
Scheme 2.1 Proposed mechnism that produces a neutral alkene and the phthalic
anhydride ion. . . 25
Scheme 2.2 Loss of 37Cl from the 7 position in
1,2,3,4,7(37Cl),8-hexachlorodibenzo-p-dioxin . . . 28
Scheme 2.3 Loss of Cl from the 2 position in
1,2,3,4,7(37Cl),8-hexachlorodibenzo-p-dioxin. . . 28
LIST OF ABBREVIATIONS
A. baumannii . . . Acinetobacter baumannii B. anthracis . . . Bacillus anthracis B. cereus . . . Bacillus cereus B100 . . . 100% Biodiesel B20 . . . 20% Biodeisel/80% Conventional Diesel BHI . . . Brain Heart Infusion C. putrefaciens . . . Clostridium putrefaciens CI . . . Chemical Ionization CIMS . . . Chemical Ionization Mass Spectrometry CSM . . . Colorado School of Mines CV . . . Cross Validation CaO . . . Calcium Oxide DART . . . Direct Analysis in Real Time DBNP . . . 2,6-Di-tert -butyl-4-nitrophenol DPA . . . Dipicolinic Acid E. coli . . . Escherichia coli E. faecalis . . . Enterococcus faecalis EA . . . Electron Affinity EM . . . Electron Monochromator EM-MS . . . Electron Monochromator-Mass Spectrometry
EPA . . . Environmental Protection Agency F. tularensis . . . Francisella tularensis FA . . . Fatty Acid FAME . . . Fatty Acid Methyl Ester GC . . . Gas Chromatography GC/MS . . . Gas Chromatography/Mass Spectrometry HCB . . . Hexachlorobenzene HCl . . . Hydrochloric Acid HPLC . . . High Performance Liquid Chromatography I-SPME . . . Immersion Solid-Phase Micro-Extraction L. monocytogenes . . . Listeria monocytogenes LB . . . Lauria Bertani LOD . . . Limit of Detection LUMO . . . Lowest Unoccupied Molecular Orbital MALDI MS . . . Matrix-Assisted Laser Desorption/Ioniation Mass Spectrometry MOLI MS . . . Metal Oxide Laser Ionization Mass Spectrometry MS . . . Mass Spectrometry NICI . . . Negative-Ion Chemical Ionization NIMS . . . Negative-Ion Mass Spectrometry NIST . . . National Institute of Standards and Technology NPAH . . . Nitro-Polycyclic Aromatic Hydrocarbon Nd:YLF . . . Neodymium-doped Yttrium Lithium Fluoride OFN . . . Octafluoronaphthalene
OSU . . . Oregon State University PAH . . . Polycyclic Aromatic Hydrocarbon PBS . . . Phosphate Buffered Saline PC . . . Principal Component PCA . . . Principal Components Analysis PCDD . . . Polychlorodibenzo-p-dioxin PM . . . Particulate Matter Py-MS . . . Pyrolysis-Mass Spectrometry R . . . The R Project for Statistacal Computing RDX . . . 1,3,5-Trinitroperhydro-1,3,5-triazine RE . . . Resonance Energy REC MS . . . Resonance Electron Capture Mass Spectrometry S. aureus . . . Staphylococcus aureus S. typhimurium . . . Salmonella typhimurium S/N . . . Signal-to-Noise SIM . . . Selected-Ion Monitoring SPE . . . Solid-Phase Extraction TMAH . . . Tetramethyl Ammonium Hydroxide TNT . . . 2,4,6-Trinitrotoluene TOF . . . Time-of-Flight UCH . . . University of Colorado Hospital ULSD-LA . . . Ultra-Low Sulfur Diesel-Low Aromatic UPRM . . . University of Puerto Rico-Mayag´’uez
VTCE . . . Valero Texas City EPA Y. pestis . . . Yersinia pestis
ACKNOWLEDGMENTS
This is my favorite part to write, because 1) I don’t have to write like a boring old scientist and 2) it’s an eye-opening retrospective of my graduate school experience and I realize just how many people helped me along the way. There’s certainly a “it takes a village to raise a child” kind of paradigm in which a large number of people have offered their knowledge and support to provide better opportunities for this pupil, but it’s really much more than that. I made a lot of friends, and not just passing acquaintances, but friends who have struggled, fought, and shed the same tears along the way. There are also the mentors who have had great impacts on my experience and demeanor, and in whom I hold the highest respect. Even though there are many to whom I owe thanks, I will only mention a few here so that this work isn’t just a book of names of awesome people.
I’d like to begin by thanking my adviser, Dr. Kent Voorhees. He took me in as a (much) young(er) graduate student to pursue an expertise in mass spectrometry. Like myself, he has strong ties to Utah, so even in the early stages of my graduate career, I found his style and persona very familiar. He has provided lots of guidance on the road to a doctorate, and also steered my education toward microbiology and statistics. I would have never considered studying in these areas, and I have found that besides enhancing my skillset, I have also really enjoyed learning what they have to offer. Dr. Voorhees was certainly tough, but I know I will come out a better scientist, and that I can be confident in the education I have received.
Next, I would like to thank my thesis committee for taking an interest in my education: Drs. Bob McCormick, Mark Eberhart, Matt Posewitz, and David Marr. Dr. McCormick provided invaluable support on the fuel projects on worked on. It was always a pleasure to work with him and his attitude towards the work was always encouraging. Dr. Mark Eberhart’s expertise lies in area of chemistry I know I have always been weak in: theoretical.
While writing the review article on electron monochromator-mass spectrometry (chapter 2), there were theoretical studies that were very difficult for me to grasp. His instruction helped me move beyond the roadblock and enhance my understanding of topics that were formerly alien to me. Dr. Matt Posewitz has provided a lot of support in microbiology knowledge. Additionally, he has given me a good perspective on how things work in academia, what kind of barriers to expect, and how to work around them. I took Dr. Marr’s microfluidics class my first semester at Mines. I had not had any classwork for three years, and I certainly didn’t have any background knowledge in fluids. Despite pulling out a few hairs, Dr. Marr was able to get me up to speed and give me the support I needed to succeed, which also prompted me to request him as a committee member.
When I say Dr. Chris Cox was the key to my survival at Mines, I’m not being glib. He had the arduous task of training a chemist to be microbiologist, which certainly wasn’t easy. He provided excellent guidance and support, which gradually increased my expertise in microbiology. He also edited a number of my rough drafts, and more than anyone, increased my ability as a scientific writer. The best part about him, though, is how often I saw him on the other side of the bench. It’s one thing to instruct and assign tasks, but it’s another thing completely to see that same person sitting across from you and helping scrape bacteria off plates for long hours and into the evening. Eventually, my lab comrade turned into a valuable friend, someone I could work with easily, but also hang out with after work and not talk shop. This friendship came at a critical time when I was thinking of giving up on my degree. He provided a lot of insight and extra help when I was trying to make my decision. After I decided to stay, he provided the most practical advice on how to persevere. This, above all else, was what ensured my resolve through the end, and I will never forget his contribution and support.
None of this research would have ever happened without the help of Ed Dempsey. He spent countless hours helping me repair instruments and keeping them running smoothly. He also had excellent insight on how to solve problems due to his vast experience. He was
always willing to help and often spent late hours of his personal time to make sure I could collect data again as soon as possible. He also turned into a valuable friend, and I can never thank him enough for all his assistance.
Several other members of the Department of Chemistry and Geochemistry have also provided a lot of support. Dr. Patrick MacCarthy often provided advice on analytical problems and also offered a lot of good advice on life. I have enjoyed the times he shared his personal experiences with me. Drs. Seger and Falconer both nourished my desire to teach, and often went out of their way to help me improve. Dr. Yuan Yang taught me how to use NMR and offered excellent discussions when I was stuck on something. Joe Stranahan and Ramona Figueroa were awesome about helping out with lab supplies, especially when I needed an apparatus to finish an experiment, or a raw material I only needed small amounts of. Lastly, Christine Ralston and Angela Knighton who provided assistance with endless administrative problems I encountered during my time at Mines.
Beyond Mines, I would like to thank Drs. Chip Cody and John Dane of JEOL USA, Inc. for their support on the electron monochromator. Dr. Dane also provided help with issues related to my fuel projects. I was able to move beyond several problems quickly thanks to his experience. He also provided good moral support when times were tough. Dr. D.H. Gordon has also been an invaluable mentor. Not only did he teach me Japanese, but he has met with me every week to help me understand Japanese culture, give advice on surviving graduate school, and help me with my problems, be they school or life related.
To Mark Risner and his wife Dawn, I’d like to thank them for putting up with all my whining about work. Being able to get away and play some video games was more therapudic than I can express. But they have also been watching me for a long time and always supporting me, even if it was just an invitation to get out of town. Tony Spease and Sandi Tucker have also been with me the whole way, often providing moral support or even just offering to buy me a meal. Drs. Misty Rowe and Ray Runyon were my upper classmen mentors, taking me under their wings and teaching me the way of a graduate student at
Mines. I will never forget Ray’s excellent suggestions for my research and Misty’s kind support when things didn’t go right.
Now I’d like to thank my parents, Richard T. and Carol P. Jensen. They have supported my education in every way possible. They, above anyone else, got the most desperate phone calls and cries for help. They listened to all my frustrations and heartbreaks and did anything they could to alleviate them. Sometimes, a home-cooked meal from my mom and a game of golf with my dad were what I really needed to reset. They also provided my with a place to get some work done when I just couldn’t be productive at the school. I certainly couldn’t have made it without them, and I want to make them proud, always.
Finally, I want to offer my love and thanks to my lovely wife, Koume-chan. I never could have thought that when we met, she would play such an important role in my graduate school career. She was my loudest supporter and my biggest joy. She has waited patiently for every time we could meet, and for me to finish so that we can be together always. I want to make her proud, also, and I can’t wait for the moment when we can be reunited. She is my most beloved. Thank you from the bottom of my heart.
Watashi no konyakusha no Koume-chan ni arigatou to iitai desu. Deatta toki wa made Koume-chan ga konna ni mo watashi ni totte taisetsu na hito ni naru to wa omoimasen deshita. Kanojo wa watashi no ichiban no sap¯ot¯a de ichiban no yorokobi desu. Mata aeru made Koume-chan wa zutto nintaitsuyoku matte kurete imasu. Gakkou ga owattara au koto ga dekimasu. Koume-chan ni watashi no koto wo hokori ni omotte hoshii desu. mata aeru toki made machikiremasen. Watashi no taisetsu na saisai no hito desu. Kokoro kara kansha shite imasu.
These projects were funded by the U.S. Department of Energy (National Renewable Energy Laboratory subcontract #A-3-33607-00), the U.S. Department of Defense (Defense Threat Reduction Agency grant #W81XWH-07-C-0061), the National Institute of Health contract #U54 AI065357, and the Colorado School of Mines Department of Chemistry and Geochemistry through teaching assisstantships.
The work is dedicated to my wonderful parents, Richard T. and Carol P. Jensen, for their endless support of my educational pursuits, and to my loving wife, Koume, for her patience
CHAPTER 1 INTRODUCTION
Science research has become increasingly multidisciplinary. Specialization requires that the analytical chemist become proficient in other disciplines such as analytical-physical chem-istry or physical-organic chemchem-istry. To pursue even more diverse scientific endeavors, exper-tise in other fields such as geology or microbiology is required. This volume of work contains four studies and a review article which include the topics of (1) electron monochromator-mass spectrometry (EM-MS), (2) production of nitro aromatic compounds from antioxidants in diesel fuel, (3) rapid, indirect detection of B. anthracis using lateral flow immunochro-matograpy, (4) bacterial identification from fatty acid profiles generated with metal oxide laser desorption/ionization, and (5) detection of levamisole in biological samples from pa-tients who had recently used cocaine. Even though there is no common theme to these projects, they fall under three major areas of research: EM-MS, bacterial identification, and drug analysis.
1.1 Analytical Applications of Electron Monochromator-Mass Spectrometry To begin, a review on EM-MS is presented. While not a common technique, EM-MS uses a monochromatic electron source with mass spectrometry (MS) to overcome the problems that arise from using chemical ionization to produce negative ions.1–5 Historical develop-ment leading to research completed at Oregon State University (OSU) is presented.1,2,6,7 Max Deinzer and coworkers published studies on an EM design that provides intense ion-ization current with low electron energy spread suitable for analytical MS applications.3 The OSU design was further refined by JEOL USA, Incorporated (Peabody, MA) and re-leased as a commercial product trademarked as the Tunable Electron Energy Monochromator (TEEMTM). The TEEMTMwas used by researchers at Colorado School of Mines to detect the first nitro polycyclic aromatic hydrocarbons (NPAHs) in cigarette smoke.8–11 The TEEMTM
was also used to directly analyze bacteria by looking for biomarkers, determine nitro aro-matic content of biodiesel particulate matter, and to confirm resonance energies calculated by theoretical methods.12–18Additional applications of EM-MS are described in a subsequent chapter.
1.2 Formation of 2,6-Di-tert -butyl-4-nitrophenol during Combustion of Diesel Fuel Antioxidant Precursors
In 2005, a study was published describing sailors aboard a US nuclear submarine that returned from a tour of duty coated with a substance that gave them an orange appearance.19 The compound causing this orange hue was determined to be 2,6-di-tert -butyl-4-nitrophenol (DBNP), which was formed when electrostatic precipitators nitrated 2,6-di-tert -butylphenol (DTBP), an antioxidant added to turbine lubricant, during air filtration. 4-Methyl-2,6-di-tert -butylphenol (BHT) and DTBP are both listed as possible fuel additives to resist oxidation, gum formation, and lacquering.20–22 To test whether these additives were directly correlated to the formation of DBNP, ultra-low sulfur diesel fuel samples were spiked with each precursor separately. Exhaust particulate matter (PM) was collected during combustion of each fuel type. Nitro compounds were extracted, analyzed by EM-MS, and then compared to particulate matter from unspiked control samples. Multivariate statistical analysis was used to validate observed correlations.
1.3 Modified Matrix-Assisted Laser Desorption/Iionization MS Fatty acid pro-filing for bacterial identification
Traditional methods of bacterial identification rely on traditional microbiological typing methods, such as phenotypic observation and rRNA 16s sequencing. A more recent develop-ment uses matrix-assisted laser desorption/ionization MS (MALDI MS) to identify bacteria based on protein profiling.23–25While protein profiling has recently been approved by the US Food and Drug Administration and European CE mark for clinical use, there are still some genera that cannot be positively identified by this method.26Metal oxides have recently been reported as a matrix-replacement for MALDI MS.27Additionally, the use of CaO as a matrix
with phospholipids allows in situ cleavage of the fatty acids using the MALDI laser.28Using this method, a fatty acid mass spectrum profile was generated for E. coli. Fatty acid profiles were previously shown to be useful in bacterial identification.29–33 Ten genera of bacteria were analyzed using metal oxide laser ionization MS (MOLI) with a CaO matrix. Fatty acid profiles were exported for principal components analysis to look for unsupervised separation. All results were cross-validated.
1.4 Rapid Detection and Identification of Bacillus anthracis by γ Phage Am-plification and Lateral Flow Immunochromatography
Both bioterrorism and recent bacteria outbreaks have increased demand for rapid bacte-rial identification. In many cases, decreased time to detection results in better prognoses and better insight as to which antibiotic regimens will be effective. Current methods of B. an-thracis detection take 24-48 hours, partially due the requirement of preparing a culture.34–38 A method that is fast, easy, and small would be of interest to first-responders and military personnel who are constantly exposed to bioterrorism dangers. In this study, γ phage was used as a means to detect B. anthracis by using bacterial host machinery to amplify the number of phage available for detection. Detection of γ phage was accomplished by lateral flow immunochromatography (LFI) assay,39 which uses anti-γ antibodies to arrest reporter nanoparticles to show a visible line on the strip if γ phage is present. Gamma phage is added to a sample suspected of contamination, and will amplify if B. anthracis is present. The γ phage concentration will increase and become detectable by LFI. In this way, the presence of B. anthracis is confirmed without needing a high input concentration of bacteria.
1.5 Detection of Levamisole in Hospital Patients Presenting with Symptoms of Cocaine Abuse
It is well known that illicit drugs were diluted (cut) with similar, cheaper compounds in order to increase profit.40 As the drug market changed, the need to dilute drugs became less important, however, lacing the drug to change its effects is still commonplace.41For cocaine, one such compound is levamisole. It is cheap, readily available, and is known to have
mood-elevating effects, all which make it a prime candidate as a cutting/lacing agent.42–44 Levamisole was developed as an antihelminthic to treat parasite infections, but was removed from US and Canadian markets due to serious side effects.45 Some individuals who have used cocaine presented to hospitals with symptoms similar to side-effects of levamisole use. Urine, blood, and tissue samples were collected from these patients and tested for levamisole and cocaine to determine if cocaine used by the patients was cut with levamisole and if their symptoms are the result of levamisole poisoning.
1.6 References Cited
[1] Stamatovic, A. and Schulz, G.J. Characteristics of the Trochoidal Electron Mono-chromator. Rev. Sci. Instrum. 1970 41:423–427 URL http://link.aip.org/link/?RSI/ 41/423/1http://dx.doi.org/10.1063/1.1684534.
[2] Illenberger, E.; Scheunemann, H.U. and Baumg¨artel, H. Negative Ion Formation in CF2Cl2, CF3Cl and CFCl3 Following Low Energy (0-10 eV) Impact with Near Mo-noenergetic Electrons. Chem. Phys. 1979 37:21–31 URL http://dx.doi.org/10.1016/ 0301-0104(79)80003-8.
[3] Laram´ee, J.A.; Mazurkiewicz, P.H.; Berkout, V.D. and Deinzer, M.L. Electron Monochromator-Mass Spectrometer Instrument for Negative-Ion Analysis of Electroneg-ative Compounds. Mass Spectrom. Rev. 1996 15:15–42.
[4] Hunt, D.F. and Crow, F.W. Electron Capture Negative Ion Chemical Ionization Mass Spectrometry. Anal. Chem. 1978 50:1781–1784 URL http://dx.doi.org/10.1021/ ac50035a017.
[5] Hunt, D.F. and Sethi, S.K. Gas-Phase Ion/Molecule Isotope-Exchange Reactions: Methodology for Counting Hydrogen Atoms in Specific Organic Structural Environ-ments by Chemical Ionization Mass Spectrometry. J. Am. Chem. Soc. 1980 102:6953– 6963 URL http://dx.doi.org/10.1021/ja00543a009.
[6] Nottingham, W.B. Ionization and Excitation in Mercury Vapor Produced by Elec-tron Bombardment. Phys. Rev. 1939 55:203–219 URL http://link.aps.org/doi/10.1103/ PhysRev.55.203.
[7] Fox, R.E.; Hickam, W.M.; Grove, D.J. and Kjeldaas, J.T. Ionization in a Mass Spec-trometer by Monoenergetic Electrons. Rev. Sci. Instrum. 1955 26:1101–1107 URL http://dx.doi.org/10.1063/1.1715198.
[8] Dane, A.J. The Identification and Characterization of Nitro Aromatic Compounds in Mainstream Tobacco Smoke Using Electron Monochromator-Mass Spectrometry. Ph.D. thesis Colorado School of Mines 2006.
[9] Dane, A.J.; Havey, C.D. and Voorhees, K.J. The Detection of Nitro Pesticides in Main-stream and SideMain-stream Cigarette Smoke Using Electron Monochromator-Mass Spec-trometry. Anal. Chem. 2006 78:6283 URL http://dx.doi.org/10.1021/ac061309p. [10] Dane, A.J.; Ratcliff, M.A.; McCormick, R.L. and Voorhees, K.J. Monitoring the Effect
of Biodiesel Blend on the Production of Nitro-Polycyclic Aromatic Hydrocarbons in Diesel Engine Exhaust Using Electron Monochromator-Mass Spectrometry. In 234th ACS Natl. Meet. Boston, MA, United States 2007 .
[11] Havey, C.D.; Dane, A.J.; Abbas-Hawks, C. and Voorhees, K.J. Detection of Nitro-Polycyclic Aromatic Hydrocarbons in Mainstream and Sidestream Tobacco Smoke Using Electron Monochromator-Mass Spectrometry. Environ. Chem. Lett. 2009 7:331–336 URL http://dx.doi.org/10.1007/s10311-008-0174-x.
[12] Beverly, M.B.; Voorhees, K.J.; Hadfield, T.L. and Cody, R.B. Electron Monochromator Mass Spectrometry for the Analysis of Whole Bacteria and Bacterial Spores. Anal. Chem. 2000 72:2428–2432 URL http://dx.doi.org/10.1021/ac991318g.
[13] Havey, C.D. Mass Spectrometric Analysis of Bacillus Anthracis Spores and Nitro Com-pounds in Diesel Soot and Sidestream Tobacco Smoke. Ph.D. thesis Colorado School of Mines Golden, Colorado 2006.
[14] Havey, C.D.; McCormick, R.L.; Hayes, R.R.; Dane, A.J. and Voorhees, K.J. Analysis of Nitro-Polycyclic Aromatic Hydrocarbons in Conventional Diesel and FischerTropsch Diesel Fuel Emissions Using Electron Monochromator-Mass Spectrometry. Anal. Chem. 2006 78:4894–4900 URL http://dx.doi.org/10.1021/ac060400q.
[15] Dane, A.J. Investigation of Nitro-Organic Compounds in Engine Exhaust. Tech. rep. National Renewable Energy Laboratory Golden, Colorado 2008.
[16] Ratcliff, M.A.; Dane, A.J.; Williams, A.; Ireland, J.; Luecke, J.; McCormick, R.L. and Voorhees, K.J. Diesel Particle Filter and Fuel Effects on Heavy-Duty Diesel Engine Emissions. Environ. Sci. Technol. 2010 44:8343–8349 URL http://dx.doi.org/10.1021/ es1008032.
[17] Traviss, N.; Thelen, B.A.; Ingalls, J.K. and Treadwell, M.D. Biodiesel Versus Diesel: A Pilot Study Comparing Exhaust Exposures for Employees at a Rural Municipal Facility. J. Air Waste Manag. Assoc. 2010 60:1026–1033.
[18] Havey, C.D.; Eberhart, M.; Jones, T.; Voorhees, K.J.; Laram´ee, J.A.; Cody, R.B. and Clougherty, D.P. Theory and Application of Dissociative Electron Capture in Molecular Identification. J. Phys. Chem. A 2006 110:4413–4418 URL http://dx.doi.org/10.1021/ jp056166+.
[19] Still, K.R.; Jung, A.E.; Ritchie, G.D.; Jederberg, W.W.; Wilfong, E.R.; Briggs, G.B. and Arfsten, D.P. Disposition of 2,6-Di-tert -butyl-4-nitrophenol (DBNP), a Submarine At-mosphere Contaminant, in Male Sprague-Dawley Rats. Environ. Res. 2005 98(3):363– 367 URL http://dx.doi.org/10.1016/j.envres.2004.08.009.
[20] O’Rear, D.J. and Sundberg, J.E. Stable Olefinic, Low Sulfur Diesel Fuels. United States Patent #2004148850 2004.
[21] Harstick, C.S. and Lam, W.Y.L. Composition Containing a Mannich Base of a Partially Sulfurized Hindered Phenol Mixture. United States Pat. #5166439 1992.
[22] Arondel, M.; Dequenne, B. and Rodeschini, H. Additive Compositions that Improve the Lacquering Resistance of Superior Diesel or Biodiesel Fuels. France Patent #2984918A1 2013.
[23] Bizzini, A.; Durussel, C.; Bille, J.; Greub, G. and Prod’hom, G. Performance of Matrix-assisted Laser Desorption Ionization-Iime of Flight Mass Spectrometry for Identification of Bacterial Strains Routinely Isolated in a Clinical Microbiology Laboratory. J. Clin. Microbiol. 2010 48(5):1549–1554 URL http://dx.doi.org/10.1128/JCM.01794-09. [24] Lay, Jr., J.O. MALDI-TOF Mass Spectrometry of Bacteria. Mass Spectrom. Rev. 2001
20(4):172–194.
[25] Sandrin, T.R.; Goldstein, J.E. and Schumaker, S. MALDI TOF MS Profiling of Bacteria at the Strain Level: A Review. Mass Spectrom. Rev. 2012.
[26] Cherkaoui, A.; Hibbs, J.; Emonet, S.; Tangomo, M.; Girard, M.; Francois, P. and Schrenzel, J. Comparison of Two Matrix-Assisted Laser Desorption Ionization-Time of Flight Mass Spectrometry Methods with Conventional Phenotypic Identification for Routine Identification of Bacteria to the Species Level. J. Clin. Microbiol. 2010 48(4):1169–1175 URL http://dx.doi.org/10.1128/JCM.01881-09.
[27] McAlpin, C.R.; Voorhees, K.J.; Corpuz, A.R. and Richards, R.M. Analysis of Lipids: Metal Oxide Laser Ionization Mass Spectrometry. Anal. Chem. 2012 84(18):7677–7683 URL http://dx.doi.org/10.1021/ac300688u.
[28] Voorhees, K.J.; McAlpin, C.R. and Cox, C.R. Lipid Profiling Using Catalytic Pyrol-ysis/Metal Oxide Laser Ionization-Mass Spectrometry. J. Anal. Appl. Pyrolysis 2012 98:201–206 URL http://dx.doi.org/10.1016/j.jaap.2012.07.004.
[29] Vestal, J.R. and White, D.C. Lipid Analysis in Microbial Ecology: Quantitative Ap-proaches to the Study of Microbial Communities. Bioscience 1989 39(8):535–541. [30] Odham, G.; Tunlid, A.; Westerdahl, G.; Larsson, L.; Guckert, J.B. and White, D.C.
Determination of Microbial Fatty Acid Profiles at Femtomolar Levels in Human Urine and the Initial Marine Microfouling Community by Capillary Gas Chromatography-Chemical Ionization Mass Spectrometry with Negative Ion Detection. J. Microbiol. Methods 1985 3(5-6):331–344 URL http://dx.doi.org/10.1016/0167-7012(85)90015-6. [31] Breitschwerdt, E.B.; Kordick, D.L.; Malarkey, D.E.; Keene, B.; Hadfield, T.L. and
Wilson, K. Endocarditis in a Dog Due to Infection with a Novel Bartonella Subspecies. J. Clin. Microbiol. 1995 33(1):154–160.
[32] Wayne, C.W. The Use of Fatty Acids for Identification of Microorganisms. In A. Fox; L. Morgan; L. Larsson and G. Odham (eds.), Anal. Microbiol. Methods Chromatogr. Mass Spectrom. New York: Plenum Press pp. 59–69 1990.
[33] Raines, L.J.; Moss, C.W.; Farshtchi, D. and Pittman, B. Fatty Acids of Listeria mono-cytogenes. J. Bacteriol. 1968 96(6):2175–2177.
[34] Inglesby, T.V.; O’Toole, T.; Henderson, D.A.; Bartlett, J.G.; Ascher, M.S.; Eitzen, E.; Friedlander, A.M.; Gerberding, J.; Hauer, J.; Hughes, J.; McDade, J.; Osterholm, M.T.; Parker, G.; Perl, T.M.; Russell, P.K. and Tonat, K. Anthrax as a Biological Weapon. JAMA 2002 287(17):2236–2252 URL http://dx.doi.org/10.1001/jama.287.17.2236. [35] Madonna, A.J.; Cuyk, S.V. and Voorhees, K.J. Detection of Escherichia coli Using
Immunomagnetic Separation and Bacteriophage Amplification Coupled with Matrix-Assisted Laser Desorption/Ionization Time-of-Flight Mass Spectrometry. Rapid Com-mun. Mass Spectrom. 2003 17(3):257–263 URL http://dx.doi.org/10.1002/rcm.900. [36] Rees, J.C. and Voorhees, K.J. Simultaneous Detection of Two Bacterial Pathogens
Us-ing Bacteriophage Amplification Coupled with Matrix-Assisted Laser Desorption/Ion-ization Time-of-Flight Mass Spectrometry. Rapid Commun. Mass Spectrom. 2005 19(19):2757–2761 URL http://dx.doi.org/10.1002/rcm.2107.
[37] Reiman, R.W.; Atchley, D.H. and Voorhees, K.J. Indirect Detection of Bacillus an-thracis Using Real-Time PCR to Detect Amplified Gamma Phage DNA. J. Microbiol. Methods 2007 68(3):651–3 URL http://dx.doi.org/10.1016/j.mimet.2006.11.004. [38] Madonna, A.J.; Voorhees, K.J. and Rees, J.C. Method for Detection of Low
Concentra-tions of a Target Bacterium that Uses Phages to Infect Target Bacterial Cells. United States Pat. #7166425 2007.
[39] Leuvering, J.H.W.; Thal, P.J.H.M.; van der Waart, M. and Schuurs, A.H.W.M. Sol Particle Immunoassay (SPIA). J. Immunoassay 1980 1(1):77–91 URL http://dx.doi. org/10.1080/01971528008055777.
[40] Preble, E. and Casey, J.J. Taking Care of Business - The Heroin User’s Life on the Streets. Int. J. Addict. 1969 4:1–24.
[41] Coomber, R. Perceptions of Illicit Drugs and Drug Users: Myth-Understandings and Policy Consequences. Ph.D. thesis University of Greenwich 1999.
[42] Kinzie, E. Levamisole Found in Patients Using Cocaine. Ann. Emerg. Med. 2009 53(4):546–7 URL http://dx.doi.org/10.1016/j.annemergmed.2008.10.017.
[43] Chang, A.; Osterloh, J. and Thomas, J. Levamisole: A Dangerous New Cocaine Adul-terant. Clin. Pharmacol. Ther. 2010 88(3):408–411 URL http://dx.doi.org/10.1038/ clpt.2010.156.
[44] Larocque, A. and Hoffman, R.S. Levamisole in Cocaine: Unexpected News from an Old Acquaintance. Clin. Toxicol. 2012 50(4):231–241 URL http://dx.doi.org/10.3109/ 15563650.2012.665455.
[45] Menni, S.; Pistritto, G.; Gianotti, R.; Ghio, L. and Edefonti, A. Ear Lobe Bilat-eral Necrosis by Levamisole-Induced Occlusive Vasculitis in a Pediatric Patient. Pedi-atr. Dermatol. 1997 14(6):477–479 URL http://dx.doi.org/10.1111/j.1525-1470.1997. tb00695.x.
CHAPTER 2
ANALYTICAL APPLICATIONS OF ELECTRON MONOCHROMATOR-MASS SPECTROMETRY
This chapter presents a review published in Mass Spectrometry Reviews referenced as: †Kirk R. Jensen and Kent J. Voorhees. Analytical Applications of Electron-Monochromator-Mass Spectrometry. Mass Spec. Rev. 2013. DOI 10.1002/mas.21395. Modified with permission. †Indicates primary author.
2.1 Introduction
Negative-ion mass spectrometry (NIMS) affords selectivity over positive-ion mass spec-trometry for the analysis of electrophilic compounds at low concentrations in complex mix-tures.1 Traditionally, negative-ion chemical ionization (NICI) has been used to generate negative ions; however, NICI requires a reagent gas and/or a buffer gas, such as a chemical ionization (CI) gas, which must be maintained at a constant temperature and pressure. Ions produced in NICI have multiple chemistries because an electron-energy distribution of 0-12 eV is produced by the CI process.2 A device was needed that could produce a monochromatic electron beam with high intensity and low energy spread. The electron monochromator was developed to address these issues.
The development of the EM is not a recent effort;3–9 however, practical application to analytical mass spectrometry (MS) became possible after improvements were reported by Deinzer and co-workers at Oregon State University (OSU).10 Under license from OSU, a commercial EM was developed and introduced by JEOL USA, Inc. (Peabody, MA). The commercial electron monochromator (EM) produces an electron beam with a deviation of ±0.3 eV, and eliminates the need for constant pressure and temperature conditions within the ion source.
The following review presents a background on the theory and development of the EM and its application to analytical mass spectrometry. Examples of its use for detection of chlorinated compounds, explosives, pesticides, phthalates, dioxins, polycyclic aromatic hy-drocarbons (PAH), nitro-polycyclic aromatic hyhy-drocarbons (NPAH), antioxidants, and bac-terial biomarkers are discussed. Theoretical studies to correlate and predict electron capture energies based on molecular orbital caluculations are also included.
2.2 Background
Background information on ion formation (2.2.1) in the negative polarity mode is dis-cussed in detail. Negative-ion formation and the restricitions of using chemical ionization (2.2.2) are also presented.
2.2.1 Ion Formation
Traditional mass spectrometry uses a 70 eV electron beam to ionize an analyte [electron ionization (EI)] for positive-ion detection. EI results in an ion in a high-energy state that often fragments into smaller ions. Because of this instability, the molecular ion might not ap-pear in the mass spectrum, a factor that can confound compound identification. Decreasing the electron beam energy to 12 eV often results in the increased intensity of the molecular ion, but at a severe cost of ionization current and sensitivity.11Analysis of negative ions with an EI source is even more problematic because formation of negative ions is approximately 1,000 times less efficient than positive-ion formation.12 For a low-energy electron beam to be utilized for analytical mass spectrometry, the energy distribution had to be reduced while maintaining a high ionization current.
Formation of negative ions in a mass spectrometer occurs by three types of electron interactions:13
• Resonant electron capture: (Thermal electrons) AB + e− → AB−•
• Dissociative electron capture: (<10 eV) AB + e− → A•+ B−
• Ion-pair formation: (10-15 eV) AB + e− → A−+ B++ e−
Resonance electron capture, or pure electron capture, describes a scenario in which com-pound AB captures a thermal electron (≤0.1 eV) to produce a negative molecular radical ion. When compound AB captures an electron at higher energies, it fragments to produce a negative ion and a radical species; this process is referred to as dissociative electron capture. Ion-pair formation is similar to dissociative electron capture, except that an electron is re-leased to leave an ion pair instead of a radical. Regardless of which process takes place, any energy at which a molecule captures an electron to produce an ion is defined as resonance energy (RE). The bulk of the studies conducted with EMs concentrate on either resonance electron capture or dissociative electron capture.
Chang further described negative-ion formation in a doctoral dissertation submitted to OSU.14 The ability of AB to capture an electron and remain a metastable molecular radical anion long enough to be detected is heavily dependent on the electron affinity (EA) of AB. Molecules with EA less than zero are unlikely to remain stable due to auto-detachment of the electron. Molecules with EA greater than zero will result in metastable molecular radical anion if the excess energy imparted on the molecule can be dissipated. With resonant electron capture, very little energy is transferred by the capturing electron due to its low kinetic energy, resulting in an increased appearance of the molecular radical anion. Molecules with conjugated bonds can stabilize excess energy in the π system; this is particularly effective in single- and multi-ringed systems with electronegative substituents. Because of their electron affinity, electrophilic compounds can benefit from NIMS.
2.2.2 Chemical Ionization
Chemical ionization mass spectrometry (CIMS) generates low-energy electrons during ionization of the reagent gas.15,16 The CI process produces two electrons at approximately 30 eV.17 These electrons undergo collisions with unionized reagent gas to reduce the elec-tron energy spread to 0-12 eV.2 Analytes that capture these low-energy electrons become ionized. The reagent gas also provides additional stabilization of the analyte by absorbing excess energy through non-dissociative collisions after electron capture.18Typically, CIMS is operated at pressures that range from 0.4 to 0.8 Torr.19 These pressures result in only 48% of electrons with energies of 0±0.03 eV.20,21
The major challenge with electrons produced from CIMS is that optimum source con-ditions must be maintained throughout the analysis. Changes in temperature and pressure affect the intensity and energy of the electron beam.22–25 Another problem often associated with CIMS is the production of adducts.26 As an example, when interpreting the spectrum in Figure 2.1, the molecular ion should manifest as the peak with the largest mass-to-charge ratio (m/z ). The spectrum suggests atrazine has a molecular weight of 250 Da. The actual molecular weight is 215 Da with an [M-H]− molecular ion peak at m/z 214. The compound that corresponds to m/z 250 is atrazine with an added chlorine substituent (suggested by the mass difference of 35 mass units). Stabilized adducts exist long enough to be detected by the mass analyzer, and can cause confusion if the compounds of interest are unknown. As previously discussed, NICI has a number of limitations that could be eliminated if an intense beam of monochromatic, low-energy electrons suitable for negative-ion formation could be produced without the added complications of using reagent gases.
2.3 The Electron Monochromator
In the following sections, early developement (2.3.1), commercialization (2.3.3), and op-eration (2.3.4) of the EM are discussed in detail. A brief description of other low-energy sources not covered in detail in this manuscript are also presented (2.3.2).
Figure 2.1: Mass spectrum of atrazine with a chlorine adduct.26
2.3.1 Early Development of the Electron Monochromator
The first instrument that produced a monochromatic electron beam was reported in 1939, and was used to determine the ionization potential of mercury.3 In 1955, Fox et al. reported an EM attached to a mass spectrometer to measure ionization potentials. That design has served as the precursor to modern EMs.4 The next major advancement in EMs was described by Stamatovic and Schulz, where low-energy, monochromatic electrons were produced with an ionization current of 1 nA while maintaining an electron energy resolution of ±0.020 eV.5 Unfortunately, 1 nA was insufficient to provide spectra with an adequate signal-to-noise (S/N) ratio for analytical mass spectrometry. As a comparison, modern EI sources produce ion currents between 50 and 1,000 µA. Low ionization current severely limited the potential of early EMs for analytical mass spectrometry, and confined research to the determination of appearance energies of compounds. A notable improvement to the ionization current was achieved by Illenberger and co-workers6 while exploring negative ion formation of CF2Cl2, CF3Cl, and CFCl3 with a trochoidal EM design adapted from Stamatovic et al.5 The
Il-lenberger device was interfaced to a quadrupole mass analyzer, and produced a maximum ionization current of 100 nA. In this report, the electron beam was operated from 0 to 10 eV with a resolution of ±0.12 eV at <4 eV and an estimated resolution of ±0.2 eV at ≥4 eV. During the 1990s, Deinzer et al. made significant improvements to Illenberger and co-workers design and increased the ionization current to a maximum of 2 µA while maintaining an electron resolution of ±0.1 to ±0.4 eV.6,8 Over 3 years, Laram´ee et al. described the de-sign, tuning, and application of electron monochromator-mass spectrometry (EM-MS) that would later serve as the basis for the JEOL USA, Inc. commercial development.26–28
2.3.2 Other Low-Energy Electron Sources
Other methods of producing low energy electrons have been reported. Chutjian and co-workers described the reversal ion source based on the Illenberger design.6,29 Additionally, a review article on low-energy electron capture also features a discussion of the reversal ion source30 and relevant analytical applications have been reported.31–33 Two other EM de-signs, the hemispherical and hypocycloidal EMs, have been described, but have not been used for analytical mass spectrometry. Research with these devices primarily focused on the determination of appearance energies of specific compounds and classes of compounds.34–38 Photoionization techniques have also been used in electron attachment studies.39–41 Because this review is focused on analytical applications of the trochoidal design, no further elabo-ration on the techniques in this section will be presented.
2.3.3 Commercialization
JEOL USA, Inc., under license from OSU, designed and introduced a commercial EM trademarked as the Tunable-Energy Electron Monochromator (TEEMTM). A review by Deinzer and co-workers presents an excellent discussion of the early designs.10 The major improvements to Deinzer and co-workers design (Figure 2.2) included the optimization of the dimensions, a user-friendly controller, and incorporation of a Pierce element to replace two of the focusing anodes (Figure 2.3). The Pierce element shown in the TEEMTM surrounds
the filament with an electric potential designed to focus electrons toward the anode entrance slit. All selectable potentials of the monochromator are referenced to the potential across the filament, and the electron energy is determined by comparison of the filament potential with the source block potential. The TEEMTM maintained instrument stability such that tuning parameters were unaffected by filament degradation or potential increase across the filament. This stability resulted in a marked improvement in EM tuning that could be maintained for several days. Improvement to electron beam intensity was in the µA range, and is comparable to the ionization current of an EI source.
Figure 2.2: Schematic of the EM-MS designed at OSU.26
2.3.4 Operation
Electron path and energy selection with the TEEMTMshown in Figure 2.3 is accomplished by varying the electric field strength through selectable potentials (0-53 V) in the presence of a constant magnetic field. Two permanent magnets are located at each end of the device to
Figure 2.3: Schematic of the TEEMTM.42
provide a magnetic field strength of 130 G parallel to the electron-beam path. As electrons are emitted from the filament, the Pierce element focuses them towards anodes 1 and 2. Once the collimated electrons enter the deflection region, they are subject to an adjustable electric field perpendicular to a fixed magnetic field. The combination of electric and magnetic fields produces a toroidal motion perpendicular to both fields as predicted by Maxwells equations.43 The exit slit is off-center from the entrance slit, and the degree of deflection imparted on the electrons determines beam energy. Only electrons within selected energies are deflected through the exit slit.
The TEEMTM produces near-monochromatic electron energies in the range of 0-30 eV at a resolution of ±0.3 eV, with a maximum ionization current of 100 µA. The sensitivity of a JEOL MStation fitted with the TEEMTM was measured at 25 fg of hexachlorobenzene (HCB) with an S/N ratio of 31:1.42 The linearity of octafluoronaphthalene (OFN) measured on the same instrument had a correlation coefficient of 0.997 over five serial dilutions from 1 µg to 100 fg. In addition to monochromatic settings, the EM can scan a range of electron energies to determine REs (discussed later). When interfaced, a mass spectrometer can be set to either the positive- or negative-ion mode to provide traditional mass spectral analysis with the ability to control ionization with electron energy. The EM has been shown to produce highly selective negative ions in a mass spectrometer; however, by increasing the electron
energy above the ionization potential of a selected analyte, low-energy positive-ion data can be obtained. The tuning process with the JEOL power supply has been streamlined with software to automatically set and store parameters.
The TEEMTMis not without its drawbacks, the first of which is that most mass spectrom-eters must be retrofitted to use the TEEMTM. Next, the significant increase in ionization current came at the cost of electron energy resolution. As the ionization current increases, the repulsion forces between electrons start to overwhelm the strength of the magnets to colli-mate the beam; this is known as a space charge effect.4 While the electron energy resolution of the TEEMTM has higher electron energy spread than previously reported instruments, the increase in ionization current has made analytical applications possible; therefore, the electron-energy resolution for the TEEMTM is not as narrow as reported by Stamatovic and Schulz (±0.020 eV).5 As technology provides better magnets, higher ionization currents and improved electron energy resolution can be realized. Additionally, only five TEEMTM units have been produced and sold by JEOL USA, Inc. as of the writing of this review; that limit has severely hindered general acceptance of the technique. Without widespread use, improvements to the trochoidal monochromator design have been slowed. Despite these drawbacks, a mass spectrometer equipped with a TEEMTM shows promise as a powerful analytical instrument, and has been used in multiple applications primarily for the analysis of electrophilic compounds.
2.4 Research at Oregon State University Prior to Commercialization
Before commercialization of the TEEM,TM research done at OSU showed that the EM could be used for analytical applications. Studies about integration with mass spectrome-try, addition of gas chromatography, organophosphate pesticides, phthalates, buffer gases, polychloro-p-dioxins, and integration with time-of-flight analyzers are discussed.
2.4.1 Integration with Mass Spectrometry
Deinzer and co-workers integrated an EM constructed in-house to a Hewlett-Packard 5982A quadrupole MS.26 Figure 2.2 is a schematic of the OSU EM-MS system. Because the EM used was a pre-commercialization design, additional focusing anodes were used instead of the Pierce element later added by JEOL USA, Inc. Ionization current was reported to be 2 µA with an energy distribution of ±0.1 to 0.4 eV. The limit of detection (LOD) of HCB was determined to be 5 pg. Heptachlor analyzed on the OSU EM-MS system at 0.3 eV was compared to NICI (methane, 0.6 Torr) results collected on a Finnigan 4023 quadrupole MS. The same ions were observed in EM-MS and NICI, but a ten-fold increase in signal was observed for higher molecular weight fragments with EM-MS.
The REs were recorded for the major fragments of nitrobenzene by scanning the electron energy from -3 to +12 eV.26 Electron energies cannot take on negative values, but the instrument parameters were set to -3 eV to ensure that 0 eV was scanned properly. There are other reports discussed later that use this same approach. Figure 2.4a shows the RE scan of the molecular ion of nitrobenzene (m/z 123), Figure 2.4b is a similar plot for the NO−2 fragment (m/z 46), and Figure 2.4c is a plot of the phenyl ion (m/z 77). Each fragment has a unique RE pattern and ion intensity maxima. REs for the molecular ions of some common PAHs were also reported.26 Anthracene, pyrene, and fluoranthrene all produced molecular ions at distinct REs near 0 eV. In comparison, the same compounds analyzed with NICI did not show molecular ions for anthracene and pyrene, which further demonstrates the low abundance of low-energy electrons produced in the NICI process.
2.4.2 Addition of Gas Chromatography
In 1994, the OSU group added a Hewlett-Packard 5710A gas chromatograph to the front end of their HP 5982S quadrupole EM-MS to provide separation capabilities.27 Traditional gas chromatograph mass spectrometry (GC/MS) offers three dimensions of analysis: reten-tion times from a chromatogram, m/z, and ion intensity. The addireten-tion of the EM provides
Figure 2.4: Resonance energy scans of the (a) molecular ion, (b) nitro fragment, and (c) phenyl fragment of nitrobenzene.26
RE scanning as a fourth dimension of analysis. Five picograms of HCB was detected at a RE of 0.03 eV and an S/N better than 20:1 for m/z 284 (molecular ion).
The ability to selectively analyze compounds at unique REs is of major importance for several studies presented below. Deinzer and co-workers analyzed a mixture of HCB and 2,4,6-trinitrotoluene (TNT) with their GC/EM-MS system to demonstrate the use of RE scanning as a chromatogram deconvolution technique.27In Figure 2.5a, HCB and TNT both underwent pure electron capture at 0.03 eV to give rise to intense peaks representative of their molecular ions. At 2.4 eV, a peak for TNT was observed, whereas the HCB peak is almost diminished to baseline as illustrated in Figure 2.5b.
Deinzer and co-workers further demonstrated that REs could be used in combination with GC-separation capabilities for polychlorinated compounds to produce a chromatogram that showed only chlorinated compounds.27 The EM was set to 0.03 eV to produce chloride fragment ions that were monitored with selected-ion monitoring (SIM) of m/z 35. Figure 2.6a is a chromatogram of Aroclor 1254, a mixture of several polychlorinated compounds. Each peak represents a compound with one or more chlorine substituents. Figure 2.6b is an expanded region of Figure 2.6a that shows the specific detection and GC resolution of a complex mixture. An important aspect of this data is the absence of chlorine adducts discussed previously for NICI. As an example of EM-MS specificity, Arctic trout muscle was analyzed and compared to NICI results reported by the Environmental Protection Agency. Figure 2.6c is the 0.03 eV EM-MS gas chromatograph of the muscle sample in which every peak denotes a chlorinated compound. All compounds identified in the NICI study were detected by Deinzer and co-workers.
2.4.3 Analysis of Organophosphate Pesticides
In additional GC/EM-MS analyses, REs of organophosphate pesticides, two of which are shown in Figure 2.7a (parathion) and Figure 2.7b (paraoxon), were studied.28 Each marker on the graph represents a RE at which the molecule underwent dissociative electron capture and the m/z of the resulting fragment. For example, paraoxon (Figure 2.7b) shows several
Figure 2.6: Chloride chromatograms (m/z 35) for (a) Arochlor 1254, (b) expanded region of panel (a), and (c) arctic trout muscle.27
fragments that have resonance maxima at approximately 4.6 eV. The m/z 79 fragment at 4.6 eV corresponds to the phosphite ion whereas m/z 138 is [C6H4NO3]•−. For a mixture of paraoxon and parathion, the electron energy can be changed to 7.1 eV, an energy where both compounds captured electrons, but produce different fragments. A mass spectrum of a mixture would reveal intense peaks at m/z 275 for the molecular ion of paraoxon, and m/z 154 for the [C6H4NO2S]− fragment of parathion. Identities of these compounds could be further corroborated by using different REs and SIM. It follows that each RE map provides a fingerprint to identify the associated compound analogous to EI mass spectra, but also provides additional identification information from REs for each fragment. The above Deinzer articles have been previously reviewed.10
Figure 2.7: Resonance energy maps for (a) parathion and (b) paraoxon.27
2.4.4 Analysis of Phthalates
In 1999, Mazurkiewicz et al. reported EM-MS analysis of seven different ortho-phthalates and meta-dimethyl phthalate commonly used as plasticizers (listed in Table 2.1).44 The previously described OSU EM-MS was used for analysis.26 Data were collected in SIM mode and electron energy was scanned from -2 to +10 eV.
Table 2.1: Resonance energies for fragments produced by substituted phthalates; N/A = not applicable, X = not observed.44 o-Phthalate 1 st RE 2nd RE 1st RE 2nd RE 1st RE phthalic 2nd RE phthalic (M-R1)− (M-R1)− (M-R1-R2+H)− (M-R1-R2+H)− anhydride anhydride R1 = methyl 1.50 1.90 1.24 X 0.95 1.4 R2 = methyl R1 = ethyl 1.43 2.17 X X 0.48 X R2 = ethyl R1 = n-butyl 1.11 1.48 X X 0.70 X R2 = n-butyl R1 = isobutyl 1.07 X 0.54 1.20 0.70 X R2 = isobutyl R1 = n-amyl 0.62 1.04 0.66 1.13 0.54 1.04 R2 = n-amyl R1 = butyl 0.70 1.12 0.81 1.15 0.61 1.11 R2 = cyclohexyl R1 = cyclohexyl
0.64 1.11 N/A N/A N/A N/A
R2 = butyl R1 = n-butyl
1.18 1.37 0.85 1.22 1.04 X
R2 = benzyl R1 = benzyl
1.08 1.43 N/A N/A N/A N/A
R2 = n-butyl m-dimethyl
X X X X X X
Molecular ions were observed at two distinct REs for all 18 o-phthalates: ≈0.6 and ≈1.1 eV and 0.19 and 0.87 eV for the one m-dimethyl phthalate. No fragments were observed for m-dimethyl phthalate. As energy was increased, [M-R•1]− ions for the ortho compounds were observed at approximately 1.03 eV, a common fragment that results from dissociative electron capture. A direct relationship between the size of the R groups and the RE was observed. The [M-R1-R2+H]− fragment, where both R groups were lost and a hydrogen was added, exhibited peak maxima at a mean of 0.82 eV. The methyl, ethyl, and n-butyl did not produce this fragment, with the exception of o-dimethyl phthalate. The energies required to produce this fragment were less than the energies required to produce the [M-R•1]− fragment; those energies suggested that the [M-R•1]− fragment underwent rearrangement to produce the phthalic acid fragment. The mechanism postulated by Mazurkiewicz et al. involved β-elimination and hydrogen transfer to produce a neutral alkene and the phthalic anhydride ion after the initial cleavage of the R1 group (Scheme 2.1). The other major fragment observed for some of the phthalates was the phthalate anhydride anion.
Scheme 2.1: Proposed mechanism that produces a neutral alkene and the phthalic anhydride ion.
2.4.5 Buffer Gases in EM-MS
Berkout et al. investigated the use of buffer gases for additional ion stabilization in EM-MS to increase sensitivity.45 Electron energy was scanned from 0 to 10 eV in 0.1 to 0.2 sec on a quadrupole GC/EM-MS, and helium was used as a buffer gas at pressures from 0.5 to 12 mTorr. The intensity (arbitrary) of molecular radical anions was approximately 20 times greater after the helium pressure was increased to 12 mTorr; HCB signal increased