Small Firms and Employment
Growth
A Cross-Regional Study of Sweden
Bachelor thesis within Economics
Author: Peter Jörgensen
Tutor: Lars Pettersson & Sofia Wixe
Bachelor’s Thesis in Economics
Title: Small Firms and Employment Growth
Author: Peter Jörgensen
Tutor: Lars Petterson & Sofia Wixe
Date: 2011-06-12
Subject terms: Job Creation, Regional Development, Small Firms, Employment Growth
Abstract
In the last decades, small firms have accounted for a disproportionately large share of new jobs. Using data from 1993 to 2009, the concern of this thesis is to examine re-gional differences in employment growth in Sweden, with a focus at the role of small firms. The author employs findings from previous studies and theoretical discussions on advantages and disadvantages of small firms to derive a number of variables to use in two multiple regression models on regional employment growth, one for the period 1993-2001 and one for the period 2001-2009.
The results show that, unlike increases of well educated workers and the population growth, increases in small firm employment is significant in explaining employment growth in both periods, with a positive relationship. For both periods, changes in small firms’ share of employment is not significant in explaining employment growth. Although many new jobs have been generated in service industries, changes in the service sectors’ share of employment is highly insignificant as an explanatory variable for employment growth. Moreover, an increased share of highly educated workers is negatively related to employment growth.
Table of Contents
1
Introduction ... 3
1.1 Background ... 3
1.2 Purpose of Study ... 4
1.3 Delimitations ... 4
1.4 Definition of Small Size Firms ... 4
1.5 Outline of Study ... 4
2
Previous Studies ... 5
2.1 Productivity Growth and Employment Growth ... 5
2.2 Most Small Firms Do Not Grow ... 5
2.3 Small and Large Firms ... 6
2.4 Employment Growth in Small Firms ... 9
2.5 Small and Young Firms ... 11
3
Empirics ... 13
3.1 Descriptive Statistics ... 13 3.2 Model Specification ... 15 3.3 Variables Specification ... 16 3.4 Data ... 17 3.5 Results ... 18 3.6 Analysis of Results ... 204
Conclusion ... 23
List of references ... 24
Figures
Figure 3-1: Small and Large Firm Share of New Jobs (not including mergers and aquistitions) 1993-2009. Source: Statistics Sweden ... 13 Figure 3-2: Small and Large Firm Share of Total Employment 1993-2009 ... 14 Figure 3-3: Growth 1993-2009 in Swedens’ 72 FA-Regions, Ordered by
Population Size ... 14 Figure 3-4: Employment growth and change in small firms’ share of
employment 1993-2001 ... 21 Figure 3-5: Employment growth and change in small firms’ share of
employment 1993-2001 ... 21
Tables
Table 2-1: Summary of Advantages of Small and Large Firms mentioned in the Theory Section ... 12 Table 3-1: Regression Results Model 1 ... 18 Table 3-2: Regression Results Model 2 ... 19
Appendix
Appendix 1 – The 72 FA-regions of Sweden... 26 Appendix 2 – Regression Output ... 28
1
Introduction
1.1
Background
From the 1970´s onwards, an increasing amount of studies have dealt with firm size distri-bution and its effect on job creation (e.g. Johansson 2002; Noteboom, 1994; Henrekson & Johansson, 2008). Whereas there was once, based on theories of scale and scope econo-mies, strong belief in long-run superiority of large firms, academic focus has tilted towards small firms. This is because small firms have, in many European and American studies (e.g. Carree & Klomp, 1996; Carree & Thurik, 1999; Schmiemann, 2009; Pagano & Schivardi, 2003), often been found creating a disproportionately large share of new jobs. Additionally, it is in the small firms segment that many of the fastest growing firms, in terms of employ-ment, can be found.
A number of explanations for the increased importance of small firms have been put forth. As income levels have increased, the variety of demand has increased as well, which calls for a higher degree of product specialization. The labor-intensive service sector has grown in importance, leading to more small firms. Modern IT technology has decreased transac-tion costs of informatransac-tion and communicatransac-tion (Caree et al, 2001; Julien, 1992). In this changed environment, it has been argued that small firms have grown in importance, due to a number of advantages. Examples of these are limited bureaucracy, efficient diffusion of new technology, and a high level of entrepreneurial motivation and flexibility (Carree & Thurik, 1999; Johansson, 2002). In an ever-evolving economy, small firms are considered serving as agents of change, exploiting interstice markets and implementing new technolo-gy in a high rate of demand responsiveness. Many small firms represent many attempts in allocating business concepts between entrepreneurs, which can yield more successful out-comes.
However, this does not imply that large firms have become unimportant, or that most small firms are growing. On the contrary, only a fraction of small firms grow and conform to all the virtues described above (Davidsson & Delmar, 2002). Wages are generally lower than in large firms, and the risks of owners often higher (Carre & Thurik, 1999). Moreover, large firms still account for a lion-share of R&D expenditure and dominate capital-intensive industries (Schmiemann, 2009). Also, an increase in the number of small firms may be due to a lack of options of how to earn a living, for example a high unemployment rate. It has also been argued, that the virtues of small firms are the strongest early and late in the life cycle of a product, and that these periods often are characterized by low profita-bility (Noteboom, 1994). Thus, large and small firms can be viewed as complementary, ra-ther than two opposite worlds of their own.
Building upon this, this study investigates the impact of a number of variables, among them the percentage change in small firm employment and the change in small firms’ share of employment, on employment growth/loss in Swedish regions between 1993 and 2009.
1.2
Purpose of Study
The intention of this study is to examine the role of small firms on regional employment growth in Sweden for the years 1993-2009. It is not exclusively concerned with small firm employment as an explanatory factor of employment growth, but shall also include other factors related to the performance of small firms and employment growth in general. Through this study, I wish to contribute to the understanding of regional disparities in em-ployment growth.
1.3
Delimitations
This study does not deal with job quality, for example wages, benefits and work environ-ment, but only employment growth. This is important to note since a region that has created many new jobs not by necessity has had a better development in wages than a re-gion that has had slow employment growth. Part of the new employment may also be part-time, with few benefits and low employment safety. Nonetheless, it can be used as an indi-cator of regional economic development.
Moreover, this study takes a highly aggregated approach on employment growth, not dwel-ling into industry- and firm-level specifics. Thus, the results should to be interpreted in a general sense.
1.4
Definition of Small Size Firms
The definition of small size firms used in this thesis is in regard of number of employees and not annual turnover. Small firms are defined as firms with less than 50 employees. Some of the cited work use different definitions, and in these cases this is clearly stated.
1.5
Outline of Study
Section two of this paper provides an overview on previous studies in regard of small firms on economic growth. In the second section I account for several theories and studies dis-cussing the role of small firms and their impact on job creation. The third section is empir-ical; There, a cross sectional regression on swedish regions is used to examine what factors that are significant in explaining the changes in employment level between the years 1993 and 2009. It is followed by an analysis of the results. Finally, the fourth section is a conclu-sion of the study and its main findings.
2
Previous Studies
This section accounts for a number of previous studies and theories concerned with small firms and their strengths and weaknesses. It does so in a wide sense, discussing also the importance of firm age and the role of the minority of small firms that grow rapidly, the so called “gazelles”, in job creation.
The first two parts of this section makes a distinction between productivity growth and employment growth, and clarifies the growth prospects and ambitions of small firms in general. This is intended to provide the reader with an important fundament for interpreteting the other sections of this thesis.
2.1
Productivity Growth and Employment Growth
Growth in productivity and growth in employment does not by necessity follow each oth-er. Several countries have experienced so called “Jobless Growth”, with a growing econo-my in terms of GDP but with persistently high unemployment. The United States expe-rienced jobless economic growth in the early 1990´s and 2000’s (Schreft & Singh, 2003). An explanation of this that has been put forth is “Just in time employment practices” where employers offer only temporary employment and encourage workers to work over-time rather than employ more people. (Schreft & Singh, 2003)
Arpaia (2005) identifies a few more explanations on jobless growth: One is that in econom-ical downturns, firms show a higher level of determination to rationalize and avoid over-spending and over-hiring. Thus, they may regain the same output level but with fewer em-ployees. Moreover, structural change may impose a lagged unemployment effects as work-ers have to be adequately educated and allocated within the industries in which new jobs are being created. Generally, Arpaia (2005) states, firms respond to increases in demand by increasing productivity, and waits until the macroeconomic situation and the higher level of demand appears stable, before they increase the number of employees. The major EU economies (Germany, Spain, France, Italy and United Kingdom) have all been characte-rized by jobless growth recently. For the EU-15 in the years 1991-1995, employment de-creased by an average of 0.3 % per year whereas productivity grew by 1.7 %. For the years 1995-2004, the inverse development could be found, with a yearly increase of employment by 1.2 % and an increase in productivity of only 0.9 %. Thus, employment growth and productivity growth are anything but directly related. (Arpaia, 2005)
2.2
Most Small Firms Do Not Grow
Though this thesis rather extensively deals with the characteristics of small firms and their impact on employment growth, it should be clearly stated that most small firms do not grow. Only a small share of small firms in Sweden try to grow and only an even smaller share succeed. (Davidsson & Delmar, 2002). Frederiks et al (2002) found, in a study on small firms in the Netherlands, that 16 % of the small business owners at all aim to grow. According to Noteboom (1994), 10 to 20 percent of small firms are innovative, growth-oriented and efficient. (Noteboom, 1994)
Many small firms are imitative and exist within mature local markets. Hence, they have very low growth prospects and do not strive for growth. A study conducted in the 1980’s (Da-vidsson et al) showed that 40 % of business owners did not even think that their income stream would rise if the firm grew to have more employees. Rapidly growing firms are of-ten found in dynamic environments with heterogeneous markets. Davidsson et al (2002) concludes that growth and employment decisions of small firms are determined by both managerial motivation as well as by external, environmental factors. (Davidsson et al, 2002) Gray (2002) studied motivational patterns as well as strategic outlook for small firms in the UK during the 1990’s. 46-52 % of the business owners, depending on which year studied, chose “independence/be own boss” as the most important personal motivation for rning their business. 16-19 % chose “making money” and 6-11 % “no alternative/avoid un-employment”. As for strategic objectives of their firm, supporting a lifestyle was the most popular answer with 30-35 % of the answers, depending on which year studied. Increase of sales only yielded between 5 and 7 % of the answers. As most firms don’t even put increas-es in salincreas-es high on their agenda, there is little reason to expect them to grow in employ-ment. (Gray, 2002)
2.3
Small and Large Firms
The economist Robert Gibrat argued, that the growth rate of firms is independent of firm size. From its publishing in 1931, Gibrat’s law was long nearly unchallenged as empirical studies found it hard to refute. However, as better data became accessible, and econometric studies more sophisticated, the theory has been proven deficient. Smaller firms appear to grow faster relative to their size, and the spread of growth rates are greater among smaller firms (Mata, 2008). Therefore, I do not concentrate at describing his theories in greater de-tail, but it deserves a mentioning since it long was widely accepted.
For a long time, large firms were the center of attention in regard of economic growth and job creation, but during the 1970´s an increasing amount of academic findings changed this perception and shifted the focus to small and young firms as they were proved to create more new jobs than large firms. This was contrasting the view that, due to returns to scale advantages, larger firms would drive smaller firms out of the market in many sectors (Jo-hansson 2002; Carree & Thurik, 1999)
More recent studies in the US and Western Europe have come to the same conclusion – Small firms account for a large share of new jobs, and large firms for a disproportionately large share of lost jobs (Johansson 2002). In manufacturing, large firms (by the American definition firms with more than 500 employees) accounted for 53 % of the jobs created be-tween 1972 and 1988, but 56 % of the jobs destroyed, which indicates a net loss in the large firm sector (Carree & Klomp, 1996). In the United States, the employment share of the Fortune 500 firms decreased from 20 % to 10 % between 1970 and 1999. As for Eu-rope, most manufacturing industries have seen an increasing share of small firms (Carree & Thurik, 1999)
From the 2nd industrial revolution in the 2nd half of the 19th century until the early 1970´s, the average firm size rose in the western world. Through economies of scale and scope in production, R&D, distribution etc., hierarchical industrial firms grew progressively. Since then, Carree et. al (2001) describes, the developed economies of the world has seen a back to basics development, where firms tend to focus more on their core strengths, which leads to downsizing and restructuring. The entrepreneur has grown in importance relative to the manager, and is now increasingly viewed as the heart of economic progress. Referring to earlier theories and empirics on the relationship between business ownership and unem-ployment, they show that rising wages in a strong economy may raise the opportunity cost for business ventures and hence lead to a decline in business ownership and average firm size. By the same token, high unemployment may induce individuals to pursue entrepre-neurial ventures; This is generally named The Refugee Theory. However, over time, the self-employment rate in the OECD area has risen since the late 1970’s, indicating smaller aver-age firm size. As western economies have lost comparative advantaver-age in old flagship indus-tries, many new industries have emerged within software and biotechnology. A number of studies have shown that those new industries are better suited for small firms, as they have an innovative advantage. Progression in IT has allowed for a larger share of small firms due to more effective coordination. The services sector, dominated by small firms, has generally increased its share of the western economies. (Carree et. al, 2001)
Carree & Thurik (1999) identified three great virtues of large firms that for long were solid institutions in discussions of industry structure. The first is economies of scale, as described previously: due to considerable fixed costs only large production units (with lower average costs) can be justified. The second is economies of scope, that the same production facilities can produce many different products with the same resources, also leading to lower production costs. The third is experience, which is that unit costs fall with the amount produced due to learning-by-doing and increased efficiency (thus not only due to lower average input costs as in economies of scale and scope). Another aspect that works in disfavor of small firms is the higher transaction costs, such as marketing, information and monitoring of customers. But as described previously, the importance of these virtues have been frequently chal-lenged from the late 1970’s onwards. To offset some of the scale, scope and experience disadvantages, small firms may form networks and build up social capital. Small firms also have advantages in transportation costs, small sized or variety-demanding markets, and their ability in adjusting output with little loss, as they are generally more labor intensive and use different equipment. Moreover, it has been argued that small firms have a higher degree of motivation, efficiency and entrepreneurial energy, though this is hard to quantify. (Carree & Thurik, 1999)
The rise of small firms and their growing share of the economy have called for new expla-nations and small-firm friendly theories. One theory, relating the importance of small firms to innovation and growth as described by Joseph Schumpeter, focuses at the many inters-tice markets that are better suited for small firms. These markets arise from factors such as local customs, demand for luxury, particular specifications and geographical isolation. As incomes have increased tremendously in the industrialized world, this has spurred market segmentation and hence decreased scale advantages. For small and changing markets,
shorter production runs have been made possible through new electronic technology, and studies have shown that small firms are better at diffusing new technology than large firms. Moreover, economies of scale may be partially or completely offset by internal diseconomies of scale, such as coordination and control costs, extensive slack, increased cost of informa-tion, bureaucracy, and adjustment costs. (Julien, 1992).
Julien (1992) emphasizes the importance of risk aversion among managers in an attempt to explain the behavior of small and big firms. To minimize risk and uncertainty and reduce competition, he argues, big firms seek to grow through concentration, e.g. seeking an oli-gopolistic or even monopolistic market power through internal and external investments and through cartels. Some large firms have international non-competition agreements, and some can even get the support of their own state in reducing competition in the homeland. However, Julien argues, this risk aversion is equally common among managers of smaller firms. But their resources are too scarce and the entry barriers to their markets too low for them to be able to reduce risk and uncertainty themselves. Instead they try to stabilize their situation through networking, rather than controlling it like larger firms do. Through so-phisticated cooperation small firms can reap some of the benefits of scale economies, yet stay flexible in an ever-changing market. The flexibility comes from some of the characte-ristics of small firms, such as organic organization and centralized decision-making; coop-eration can take the form of subcontracting and externalization of activities. Research has shown that the flexibility of smaller firms has helped them getting through tough economic times better than larger firms. (Julien 1992)
Johansson (2002) sums up a number of plausible reasons to the job creation success of smaller firms found in several studies. First and foremost, they are considered more inno-vative and flexible than larger and older firms. Whereas larger firms often focus at innovat-ing in their own processes, smaller firms to a larger extent focuses at innovatinnovat-ing in prod-ucts. The second point he mentions is that some production is more efficient in small and young firms due to a high level of specialization. Smaller firms also tend to avoid bureau-cracy and have better systems of incentive that reward innovators to a higher degree than within larger firms. Additionally, modern IT technology has decreased transaction costs which can justify smaller firms and demand has shifted from manufacturing products to service products (characterized by smaller production units). Moreover, a high density of firms may lead to better allocation of business concepts between different entrepreneurs. In a way, a business venture represents an attempt to combine these, and the more of those we have the more often we will have successful outcomes (Johansson 2002).
Regarding the vast differences between different US regions in the share of the labor force that are business proprietors (hence the differences in average firm size), Acs and Arming-ton (2003) argued that this may be influenced by two main factors. The first is the abundance of entrepreneurial experience that comes from the regions pool of entrepreneurs. The second is the demonstration effect: Many studies have shown that the propensity to entrepreneurial activ-ities is the highest in areas where this is already the most common. (Acs & Armington, 2003).
Carree & Thurik (1999) provide a thorough discussion on the theorizing of virtues and dis-advantages of small firms, with a focus at the manufacturing sector. It has been argued that advantages for small firms arise from increasing uncertainty, competition, diversity of de-mand and instability that they, through their flexibility, can tackle better. Consequently, there has been an intensification of the process described by Joseph Schumpeter as creative destruction. Small firms foster innovative activities and stimulate progression of industries. At the other hand, they are characterized by low stability and lower wages. (Carree & Thu-rik, 1999).
Diversity, Noteboom (1994) argues, is the greatest virtue of small firms. Large firms are fi-nanced by equity capital to a larger extent than small firms, and shareholders have certain profit-risk preferences to which the managers must conform to not be replaced. Smaller firms, at the other hand, are financed to a larger extent by bank-loans and the savings of the entrepreneur, sometimes with help from friends or family. This leads to a different situ-ation where demands on profit are idiosyncratic as banks only want repayments on the loan, with no interest in whether or not the entrepreneur fully exploit all economic oppor-tunity. Return and risk assessments of the entrepreneur and his investors may differ widely as well, due to over- or underestimation of his abilities and competitiveness. This give rise to diversity in risk taking that is characteristic for small firms. Moreover, diversity is ampli-fied by a lax regulatory environment in regard of labor conditions, environment concern, demands on schooling, safety standards etc. since it is highly difficult to control the large number of small firms. Noteboom (1994) also brings forth a number of other strengths of small firms, such as a high level of commitment and motivation, no bureaucracy, and unique competencies. Thus, a large focus of small firms should be at niche products, cus-tomization and involvement in external networks to offset some of the disadvantages of being a small firm. Examples of those disadvantages are lack of opposition in decision making, technological shortcomings, little spread of risk, lack of information and lack of fi-nancing. Thus, it seems that small firms are strong where large firms are weak, and vice versa. As out-contracting of vital stages of productions to smaller firms has become a more common feature of large firms, and small firms increasingly have sought to organize in networks (co-opetition), it seems that there is a strive for what Noteboom label “dynamic complementarity”. (Noteboom, 1994).
2.4
Employment Growth in Small Firms
In a sample of 100 randomly chosen manufacturing industries in the USA, for the years 1976-1980, David S. Evans (1987) found strong support for the notion that smaller firms grow faster than large firms in terms of employment. Firm growth decreased with firm size in 89 % of the industries examined. For the sample mean, 1 percent larger size at the be-ginning of the period was associated with an increase of only 0.68 percent in size at the end of the period. Additionally, firms with their production at many smaller plants grew faster than those with production concentrated at fewer plants. However, the survival rate increase, and variability of profits decreases, with firm size. A 1 percent higher age at the beginning of the period lead to a decrease of 0.13 percent in variability of profits, for the sample mean. (Evans, 1987)
Davidsson and Delmar (2002) showed that although the professional service sector ac-count for 15 percent of the entire population of businesses, it represents a third of all fast-growing firms. They conclude that a dynamic business environment benefits high-growth firms. There are also differences in how firms grow; Large firms grow by acquisitions to a large extent whereas small firms grow organically. (Davidsson and Delmar, 2002)
Acs and Armington (2003) studied employment change in 394 LMA (labor market area) ci-ties in the United states for the years 1991-1995. As an indicator of entrepreneurial activity they used, parallelly to firm entry statistics, the share of business owners. This refers to the share of the labor force that are business proprietors. The results show that regions domi-nated by large firms and branch plants are less competitive and tend to have weaker em-ployment development. For the manufacturing sector, however, the results are not clear. The results show a positive and statistically significant coefficient for the share of proprie-tors of the labor force. It should be noted however, that the entry frequency coefficient is stronger and more important to the function than the firm size factor. (Acs & Armington, 2003).
Caree et. al (2001) used data for 23 OECD countries, for the years 1991-1994, to test for different issues regarding the level of self-employment. Firstly, they found that the adjust-ment towards the equilibrium rate of self-employadjust-ment (as a function of the stage of eco-nomic development for each respective country) is very slow. This they did not find sur-prising, as a shift of the business ownership rates involves large cultural and industry-specific changes. They also find that a 1 percent increase in unemployment leads to a 0.06 % increase in self-employment, which supports the notion of unemployment as a push fac-tor for new business formation. The results of their regression also showed that a deviation from the equilibrium self-employment rate (as a function of GDP per capita) had a nega-tive impact on economic growth. They mention Sweden as one of the most accentuated examples of a country far below the equilibrium self-employment rate and mention a large public sector, low entry/exit rates and high taxes as plausible reasons for this. (Carree et. al, 2001).
For Europe at large, labor productivity per worker is the highest in large firms (>250 work-ers), followed by medium sized firms (50-249 workwork-ers), small firms (10-49 employees) and micro firms (1-9 employees). Thus, the productivity level is, at average, higher for larger firms. The sectors with the largest share of large firms are electricity-, gas- and water supply, transport, communications and manufacturing, whereas the sectors most characte-rized by small firms are construction, hotels & restaurants and distributive trade. This clear-ly shows that large firms have advantages in capital intensive industries, whereas small firms have advantages in labor-intensive industries. Of the 27 member states, Sweden has the 6th highest density of micro firms, the 18th highest density of small sized firms, and the 15th highest density of medium sized firms. There are considerable differences between the size classes in what sectors they are dominant within. For real estate, hotels, restaurants, motor trade, retail trade and repair, micro firms account for between 42 and 56 % of employment for the whole EU area. Small firms have a +30 % share of employment within metal prod-ucts (e.g. machines and equipment), construction and wood prodprod-ucts. Medium sized firms
account for +30 % of employment within rubber and plastic products, textiles, paper products (incl. pulp) and apparel. In the years 2004-2006, employment increased twice as much in SME’s than in large firms (six percent compared to three percent), for the EU area. Sweden was no exception to this development. (Schmiemann, 2009)
American research conducted in the years 1990-2001 showed that the share of people working in small size firms is not necessarily growing; but that this is due to class migration (fast-growing small firms grow and become mid-size and so forth). As for net job growth in the USA, however, small firms accounted for nearly 80 % of all new jobs (Edmiston, 2002). There is a constant high-paced turnover of jobs, and even if the numbers may differ among countries, different studies have come to the same conclusion. An American study estimated the share of jobs that have either been created during the last year or is to be eliminated over the next year to as much as 10 % (Caballero, 2008).
2.5
Small and Young Firms
There appears to be wide academic support for the notion that small firms account for a large share of new jobs. However a large amount of research indicates that it is not neces-sarily the smallness, but the newness (Johansson, 2002; Davidsson & Delmar 2002, 2010) of smaller firms that is the reason for this, since a small number of very fast-growing small firms, so called “gazelles” account for a strikingly high proportion of the new jobs created by small firms (Henrekson & Johansson, 2008).
Davidsson & Delmar (2002) showed that of the 10 % fastest growing firms in Sweden dur-ing the years 1987-1996, as many as 62 % were younger than 10 years. (Davidsson & Del-mar, 2002).
In a study of Swedish corporate structure and job creation, Davidsson and Delmar (2010) emphasize the importance of organic growth as opposed to acquired growth in employ-ment. They offer two formulas for organic growth, one that adjusts growth in employment for employment of acquirements during that year, and one that is similar but also adds “sold off” jobs during that year to compensate for spin-off jobs that have indeed been or-ganically created. Their findings show that the “gazelles” (defined as the 10 % of fastest growing firms) do not create more jobs organically in the Swedish economy than the so called “mice”. However, their findings offer strong support for the notion that young firms create more jobs than older ones. For firms 2-9 years old, the percentage of jobs created that are organic ranges from 96 % down to 58%. For firms 10 years old and older, this fig-ure is only 16 %. They conclude that most job creation in older firms can be attributed to re-structuring instead. When they shift their focus to firm size, the findings are even more convincing, with the share of jobs organically created by small firms (0-49 employees) rang-ing from 67 to 98 % and for the largest (more than 2 500 employees) from a negative -49 % to 9 % depending on which of the definitions of organic growth used. (Davidsson and Delmar, 2010).
Henrekson and Johansson (2008) mention other definitions for “gazelle”; businesses whose growth has been at least 20 % in each year of the selected interval, and businesses
that have grown by at least 50 % in at least three of the interval years. With this definition, by aggregating 20 earlier studies in the subject, they examined job creation performance for gazelles. They found strong support for superior results of gazelles, in contrast to Davids-son and Delmar (2010). Like DavidsDavids-son and Delmar, they mention that the first three years in the interval of in the latter’s study are somewhat unusual in that Sweden’s production and employment decreased each of those years, something that may have influenced their results. Moreover, services that are barred in Sweden due to government monopoly may be sectors in which gazelles generate many jobs in other countries. Thus, Henrekson and Jo-hansson put a parenthesis for Sweden in an international aggregation of results that gener-ally claim that gazelles indeed are outstanding in job creation. They conclude that there is a strong support for the view of gazelles as superior job creators and that the varying defini-tions of gazelles used in the various studies only make the case even stronger. Furthermore, they conclude that all studies focused at age of firms show that gazelle firms are young. As for firm size, small firms are overrepresented as gazelles but when it comes to creating jobs there are also major contributions from larger gazelles. Hence, firm age is more important than firm size. However, for organic as opposed to total job growth the advantage of small firms becomes more robust. (Henrekson and Johansson, 2008). Below advantages of small and large firms, as described in this section, are summarized in table 2-1:
Table 2-1: Summary of Advantages of Small and Large Firms mentioned in the Theory Section
Advantages of small firms Advantages of large firms
High degree of motivation Stability of profits
Decreased transaction costs Advantage in Capital and R&D intensive industries Fit for labor intensive industries Lower transaction costs
Increased variety of demand Abundance of specialists and expertise Efficiency in diffusion of new technology Large share of innovation
Increased importance of services Economies of scale within the firm Organic job creation Economies of scope within the firm Less affected by downturns
Quick product implementation Flexibility of output
3
Empirics
This section begins with a few figures providing the reader with a graphical overview of some developments related to this paper. After that, the statistical model and the sources of its data is presented, followed by an explanation of the rationale behind the included variables. Thereafter, the results are presented and inter-preted. Lastly, the results are analyzed in light of previous studies and theories on small firms and employ-ment growth.
3.1
Descriptive Statistics
As can be seen in figure 3-1 below, small firms account for a large share of new jobs, and their share of new jobs has grown over the period studied.
Figure 3-1: Small and Large Firm Share of New Jobs (not including mergers and aquisti-tions) 1993-2009. Source: Statistics Sweden
Figure 3-2 below shows that small firms’ share of total employment has only increased in-crementally over the period studied. This while small firms, as can be seen in chart 3-1, ac-count for a large share of new jobs. Naturally, this is partly the result of class migration of firms (as small firms grow to have more than 50 employees). But it is also likely that it is the result of higher job volatility among small firms, with a higher frequency of hires and fires. Without dwelling deeper into those discussions, it can be concluded that there has not been a general shift of employment to small firms, at the national level.
75% 80% 85% 90% 95% 100% 1993 1994 1995 1996 1997 1999 2000 2001 2002 2003 2004 2005 2006 2007 2008 2009 Large Firms Small Firms
Figure 3-2: Small and Large Firm Share of Total Employment 1993-2009. Source: Statistics
Sweden
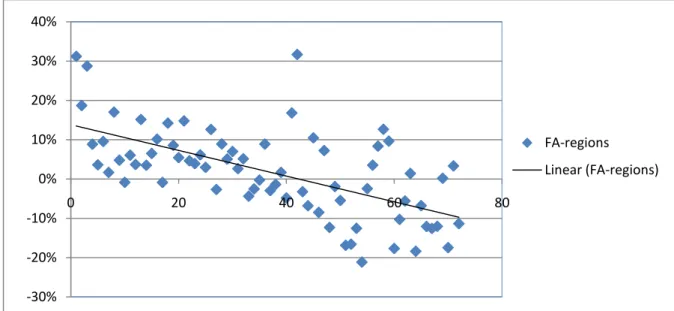
Employment growth has been highly different for Swedish regions during the period stu-died. Employment for Sweden as a whole grew by roughly 16 %. But as can be seen in fig-ure 3-3, only a few regions had had higher growth than the national average. Three of these are the big city regions; Stockholm, Göteborg and Malmö. Together, they account for near-ly half of Swedens population, which is why they have such a great impact on the national average. In Figure 3-3, it can also be seen that well populated regions have generally had stronger employment growth than sparsely populated regions, as indicated by the trendline.
Figure 3-3: Employment Growth 1993-2009 in Swedens’ 72 FA-Regions, Ordered by Popu-lation Size. Source: Statistics Sweden
0% 10% 20% 30% 40% 50% 60% 70% 80% 90% 100% 1993 1994 1995 1996 1997 1998 1999 2000 2001 2002 2003 2004 2005 2006 2007 2008 2009 Large Firms Small Firms -30% -20% -10% 0% 10% 20% 30% 40% 0 20 40 60 80 FA-regions Linear (FA-regions)
3.2
Model Specification
Using the following model, two cross-sectional tests are conducted using ordinary least squares as method:
Model 1:
empg is employment change in percent.
smallwpg is the percentage change in the number of workers employed in firms with less than 50 employees.
edug is the percentage change of workers with at least three years of university education. grpg is the percentage change of the gross regional product.
serg is the percentage change of the number of workers employed within services. popg is the percentage change of the population.
dummyh is a dummy variable where the third of the regions with the highest employment growth are assigned a value of 1 and the others a value of 0.
dummyl is a dummy variable where the third of the regions with the lowest employment growth are assigned a value of 1 and the others a value of 0.
See section 3.3 for further discussion on the variables.
Model 2:
In this model empg, grpg, popg, dummyh and dummyl are the same as in model 1. How-ever, the other three variables are different:
smallwpgp is the percentage change in the small-firm share of employment.
edugp is the percentage change in the share of workers that have at least three years of university education.
sergp is the percentage change in the share of workers employed within services. See section 3.3 for further discussion on the variables.
The two tests are both conducted for two periods: 1993-2001, and 2001-2009. The reason to why I choose the change over such long periods as dependent variables is that very short timeframes, such as one or two years, may be heavily influenced by strong cyclical patterns of the economy in general. In a strong downturn, certain sectors and industries may be
more affected than others, leading to a very large decrease of employment in regions domi-nated by these. By the same token, these regions may have very high rates of employment growth, not reflecting the general pattern, when the economy is growing again. Since this study is concerned with structural patterns of employment growth rather than volatility of labor markets, I use longer timeframes for employment growth. In the tests, all regions are of the same weight. Thus, a region with a large population is not given a greater impact on the results than a sparsely populated region. Therefore, the results are only to be inter-preted in a cross-regional context, much less valuable in discussing national developments.
3.3
Variables Specification
empg - Employment growth, in percent.
Since this study is concerned with job creation, I use percentage employment growth as dependent variable.
smallwpg – The percentage change in the number of workers in workplaces with less than
50 employees.
In the empirical studies and theories on firm size distribution described in previous sec-tions, the consensus is that small firms have grown in importance, and that they generate a disproportionately large share of new jobs. Some have stressed the importance of firm age, and provided empirical support for that it is young firms that create most new jobs. Most of the young firms are contained within the small firms segment. Therefore, I use the in-crease of people employed in small firms (with up to 49 employees) as an explanatory vari-able.
smallwpgp – The percentage change in the small-firm share of employment.
The same rationale as smallwpg.
edug – The percentage change of employees with at least three years of university
educa-tion.
An increase in the number of well-educated workers means an increase in the abundance of human capital, which can widen the scope of entrepreneurial acitivites as well as provide firms that seek to grow with the knowledge that they need. It can be inferred, from the sec-tion on previous studies, that it is in an environment of dynamic complementarity with large firms that small firms are the most important and conform the most to the positive characteristics described in the theory section, especially in regard of diversity of markets, opportunities for networking (clustering) and technological spillover effects. Large firms have advantages in R&D intensive industries. To find qualified workers, large R&D inten-sive firms are to a large extent dependent on a well-educated workforce pool (providing human capital). I include the increase in the workers with three years university level stu-dies as an explanatory factor in the model, as it reflects the development in abundance of well-educated workers.
edugp - The change in the percentage share of workers that have at least three years of
university education. The same rationale as edug.
grpg – The percentage change in the gross regional product.
This variable is included since higher level of GRP (Gross Regional Product) per capita in-dicates a higher income level, which in turn inin-dicates increased variety of demand. In such an environment, production of highly differentiated service products and products with short production runs can be justified, which may have an effect on employment. Moreo-ver, labor is one of the key inputs of increased GRP.
serg – The percentage change in employees working with services.
As indicated in the section on previous studies, the service sector has grown in importance relative to other sectors in the last decades, and account for a large share of new jobs. Therefore, the increase in workers employed in the services sector is of interest when stud-ying employment growth.
sergp – The percentage change in the share of workers employed within services.
The same rationale as serg
popg – The growth of the population, in percent.
A larger population indicates an increased variety of demand as well as increased total de-mand for goods and services. In the proximity of a larger population, specialized products with short production runs as well as differentiated professional services are demanded, in-creasing employment opportunities. It also indicates a larger and more varying supply of workers and skillsets. Therefore, the increase of the population is included as an explanato-ry variable.
dummyh/dummyl – Dummy variables for the best and worst performing regions in
terms of employment growth.
This variable is included to control for non-normality of distribution.
3.4
Data
For the study I use data on the 72 FA-regions, or Functional Analysis-regions, of Sweden. These regions reflect independent labor market areas between which there are only a low degree of commuting. The FA-regions are commonly used for regional studies. The data on FA-regions is collected from Statistics Sweden, a government agency producing official statistics for Sweden.
3.5
Results
The results of model 1 for both periods, can be found in Table 3-1 below:
Period 1: 1993-2001 Period 2: 2001-2009
Variable β Prob. β Prob.
C 0.042449 0.0678 0.005839 0.8135 EDUG -0.081025 0.0375 -0.065574 0.1614 GRPG 0.063503 0.1134 0.039506 0.0000 POPG 0.233033 0.0475 -0.019296 0.8323 SERG 0.293195 0.0000 0.189123 0.0109 SMALLWPG 0.211277 0.0001 0.188142 0.0077 DUMMYH 0.040208 0.0001 0.042478 0.0000 DUMMYL -0.054782 0.0000 -0.048146 0.0000 Information R2 0.905288 0.880817 Observations 72 72
Table 3-1: Regression Results Model 1 (OLS, White’s Robust Standard Errors) Interpretation: the results of model 1 shows a significant result (at the 5 % level) for
in-creases in educated workers in period 1, with a negative beta value indicating a negative re-lationship between increase of well-educated workers and employment growth. For period 2, however, the result is insignificant. The Gross Regional Product growth variable is sig-nificant at the 1 percent level in period 2, positively associated with employment growth. Thus, it appears that increases in GRP generally had a positive impact on employment growth in the period 2001-2009. For period 1, however, the result is not significant. In model 2 (see next page), the GRP variable does not yield any significant results. Therefore, the positive significance of the results in period 2 can be questioned. The population growth variable, however, is significant at the 5 percent level for period 1, with a positive impact on employment growth. But in period 2, the result is not significant.
Service employment growth is highly significant in both models, in explaining employment growth. It should be noted, that the calculation of service employment in this thesis is ra-ther narrow. It should also be noted, again, that the results are unweighted. Stockholm, Göteborg and Malmö, accounting for nearly half of the national population but only three out of 72 regions in the study, all have a share of service employment considerably higher than the unweighted average.
Increases in small firm employment had positive impacts on employment growth, in both periods. The results are highly significant for both periods.
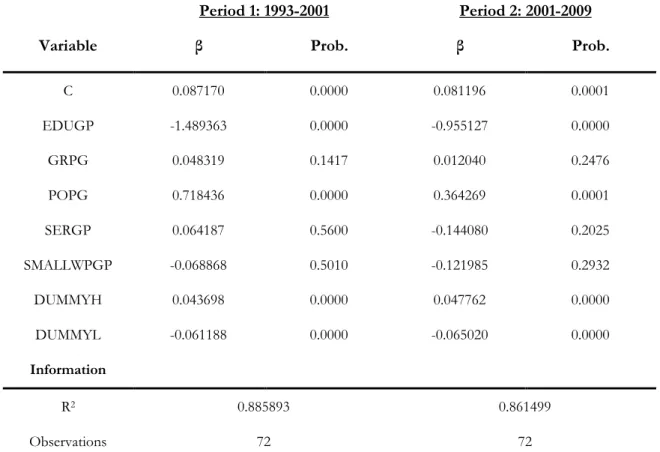
The results for model 2 are shown in table 3-2:
Period 1: 1993-2001 Period 2: 2001-2009
Variable β Prob. β Prob.
C 0.087170 0.0000 0.081196 0.0001 EDUGP -1.489363 0.0000 -0.955127 0.0000 GRPG 0.048319 0.1417 0.012040 0.2476 POPG 0.718436 0.0000 0.364269 0.0001 SERGP 0.064187 0.5600 -0.144080 0.2025 SMALLWPGP -0.068868 0.5010 -0.121985 0.2932 DUMMYH 0.043698 0.0000 0.047762 0.0000 DUMMYL -0.061188 0.0000 -0.065020 0.0000 Information R2 0.885893 0.861499 Observations 72 72
Table 3-2: Regression Results Model 2 (OLS, White’s Robust Standard Errors) Interpretation: In this model the education variable is highly significant for both periods.
It is no longer a matter of the total percentage increase of well-educated workers, but the increase in the share of workers that are well-educated. Interestingly, an increase in the share of workers with at least three of university education is associated with a decrease of em-ployment in both periods. The results are highly significant for both periods. As for growth in GRP, the results are insignificant for both periods.
Unlike in model 1, the results for population (the same variable as in model 1) are highly significant for both periods in model 2, showing a significant positive impact of population growth on employment growth.
The results also show that the change in the share of workers employed in services has not been significantly related to employment growth. The results are insiginificant for both pe-riods.
Last but not least, the variable with the strongest connection to the section on previous studies and theory: the change in the share of people working in small firms. The results for this variable are insignificant in both models. Thus, there is no significant relationship between changes small firm’s share of employment and employment growth.
3.6
Analysis of Results
In many aspects, the regions used in the cross-sectional analysis of this thesis are highly di-verse. The largest has a population roughly 800 times larger than the smallest. The primary concern of the study has been employment growth, and in that regard the development has been very different among the 72 regions. Although the regression results are generally similar for the two periods studied, individual regions have had strikingly different devel-opments. For example, of the six regions with the highest employment growth between 2001 and 2009, five had very large decreases in employment between 1993 and 2001. De-spite this volatile foundation for the study, it has yielded a number of significant results.
Model 1:
Increases in small firm employment has a significant, positive impact on employment growth in both periods. This is hardly surprising since it is intuitive that small firms ac-count for a certain share of new employment. Furthermore, it is interesting that the results, unlike those for increases in well-educated workers and population growth, are significant in both periods. This indicates a robust position of increases in small firm employment as an explanatory factor of employment growth.
The results on the growth in number of well-educated workers are somewhat surprising in that they yield negative results, though only significant in period 1. A significant positive re-lationship to employment growth was expected, as an increase in well-educated workers means an increase in the abundance of human capital, to be used by local firms pursuing growth or to yield sophisticated entrepreneurial ventures generating new employment. However, the results offer no support for this. To a large extent, this may be attributable to the development where many people who have not studied at university and leave the workforce for retirement are being replaced by younger workers who have studied at uni-versity as demands on education has increased at the labor market.
Growth of the gross regional product increases employment, according to the results. However, the result is only significant in period 2, and in Model 2 (as described at next page) the results are not significant at any level for any of the periods, although the variable is the same as in model 1. It is likely that this effect is highly different from region to re-gion, depending on the ratio between capital intensive and labor intensive industries. Growth of services production is likely to require larger labor inputs than if the same growth took place in a capital intensive industry, such as extraction of minerals. In the lat-ter category, jobless growth is more probable.
There is a significant positive relationship between population growth and employment growth in period 1 (at the 5 % level), but the result is highly insignificant in period 2. How-ever, in model 2, where the variable is the same as in model 1, the results are significant at the 1 % level for both periods. Different parts of the population growth may have different impact. Population growth through birth of children yield increasing demand for certain products, but parents at home with the children temporarily leave the workforce, and create a minus in employment statistics, at least during the year of parental leave. Thus,
births have a somewhat dubious effect on employment growth of the region, especially if the children move to other regions to seek employment as they grow up. Another part of population growth is migration to or from other regions and countries. Families moving to a region is likely to have a stronger positive impact on aggregate demand for goods and services. This while some of the family members seek to join the workforce. Thus, migra-tion should more significantly affect employment growth than births of children.
There is also the issue of causality, as a large share of population growth differences is due to migration between different regions, and not only childbirths. The question that arises is whether people move to certain regions due to employment opportunities, or if they move for other reasons, such as lifestyle preferences, and then seek employment for sustenance. Regardless, the results are weak and population growth does not have a clear, positive im-pact on employment growth.
For both periods, increases in the number of people employed within services yield posi-tive, significant results. This is rather intuiposi-tive, as it is likely that services account for a cer-tain share of new jobs.
Model 2:
From the section on previous studies and theory, it can be inferred that small firms play a key role in generating new jobs, due to a number of advantages related to their size, such as low bureaucracy, flexibility, efficienct diffusion of new technology, low transaction costs and fit for the increased number of interstice. Some argue that the small firms with the best growth prospects can be found in the proximity of large firms, in so called “complementar-ity” as small firms are strong where large firms are weak and vice versa. However, the sta-tistical results yield no praise for small firms as an explanatory factor for regional employ-ment growth. Whatever developemploy-ment that can be seen at the national level, an increased share of small firm employment has been no blessing at the regional level. Figures 3-4 and 3-5 depicts employment growth and changes in small firm share of employment for period 1 and 2, respectively. -.15 -.10 -.05 .00 .05 .10 -.2 -.1 .0 .1 .2 .3 EMPG1 S M A L L W P G P 1 -.08 -.04 .00 .04 .08 .12 .16 -.15 -.10 -.05 .00 .05 .10 .15 EMPG2 S M A L L W P G P 2
In period 1, it can be seen that among the regions with the worst decreases of employment, the regions with both the largest increase and largest decrease of small firm employment share can be found. The refugee theory may be applicable in discussing the situation for the first category, as small firm dominance may be a situation with lack of other employment opportunities, rather than the result of small firm virtues. Lacking large firms, a region loses much of the synergy effects discussed in the theory section. In period 2 (figure 3-5) the large disparities among the worst performing regions, in terms of employment growth, is gone. However, period 2 shows a downward-sloping relationship between the two va-riables, although not strong enough to yield significant regression results. If anything, it shows that an increased share of small firm employment has not led to higher employment growth, at the regional average.
However, this does not in any way imply that small firms in general are not important and that they definitely do not conform to the virtues that they have been ascribed in previous sections. Moreover, it does not contradict the notion of small firms as important job crea-tors. But again, small firm dominance of employment is not a blessing in a cross-regional context.
The results on the change in share of workers that have at least three years of university education are surprising, as there is a significant negative relationship to employment growth for both periods. At the national level, for the whole period studied in this thesis (1993-2009), there has been a considerable increase in the share of highly educated work-ers, from 15.3 to 31.4 percent of the workforce. Nearly all regions have had an increase in the share of highly educated workers, but the increase has been generally stronger in re-gions with slow or negative employment growth, rere-gions that generally also have small populations. It may be the case that in these regions, an increased share of highly educated workers may reflect emigration of those workers that are not highly educated, for example due to losses of relatively simple jobs within distributive trade and manufacturing.
As mentioned previously, growth of the gross regional product is not significant in explain-ing employment growth. As for population growth, the results for both models were dis-cussed (since the variable is the same) in the model 1 section at the previous page.
While the services sector has increased its share of total employment over time, and yields a large share of new jobs at the national level, the results of this study do not convey a great significance of the change in the services sectors share of employment in explaining region-al employment growth. An increase or decrease in the share of service firm employment is highly insignificant. Moreover, at the regional average, the service sectors’ share of em-ployment growth has increased only incrementally. The professional services sector, which creates disproportionately many new jobs, is likely to be concentrated to certain regions, more explicitly those with large cities. Many of the 72 regions, however, are sparsely popu-lated and have a much less sophisticated families of firms, with lower growth prospects. An increase in service employment’s share of employment in these regions may reflect a redi-stribution of workers into simple imitative service firms but not new opportunities and markets leading to employment growth. Again, it should be noted that these are the results
4
Conclusion
Several studies have shown small firms to be superior job creators, and there have been many theoretical explanations of this, identifying advantages in relation to lage firms. Over the period studied in this thesis, 1993-2009, there has been vast regional differences in em-ployment growth. Of the 72 regions studied, the most successful had a 31,7 percent in-crease of employment whereas the least successful has had a dein-crease of 21,13 percent. Two multiple regression models have been used in this thesis, both with employment growth as dependent variable. Model 1 shows that that increases in small firm employ-ment is significant in explaining employemploy-ment growth in both periods, with a positive rela-tionship. However, the results of model 2, with the change in the share of workers in small firms as explanatory variable, Yield insignificant results for both periods. Consequently, re-gardless of their importance at a national aggregate level, small firms should not necessarily be hailed as generators of employment growth at a regional level.
Moreover, the results of model 1 yield no positive relationship between increases in the number of workers with at least three years of education and increases in employment. On the contrary, model 2 shows that for both periods studied, the regions with the highest in-creases in the share of workers with at least three years of university education have gener-ally had negative employment growth. Model 2 also shows that changes in the service sec-tors’ share of employment is not significantly related to employment growth for any of the periods.
List of references
Acs, Zoltan J. & Armington, Catherine (2003). Endogenous Growth and Entrepreneurial Activities in Cities. Center For Economic Studies Working Papers, January 2003.
Acs, Zoltan J. & Mueller, Pamela (2007). Employment effects of business dynamics: Mice, Gazelles and Elephants. Small Business Economics, 2008: 30, 85-100.
Arpaia, Alfonso (2005). Special issue: risks of jobless growth in the EU. labor market and wage developments in 2004, with special focus on the risk of jobless growth. Euro pean economy special report. No 3, 2005.
Caballero, Ricardo J. Creative destruction. The New Palgrave Dictionary of Economics. Second Edition. Eds. Steven N. Durlauf and Lawrence E. Blume. (Eds.). Palgrave Macmillan, 2008. The New Palgrave Dictionary of Economics Online. Palgrave Macmillan. Retrieved March 14, from
<http://www.dictionaryofeconomics.com/article?id=pde2008_C000421> doi:10.1057/9780230226203.0337
Carree, Martin & Klomp, Luuk (1996). Small Business and job Creation: A Comment. Small Business Economics, Vol. 8: 317-322.
Carree, Martin & Thurik, Roy (1999). Industrial Structure and Economic Growth. Innova tion, Industry Evolution and Employment, 86-110. Cambridge University Press.
Carree, Martin; Van Stel, André; Thurik, Roy & Wennekers, Sanders (2002). Economic Development and Business Ownership: An Analysis Using Data of 23 OECD Countries in the Period 1976-1996. Small Business Economics. Vol. 19: 271-290, 2002. Davidsson, Per; Achtenhagen, Leona & Naldic, Lucia (2007). The life cycle of entrepre
neurial ventures. International handbook series on entrepreneurship. Vol. 3: 361-398, 2007. Davidsson, Per & Delmar, Frederic (2002). Tillväxt i små och nya – och något store och
mognare – företag. Ratio Working Papers. 2002.
Davidsson, Per & Delmar, Frederic (1998). Some Important Observations Concerning Job Creation by Firm Size and Age. Rencontres St. Gallen. September, 1998.
Edmiston, Kelly (2007). The Role of Small and Large Businesses in Economic Develop ment. Economic Review Federal Reserve Bank, June, 2007.
Evans, David S. (1987). The Relationship Betweem Firm Growth, Size, and Age: Estimates for 100 Manufacturing Industries. The Journal of Industrial Economics. Vol. 35, No. 4, 1987.
Frederiks, K. C; Mosselman, Marco & Meijaard, Joris (2002). Organisatietypen in het mkb, Eim scales. 2002.
Gray, Colin (2002). Entrepreneurship,resistance to change and growth in small firms. Jour nal of small business and enterprise development. Vol 9: No 1, 61-72, 2002.
Henreksson, Magnus & Johansson, Dan (2008). Gazelles as Job Creators – A Survey and Interpretation of the Evidence. Small Business Economics, Vol. 35, No. 2, 227-244.
Henreksson, Magnus & Johansson, Dan (1999). Sysselsättnings- och företagsstrukturen: Endast Sverige snapsglas har, eller? Ekonomisk Debatt, vol. 27, No. 3.
Howitt, Peter. Endogenous growth theory. The New Palgrave Dictionary of Economics. Second Edition. Steven N. Durlauf and Lawrence E. Blume. (Eds). Palgrave Mac millan, 2008. The New Palgrave Dictionary of Economics Online. Palgrave Mac millan. Retrieved March 15, 2011 from
http://www.dictionaryofeconomics.com/article?id=pde2008_E000079 doi:10.1057/9780230226203.0472
Johansson, Dan (2002). Tillväxt och nya och små företag. Ratio Working Papers, 2002. Julien, Pierre-André (1993). Small Business As A Research Subject: Some Reflections on
Knowledge of Small Businesses and Its Effects on Economic Theory. Small Business Economics, Vol. 5: 157-166, 2007.
Mata, José. Gibrat's Law. The New Palgrave Dictionary of Economics. Second Edition. Eds. Steven N. Durlauf and Lawrence E. Blume. (Eds.). Palgrave Macmillan, 2008. The New Palgrave Dictionary of Economics Online. Palgrave Macmillan. Retrieved March 14, 2011 from
http://www.dictionaryofeconomics.com/article?id=pde2008_G000038 doi:10.1057/9780230226203.0641
Noteboom, Bart (1994). Innovation and Diffusion in Small Firms: Theory and Evidence. Small Business Economics. No. 6, 327-347.
Pagano, Patrizio & Schivardi, Fabiano (2003). Firm Size Distribution and Growth. Scandi-navian Journal of Economics. Vol. 105: 255-274, 2003.
Rothwell, Roy (1989). Small Firms, Innovation and Industrial Change. Small Business Eco-nomics, Vol. 1: 51-64, 1989.
Schmiemann, Manfred (2009). SMEs were the main drivers of economic growth between 2004 and 2006. Retrieved March 11, 2011, from
http://epp.eurostat.ec.europa.eu/cache/ITY_OFFPUB/KS-SF-09-071/EN/KS-SF-09-071-EN.PDF
Schmiemann, Manfred (2008). Enterprises by size class – overview of SMEs in the EU. Re trieved March 11, 2011, from
http://epp.eurostat.ec.europa.eu/cache/ITY_OFFPUB/KS-SF-08-031/EN/KS-SF-08-031-EN.PDF
Schreft, Stacey & Singh, Aarti (2003). A closer look at jobless recoveries. Economic review, federal reserve bank of kansas city. Quarter 2 issue 45-73, 2003.
Appendix 1 – The 72 FA-regions of Sweden
Explanation of abbreviations:
E1∆% - Percent change in total employment 1993-2001 E2∆% - Percent change in total employment 2001-2009
SE∆% - Change in small firms percent share of employment 1993-2001 SE∆% - Change in small firms percent share of employment 2001-2009
REGION E1∆% E2∆% SE1∆% SE2∆%
20001 FA1 Stockholm 22,481 7,14 0,181087301 2,1863 20002 FA2 Nyköping 4,506 4,23 1,491167252 0,8072 20003 FA3 Eskilstuna 5,883 0,6 -0,60453188 2,3116 20004 FA4 Östergötland 6,742 1,99 -0,439440776 3,5084 20005 FA5 Värnamo 11,223 -4,6 -5,912574402 5,3135 20006 FA6 Jönköping 13,258 3,33 -4,719905366 2,0847 20007 FA7 Vetlanda 0,548 -0,8 -6,525638299 2,7022 20008 FA8 Tranås 11,031 -0,5 -5,316068699 1,8562 20009 FA9 Älmhult 11,995 4,31 -3,888728436 0,6871 20010 FA10 Ljungby 5,921 2,81 -3,457782458 2,0176 20011 FA11 Växjö 10,349 4,03 -3,201152512 1,8765 20012 FA12 Kalmar 6,095 -1,4 -4,058709144 5,4821 20013 FA13 Vimmerby 0,108 -4,9 -1,175545116 3,4905 20014 FA14 Västervik 0,067 -1,4 -0,907144317 4,3176 20015 FA15 Oskarshamn 7,286 -2 -4,429674689 0,9894 20016 FA16 Gotland 4,222 0,82 -2,248695497 6,7278 20017 FA17 Blekinge 6,087 -0,6 0,306941863 2,9189 20018 FA18 Kristianstad 8,557 -2,3 -2,24928195 6,8897 20019 FA19 Malmö 10,181 7,74 0,211897201 2,2753 20020 FA20 Halmstad 6,862 7,76 -1,927494341 2,3486 20021 FA21 Göteborg 20,146 7,16 -2,022670691 1,743 20022 FA22 Borås 8,926 -0,3 -4,723510977 2,3214 20023 FA23 Trollhättan 9,585 -4,4 -2,438416918 5,6153 20024 FA24 Lidköping 9,212 3,12 -4,98802659 4,8002 20025 FA25 Skövde -0,98 0,14 -2,08489339 1,6452 20026 FA26 Strömstad 20,62 9,19 -3,350682338 7,7719 20027 FA27 Bengtsfors -5,26 -12,2 -3,58087195 10,443 20028 FA28 Årjäng 6,971 5,32 -0,376520959 8,9885 20029 FA29 Eda 6,646 2,81 -4,805464547 11,53 20030 FA30 Karlstad 1,411 0,28 1,073797254 3,1446 20031 FA31 Torsby -0,11 -12,4 -1,527187042 12,946 20032 FA32 Hagfors -10,84 -6,4 2,49245815 0,8966 20033 FA33 Filipstad -12,88 -9,5 -0,871849031 1,6153 20034 FA34 Örebro 7,096 2,3 -0,208438085 2,5573 20035 FA35 Hällefors -14,15 -4,1 -1,244610348 2,6498
20037 FA37 Västerås 4,278 -0,6 0,320659698 4,9225 20038 FA38 Fagersta -2,33 -4,6 -3,01592719 2,4819 20039 FA39 Vansbro 7,881 -12,5 -8,748259608 11,161 20040 FA40 Malung -1,17 4,76 -1,567318153 -1,785 20041 FA41 Mora -3,38 5,26 1,05351223 4,4173 20042 FA42 Fa-lun/Borlänge 5,773 4,14 -1,288709169 0,9348 20043 FA43 Avesta 1,094 -4 1,363713218 0,6613 20044 FA44 Ludvika 7,968 -9,7 -3,269144803 1,0924 20045 FA45 Gävle 2,738 0,75 -0,31244979 2,8121 20046 FA46 Söderhamn 5,438 -7,7 1,315505382 5,8484 20047 FA47 Hudiksvall 2,009 0,61 -4,861001112 4,6812 20048 FA48 Ljusdal 8,229 -0,9 -1,885901201 4,217 20049 FA49 Sundsvall 0,442 -1,3 1,665223803 2,168 20050 FA50 Kramfors 1,324 -13,4 -7,40789114 5,4223 20051 FA51 Sollefteå -12,73 4,88 6,680109053 -4,161 20052 FA52 Örnsköldsvik 2,501 4,4 -1,260758364 2,8925 20053 FA53 Östersund 0,291 3,62 -3,266151002 3,7573 20054 FA54 Härjedalen 0,644 -3,1 -7,870693388 7,6418 20055 FA55 Storuman -7,85 1,19 7,407384478 0,3946 20056 FA56 Lycksele -3,43 -2,1 -0,80713982 1,8211 20057 FA57 Dorotea 12,697 -8,3 -1,690248599 2,3444 20058 FA58 Vilhelmina -2,98 -7,5 -12,75022661 7,6258 20059 FA59 Åsele -6,05 -12,1 8,857164786 6,1958 20060 FA60 Sorsele 3,843 -14,6 -4,611398486 5,6341 20061 FA61 Umeå 8,543 5,24 -0,072458217 0,7059 20062 FA62 Skellefteå -1,23 4,27 -0,339033991 0,3953 20063 FA63 Arvidsjaur -8,18 10,48 0,379752893 -5,108 20064 FA64 Arjeplog -10,1 11,46 -12,44500518 1,2649 20065 FA65 Luleå 4,907 -1,2 -0,800054147 4,7503 20066 FA66 Överkalix -7,82 -4,6 4,798815712 10,619 20067 FA67 Övertorneå -13,5 1,09 0,223251769 -1,09 20068 FA68 Haparanda -3,67 12,49 -6,062629758 3,5391 20069 FA69 Pajala -14,97 -4 -8,641536615 4,751 20070 FA70 Jokkmokk -16,97 5,91 9,646307433 -1,722 20071 FA71 Gällivare -11,69 11,06 6,501339725 3,2671 20072 FA72 Kiruna -10,83 8,55 6,510685884 -1,834
Appendix 2 – Regression Output
Dependent Variable: EMPG1 Method: Least Squares Date: 06/08/11 Time: 12:26 Sample: 1 72
Included observations: 72
White Heteroskedasticity-Consistent Standard Errors & Covariance
Coefficient Std. Error t-Statistic Prob. C 0.042449 0.022845 1.858111 0.0678 EDUG1 -0.081025 0.038140 -2.124421 0.0375 GRPG1 0.063503 0.039567 1.604951 0.1134 POPG1 0.233033 0.115324 2.020676 0.0475 SERG1 0.293195 0.053816 5.448114 0.0000 SMALLWPG1 0.211277 0.049083 4.304469 0.0001 DUMMYH1 0.040208 0.009906 4.058990 0.0001 DUMMYL1 -0.054782 0.010987 -4.986038 0.0000 R-squared 0.905288 Mean dependent var 0.020496 Adjusted R-squared 0.894929 S.D. dependent var 0.085788 S.E. of regression 0.027808 Akaike info criterion -4.222545 Sum squared resid 0.049490 Schwarz criterion -3.969582 Log likelihood 160.0116 Hannan-Quinn criter. -4.121840 F-statistic 87.39033 Durbin-Watson stat 1.939971 Prob(F-statistic) 0.000000
Dependent Variable: EMPG1 Method: Least Squares Date: 06/08/11 Time: 12:26 Sample: 1 72
Included observations: 72
White Heteroskedasticity-Consistent Standard Errors & Covariance
Coefficient Std. Error t-Statistic Prob. C 0.087170 0.018705 4.660339 0.0000 EDUGP1 -1.489363 0.296393 -5.024966 0.0000 GRPG1 0.048319 0.032472 1.488008 0.1417 POPG1 0.718436 0.126551 5.677058 0.0000 SERGP1 0.064187 0.109555 0.585891 0.5600 SMALLWPGP1 -0.068868 0.101766 -0.676731 0.5010 DUMMYH1 0.043698 0.008796 4.967738 0.0000 DUMMYL1 -0.061188 0.010176 -6.013099 0.0000 R-squared 0.885893 Mean dependent var 0.020496 Adjusted R-squared 0.873413 S.D. dependent var 0.085788 S.E. of regression 0.030523 Akaike info criterion -4.036251 Sum squared resid 0.059625 Schwarz criterion -3.783288 Log likelihood 153.3050 Hannan-Quinn criter. -3.935546 F-statistic 70.98253 Durbin-Watson stat 1.597412 Prob(F-statistic) 0.000000