PROMARKET REFORMS AND ALLOCATION OF CAPITAL IN INDIA
Sameeksha Desai, desais@umkc.edu University of Missouri Kansas City Max Planck Institute of Economics
Johan E. Eklund*, johan.eklund@ratio.se Ratio Institute
Jönköping International Business School
Andreas Högberg, andreas.hogberg@ihh.hj.se Jönköping International Business School
*corresponding author
ABSTRACT
The government of India initiated pro-market reforms in the 1990s, after almost five decades of socialist planning. These and subsequent policy reforms are credited as the drivers of India’s radical economic transformation. Prior to reforms, private investment was strictly regulated and restricted to limited sectors. There have since been numerous changes in sectors important for investment, such as the bank sector, which affects outcomes of firm-level strategic decision making and investment behavior. By most estimates, India’s economy will continue to grow rapidly. The purpose of this paper is to investigate changes in investment behavior from the introduction of reforms to current conditions. Reforms changed several institutional frameworks for firm operations, allowing firms to pursue more competitive strategies. Given the importance of ownership in determining firm efficiency and access to capital, we examine the effect of ownership type, and also control for industry differences in capital allocation. We compute a measure of investment efficiency derived from the accelerator principle: Elasticity of capital with respect to output.We find that the allocation of capital has been slow to respond to reforms, indicating similar pace of firm responses. The findings suggest that firms face significant costs in adjusting their capital stock, which inturn leads to inefficient capital allocation. Surprisingly, we find no significant improvement over the 1991-2006 time period. JEL-codes: E22, E23, G18, G20, E44, L50
Keywords: allocation of capital, India, institutional reforms, ownership
Acknowledgments: We thank Zoltan Acs, Åke E. Andersson, David Audretsch, Per-Olof Bjuggren, Börje Johansson, Charlie Karlsson, Prashanth Mahagaonkar, Roger Stough, Daniel Wiberg and participants at seminars held at Jönköping International Business School. Sameeksha Desai thanks the Kauffman Foundation and Max Planck Institute for research support. Financial support for Andreas Högberg’s
INTRODUCTION
Immediately after its independence in 1947, India embraced state-directed economic planning as its path to prosperity and self-sufficiency. In this economy, the state would lead the country through central planning, creating jobs, distributing resources and equitably providing public goods. Inspired by Fabian socialism, India created an intricate system of industry licensing and regulations known as the license Raj.
However, these policies failed to inspire impressive economic development and growth. For the three decades following independence, average economic growth was 1.25 percent annually, though several other “less promising” countries in Asia grew at much higher rates. India’s slow growth until the early 1990s is often linked to excessive or ineffective regulation (Besley and Burgess, 2004)1.
From the mid-1980s, gradual pro-market reforms were initiated, and gained momentum after a severe crisis of payments in the early 1990s and changing central government. By 1991, the push for such reforms led to tangible reductions of state control and interventionism in economic activity. As a result, economic growth increased to about 7.5 percent by 2007, and foreign direct investment increased from less than 0.1 percent of GDP in 1990 to about 2 percent of GDP (OECD, 2007).
A great deal of research has examined the Indian transition from a highly planned and regulated market towards an increasingly open economy. There have been important changes in the size, strength and composition of economic activity. In fact, there is a robust body of literature on the Indian economy in general, both before and after 1991, its transition after independence and its recent pattern of growth.
1 The central government has historically been tasked with almost all regulatory functions, including regulations governing matters of trade, exports, capital, entry and labor.
However, it is difficult to separate smaller or individual institutional dynamics from parallel shifts in governance and institutional environment.
In particular, the specific effects of broader institutional changes on firm level strategy and performance are still largely unknown. For example, deregulation of any kind can affect the firm’s strategic decisions because it creates new opportunities and potential new combinations of resources. In this paper, we link ownership and allocation of capital to shed light on one such set of changes. In the next section, we briefly discuss deregulation and patterns of ownership in the context of pro-market reforms in India. In the third section, we present our methodology, based on the accelerator principle, as well as our data. We discuss our results and conclude in the fourth section.
The purpose of this paper is to examine how efficiently Indian firms allocate recourses. To this end, we use the accelerator principle from which we derive a measure of how swiftly firms respond to changes in demand and supply conditions: the elasticity of capital with respect to output. This is in fact a measure of the functional efficiency of capital allocation. For capital allocation to be efficient the elasticity of capital with respect to output should be one2. On average we find that the elasticity of capital in India is about 0.20, which suggests a weak capital market and significant adjustment costs By comparison, corresponding estimates for the US is close to one and for China close to 0.5. Furthermore, we find no general improvement in capital allocation since 1991 when gradual reforms were initiated. However, we find that industry variation and ownership matter for capital allocation. For example, institutional investors appear to improve allocation whereas bank ownership reduces the elasticity of capital. But in economic terms these effects are relatively small. The
2 Eklund and Desai (2008) estimate the elasticity of capital for 44 countries and find the world average to be one.
major public policy implication is that previous policy reforms have been inadequate in terms of resource efficiency, and that further improvements in capital allocation need to come from further deregulation.
REFORMS IN INDIA: A BRIEF DISCUSSION
The Indian government made a strong effort to reform with its New Industrial Policy in 1991. This policy came decades after the original Industrial Policy Resolution of 1948, wherein Jawaharlal Nehru emphasized the importance of consistently increasing production. In 1956, a new Industrial Policy Resolution identified rapid economic growth as the path to a socialist society, assigning the primary responsibility of economic (and industrial) development to the central government. After this, multiple Industrial Policy Statements (in 1973 and 1977) demonstrated a shift in government perception and treatment of the private sector. In 1980, the Industrial Policy Statement laid out by Prime Minister Indira Gandhi specifically emphasized the need for competition and technological advancement in domestic industries, in order to encourage both exports and foreign investment inputs. Between 1980 and 1991, multiple government initiatives inched slowly toward institutional reforms, and finally, led to major changes with the New Industrial Policy in 1991. The New Industrial Policy of 1991 was designed to gradually reduce the extensive industrial licensing burden on firms, and to encourage stronger performance and increased competitiveness in public enterprises (see Sáez and Yang, 2001).
There are two especially relevant areas for deregulation in India. On the one hand, regulation of labor is relevant because of the size and resulting productive capacity of the workforce; on the other hand, regulation of capital and financial institutions is relevant because of the structure of small business and the informal
sector in India. There are still legislative or regulatory impediments to firm performance. For example, there are disincentives from labor market regulations for firms that could exploit economies of scale. Manufacturing firms with more than 100 employees must technically receive government approval to discharge an employee, potentially making firms reluctant to grow by imposing further red tape on their activities. The ability to hire and discharge employees with ease is important for firms to be responsive to industry trends and market fluctuations3. This is at least one contributing explanation for the dominance of small enterprises in the Indian economy: firms with more than 10 employees account for only 3.75 percent of total employment4.
A common element in most economic reform strategies is deregulation of the financial sector. This has been the case in India. For example, the legislative requirements for certain levels of investment in government securities have been reduced. Large loans no longer require individual approval from the Reserve Bank of India, and the system for interest rate controls has been dismantled (Ahluwalia, 2002). Privatization and opening the economy to foreign investors began at the end of the 1990s, and the first public company was privatized and sold to foreign investors in 1999. Today, 100 percent ownership is allowed in all sectors except for banking, insurance, telecommunication and airline industries.
With respect to banking, reforms have led to improved performance but are still necessary in terms of financial services infrastructure, cost of intermediation, access to banking services, etc. (see Aziz et al., 2006). In addition, there are potential
3 See Botero et al. (2004) for more on cost of hiring and firing, and on labor regulation more generally. 4 See OECD (2007) for this figured in developed countries. It is important to note that these numbers are for official, i.e. formally registered firms, but the unofficial sector in India is large. The imposition of certain regulations, including labor regulations, can create barriers to formal sector entry in many developing countries. See Klapper et al. (2006) for more on the regulation of entry. In the case of India, it is also likely that many firms with more than 10 employees are not captured in official estimates simply because they are not registered. However, this does not prevent them from operating.
gains from further reform. Despite the risks of international financial integration, this can still lead to improved “macroeconomic policy discipline” and financial sector development (Aziz et al., 2006: xi).
Public firms are in general less productive than private firms5, which makes the case, at least in part, for revitalization6. Privatization policies have focused on the sale of minority stakes in firms, as opposed to transferring control. In spite of capital market reforms, state ownership remains pervasive in some key sectors and affects investment decisions. According to Ahluwalia (2002), the negative effects result from applying civil service management skills to private sector decisions: “Even if the government does not interfere directly in credit decisions, government ownership means managers of public sector banks are held to standards of accountability akin to civil servants, which tend to emphasize compliance with rules and procedures and therefore discourage innovative decision making (2002: 82)”.7 This adds an implicit third facet of public policy to the classic problem of separating ownership and control8.
With respect to regulation of labor, Besley and Burgess (2004) study the effect of labor market regulation on manufacturing performance in India for the period 1958-1992. They find important differences across states based on state government enactment of pro-worker or pro-employer policy. They find pro-worker labor regulation led to decreases in output, employment, investment and productivity in the
5 A number of studies have examined firms in the energy sector. See Shukla et al. (2005) for a discussion of relevant literature, and a study of how changes in ownership have affected provision of electricity.
6 See OECD (2007).
7 A similar point is: Short of privatization, publicly owned companies can be controlled by a government investment agency, rather than the ministries subsidizing the companies (as is the case now). See OECD (2007) for more.
8 This also introduces perspectives from public choice, where the policy planner may also be the bank manager. For more on separation of ownership from policy-making, see OECD (2007).
(formal) manufacturing sector, as well as increases in informal sector output9. In general, studies of the regulation of labor find negative impacts for the economy, including higher unemployment and a greater share of the unofficial economy (see Botero et al, 2003).
The regulation of labor typically affects employers or workers, whereas a wide range of other institutional determinants directly affects capital and other resource allocation. These institutions include ownership structures, financial mechanisms governing firm interactions, bankruptcy law, minority shareholder protection, property rights, broad legal and political mechanisms.
Sáez and Yang (2001) examine three sectors for effects of deregulation: banking, energy and telecommunications. They conclude that although there has been improvement in these sectors, the change has been observed primarily in the relatively smaller firms. In addition, this occurred at a sub-national level rather than at the national level. Despite improvements, the telecommunications and energy sectors are still subject to heavy regulations. Therefore, firms working within – or affected by – these sectors still face significant inefficiencies related to firm organizing activities.
Kumhakar and Sarkar (2003) examine deregulation, ownership and productivity of firms in the Indian banking industry for the years 1985 to 1996. They estimate the growth of total factor productivity (TFP) for this sector. The TFP is divided into three sub-components: technical change, scale and miscellaneous. Using data for both public and private sector banks, and for periods before and after the deregulation, they do not find an increase in the growth of TFP, as they expected. This may be interpreted as a lack of change on the part of short and medium term bank-level policies in spite of deregulation. However, the authors find that private sector
banks improved their performance, likely due to increased freedom to expand their operations and output. On the other hand, they also find that public sector banks have not had a strong response to deregulation.
The actual effects of deregulation on resource allocation among Indian firms in various industries remain to a large extent unclear. Given the extent and direction in policy reforms one would, however, expect firms to have gradually become more responsive to shifts in supply and demand conditions.
METHOD
Our method used in this paper is based on the accelerator principle. The accelerator principle holds that investments are determined by changes in output. If output grows, this is taken to reflect a growing need for capital. The simple accelerator model assumes that output is proportional to capital. By the same token, any level of output will also be associated with the stock of capital. This method is in fact a way measuring what Tobin (1984) labeled the functional efficiency of capital markets. The accelerator model is also intimately associated with Samuelsson’s (1939) accelerator-multiplicator model of business cycles. For a more detailed discussion of the accelerator methodology derived here see Eklund and Desai (2008). The accelerator model with a desired level of capital denoted *
t
K is determined by the
output Yt:
Kt* =kYt (1)
In the equation, k, is the capital coefficient. Assuming that the desired level of capital is equal to the actual capital denotedKt , changes in the desired stock of capital are
proportional to net investments, It and
(
Kt −Kt−1)
. Net investments It can be denoted as:It =Kt−Kt−1 =
λ
(
Yt−Yt−1)
(2)Given the formulation of net investments in equation (2), these are proportional to the change in output over time and an accelerator
λ
. Given the assumption of desired capital is equal to actual capital still holds, then it is given thatλ
=k. However, this assumption is not normally fulfilled.By dividing both sides of the equation with Kt−1 the following equation is
obtained: 1 1 − − ∆ = t t t t K Y K I λ (3) Since * 1 − = t t kY
K we can substitute Kt*−1 with kYt-1 in equation (4). This gives us the following equation: 1 * 1 − − ∆ = t t t t Y Y K I
λ
(4) Now λ* represents k /λ
, or the elasticity of capital with respect to output (here reflected by sales). Thanks to the normalization, it is possible to make empirical estimations of equation (4).Assuming that Kt* =Kt over time will give
λ
=k resulting in λ* =1. If the adjustment is incomplete and partial, so Kt ≠ Kt* the elasticity of capital with respect
their capital stock: Costlier adjustment will be reflected by a lower elasticity, all else equal.10
An alternative to net investments is to use gross investments. Gross investments are obtained by adding replacement investment (depreciation of old assets). Assuming that these are proportional to the old capital stock this can be denoted as δKt-1. Gross investments (GI) are thus defined as equation (2) plus δKt-1,
t t
t K Y
GI =
δ
−1+λ
∆ . Mutatis mutandis, corresponding equation for GI is1 * 1 − − = + ∆ t t t t K Y Y
GI δ λ . In empirical applications this means that the only
difference between net and gross investments will be captured by the intercept. We estimate the following equation:
it t i t i t i t i t i S S K I , 1 , , * 1 , , =
α
+η
+θ
+λ
∆ +ε
− − (5) In equation (5), the elasticity of capital with respect to sales is represented by *λ , I is
representing investments made by the firm i in time period t. Capital stock in period
t-1 is denoted K and S denotes sales in period t. To control for unobserved
heterogeneity, we include a fixed effect ηj where j represents industry or firm effects. To control for business cycle fixed year effects, θt, are included.
Using panel data with fixed effects, we can also add interaction variables (dummies). These dummies may represent different characteristics not captured in the general equation. In our case, dummies represent different types of owners of firms. We also use time dummies for time-specific effects. Using interaction terms, the empirical equation will have following functional from:
10 Often in this type of models one used a partial adjustment model that allows for a lag structure in the adjustment process. A higher order lag structure simply means that adjustment costs are higher. Since we are interested in capturing the adjustment cost we do not investigate the lag structure.
t i t i n t i t i n t i t i t i t i t i t i t i t i X S S X S S S S K I , , , 1 1 , , , , 1 1 , , 2 1 , , 1 1 , , α η θ β β ... β +ε × ∆ + + × ∆ + ∆ + + + = − − − − − (6) where the X’s denote explanatory variables. Thus, the elasticity of capital, λ*, corresponds to the marginal effect in Equation (6):
λ* =β1+β2×X1+...+βn ×Xn−1 (7)
Using interaction explanatory variables with sales growth makes it possible to determine how these variables affect the elasticity of capital.
DATA
We collect firm-level accounting data on investments, capital stock and sales from the Prowess India database11. Total assets is used as a measure of the capital stock, Kt, and we choose sales as our measure of output. We use net investments (∆Kt), measured as change in total assets.12
Exact variable definitions and the sources are reported in Table 1. ---
Insert Table 1 about here ---
We exclude the financial sector since investments made by financial firms are of a very different nature compared to other sectors. All accounting figures have been adjusted for inflation with CPI from IMF.
The ownership data available from the Prowess database can be subdivided in to a number of broad categories. There are two main ownership categories: Promoters
11 This database is provided by the Centre for Monitoring the Indian Economy Pvt. Ltd. (CMIE). The usual accounting caveats apply.
12 As a robustness test we have also used mesure gross investments. By large the estimates are robust so we do not report any results for gross investments. We measure gross investment: It = Profit after tax –
and non-promoters. Promoters is defined by Indian legislation13 and is basically synonymous to controlling owner. A promoter is legally defined as a person who is in control of the company and has the right to appoint directors or control management. See the appendix for more on this definition. Non-promoters refers to a dispersed ownership stake, thus the firm is held by non-controlling owners. Apart from distinguishing between Indian promoters and foreign promoters, it is not possible to further subdivide the promoter category14. Thus, the following are included within the promoter category and cannot be extricated: individual/family promoters, state and government promoters, corporate promoters and institutional promoters. This is unfortunate, considering that the classic managerial economics literature would hypothesize different objectives for actors in these categories, and this is likely to influence capital allocation accordingly. It is possible however to subdivide non-promoters into a number of subcategories. This is meaningful and interesting considering that non-promoters represent the mirror image of promoters (promoters being an measure of ownership concentration).
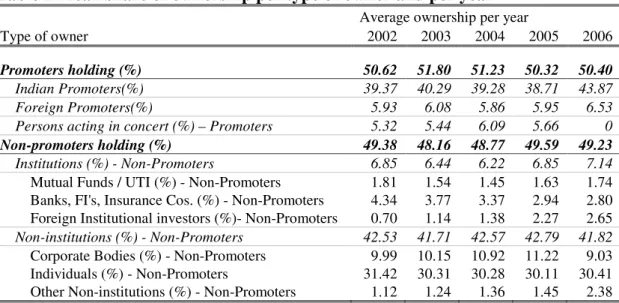
Very few firms in India are characterized by a structure of dispersed ownership. In 2006, only 126 of 2,050 firms had a dispersed ownership structure, where no owner controlled 20 percent or more of the shares. See Table 2 for data on holdings of promoters and non-promoters.
--- Insert Table 2 about here
---
13 The term promoter is defined in Regulation 2(h) SEBI (Substantial Acquisitions of Shares and Takeovers) Regulation 1997.
14 Promoters also include a subcategory for persons acting in concert. However, this ownership category is not examined further in this paper.
95 percent of the firms had an Indian promoter (controlling owner) and 86 percent had an Indian promoter owning more than 20 percent of the shares. Some 10 percent of firms had some degree of state or government ownership, and about 4 percent had a state or government promoter. On average, Indian promoters own about 46 percent of the shares, whereas the average ownership of foreign promoters is about 28 percent. However, the overall average promoter holding is just above 50 percent. The reason that total promoter holding is larger than Indian and foreign promoters separately is that in a number of cases, foreign and domestic promoters act in concert and thus jointly are defined as promoters. Since it not possible to distinguish between various promoter categories, this ownership data is fairly problematic to analyze.
In contrast to data on promoters, data on various categories of non-promoters is available. Non-promoters are divided into institutional promoters and non-institutional promoters. The non-institutional non-promoter group is further split into: (1) mutual funds (2) banks, financial institutes and insurance companies (3) foreign institutional investors. It is not possible to identify the extent to which bank, financial institutions and insurance companies are state or governmental controlled.
To begin with, we construct a unbalanced panel consisting of more than 7000 companies, for the period 1991 to 2006. Since we use growth in sales and the capital stock from previous periods, we have data for fifteen years (1991-2006). In total, the panel includes 48,623 observations.. Unfortunately the data does not follow a normal distribution; the skewness and kurtosis test for normality clearly indicates non-normality. This is mainly due to extreme outliers. A less skewed distribution is achieved by removing the 2,5th and 97,5th percentiles of our dependent and independent variables. After this, 6,457 companies and 45,443 observations remain.
Unfortunately ownership data are only available from 2001 until 2006, which corresponds to 12,423 observations.
We use industry effects in all regressions to control for unobserved heterogeneity across firms. Industry effects are theoretically appropriate because much unobserved heterogeneity across firms can be attributed to industry differences, due to regulatory differences and importance across industries. However, the empirical results are unaffected by the choice between fixed industry and fixed firm effects.
In addition to the sales accelerator, the overall elasticity of capital has also been estimated using a profit accelerator and a value added accelerator. The value added accelerator was insignificant. The profit accelerator was significant, but economically negligible. A possible explanation is the poor quality of accounting data, rendering profits and value added incomparable across firms. Using fixed effect estimation, the overall R2 for the profit accelerator was less than one percent. One possible interpretation is that sales is a fairly reliable figure and reported in a relatively consistent manner across firm, whereas one can expect significant variation in the way profits and value added are reported15. The measure of investment we use solves some of these problems by including depreciation and all items in the income statement and balance sheet that can be counted as investment.
RESULTS AND CONCLUSION
We estimate the overall elasticity to be approximately 0.20, which is relatively low. The elasticity for India suggests that it takes at least five years for the average firm to adjust to changes in demand and supply conditions. From investment theory, one
15 Companies may for example have incentives to understate profits and labor costs necessary for calculating value added may be reported differently across companies.
would expect the elasticity of capital to be equal to one. An elasticity below one indicates that firms are only partially adjusting the capital stock to changes in output. An elasticity below one (λ* < 1) implies that investments are not expanded up to the point where marginal return on capital equates with the opportunity cost of capital.
This method has previously been applied by Eklund and Desai (2008), who estimate the elasticity of capital across 44 countries. They estimate the world average elasticity of capital to be 0.91, which is not significantly different from one. However, they find significant variation across countries. For example, estimates for the US and China are 1.16 and 0.48 respectively. The estimate for India is 0.69, but for a significantly smaller sample than used in this paper (169 firms).
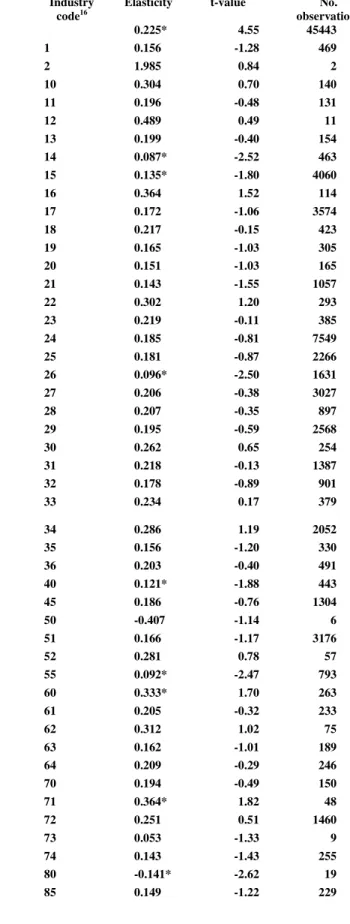
Results for ownership categories are reported in Table 3 which contains regular fixed effects results.
--- Insert Table 3 about here
---
The regressions include industry and time fixed effects. The industry dummies have been interacted with ∆St/St-1 and the coefficients constrained to sum to zero, such that industry specific elasticities are obtained. This means that any significant effect of ownership on the elasticity of capital cuts across industries. As a robustness check we have also estimated equation (7) with gross investments (as defined in note 8). The results are by and large robust and thus not reported here. Additional robustness checks include multilevel mix effects models where we allow industry elasticities to vary randomly over time. We find no general trend towards improved capital allocation over time, nor do we find any improvement in industry allocation. Industry specific elasticities are reported in Table 4. Most of the industries report
elasticities ranging from 15 to 25 percent which is very low compared to what would be expected for developed countries. One possible explanation for this low figure can be that we only look at large incumbent firms, whereas most of the growth dynamics can be expected in small young firms. Another explanation for small industry differences may be that regulatory reforms differ significantly across regions. For example, Aghion et al. (2006) find that dismantling the License Raj has proceeded at different speeds across regions in India. One of their findings is that industries in regions with relatively high levels of pro-employer policies have grown faster than industries in regions with relative lower levels of pro-worker policies. The fact that it is not possible to break down the foreign and Indian promoters into further subcategories is a limitation. It is reasonable to expect that different promoters have different objectives. These objectives may be closely related to the classic problems of agency that occur when ownership and control are separated – this is an interesting subject for further study. This may account for the fact that promoters have no robust significant effect on the allocation of capital.
Looking at non-promoters, institutional investors appear to improve allocation of capital. Breaking down institutional investors into its subcategories reveals an interesting pattern. Mutual funds and foreign institutional investors appear to improve capital allocation whereas banks seem to have a negative impact. This negative impact of banks is, however, not robust. According to the results, institutional investors increase the elasticity of capital by about 2 percentage points. The positive effect of foreign institutional investors is consistent with theories of international development and foreign investment, which tend to support the role of foreign investors (in general) in creating greater openness and accountability in recipient countries.
--- Insert Table 4 about here
---
Table 5 presents the elasticity of capital and its yearly deviations from the overall elasticity of capital for the time period studied. Few of the estimates are significantly different from zero. Those estimate that are different from zero display expected signs of the yearly elasticity compared to the overall elasticity of capital during the period based on general economic trends. For example, the elasticity of capital increase during 2005 and 2006 while it is decreasing during 2001. Overall, the changes over time are fairly small and the changes seem to follow a general economic trend.
--- Insert Table 5 about here
---
This paper investigates investment behavior and how efficiently capital is allocated to its most productive end. We use the accelerator principle to derive a measure of capital allocation: elasticity of capital with respect to output. The measure reveals how effectively firms and industries respond to changes in the desired capital stock. At one level, this measure also reflects the outcomes of strategic changes in firm-level policies and investment decisions possibly driven by reforms.
We find that controlling owners (or promoters as they are referred to in India) have no significant impact on the allocation of capital. The reason for this result may be that we are unable to distinguish between various types of controlling owners, i.e. government promoters and private individual or families. With respect to dispersed ownership (or non-promoter holdings as they are referred to in India), we observe
significant effects of ownership. Institutional investors significantly improve the allocation of capital. We observe an interesting pattern in subcategories of institutional owners: Mutual funds and foreign institutional investors improve the allocation of capital whereas banks have none or negative effect. We also find significant variation in capital allocation across industries. The ownership effects cut across industries.
The overall finding is that despite economic reforms, the efficiency of capital allocation remains fairly slow. This indicates that there is a significant lag between the introduction of economic reforms, and firm-level responses. It is possible that strategic decision-making at the firm level does not have an immediate effect, or that it may be more strongly influenced by internal firm factors, such as human resources. The slowness of changes in capital allocation is consistent with the idea of “sticky” institutions in the economic development research. This is still somewhat surprising because of the improvements in stock and equity markets, as well as strong and consistent development of commercial banks (Aziz et al., 2006). However, we find that the overall elasticity of capital is about 26 percent, implying that when sales increase 10 percent, the capital stock on average increases by only 2.6 percent.
REFERENCES
Ahluwalia, M.S. 2002. Economic Reforms in India since 1991: Has Gradualism Worked? Journal of Economic Perspectives, 16(3)3: 67-88.
Aghion, P., Burgess, R., Redding, S. and Zilibotti, F., (2006) The Unequal Effects of Liberalization: Evidence from Dismantling the License Raj in India, NBER working paper no. 12031.
Aziz, J., Dunaway, S. and Prasad, E. 2006 (Eds) China and India: Learning from
Each Other: Reforms and Policies for Sustained Growth. Washington D.C.:
International Monetary Fund.
Besley, T and Burges, R. 2004. Can Labor Regulations Hinder Economic Performance? Evidence from India. Quarterly Journal of Economics, 119(1): 91-134. Bhagwati, J. and Desai, P. 1970. India: Planning for Industrialisation. Oxford University Press: London.
Botero, J.C., Djankov, S., La Porta, R., Lopez-De-Silanes, F. and Shleifer, A. 2004. The Regulation of Labor. The Quarterly Journal of Economics, 119(4): 1339-1382. Cho, M-H. 1998. Ownership Structure, Investments, and the Corporate Value: An Empirical Analysis. Journal of Financial Economics, 47(1): 103-121.
Demsetz, H. 1983. The Structure of Ownership and the Theory of the Firm. Journal of
Law and Economics, 26: 375-390.
Demsetz, H. and Lehn, K. 1985. The Structure of Corporate Ownership: Causes and Consequences. Journal of Political Economy, 93(6): 1155-1177.
Demsetz, H. and Villalonga, B. 2001. Ownership Structure and Corporate Performance. Journal of Corporate Finance, 7: 209-233.
Denis, D. K. and McConnell. 2003. International Corporate Governance. Journal of
Financial and Quantitative Analysis, 38: 1-36.
Eklund, J.E. and Desai, S. 2008. Ownership, Economic Entrenchment and Allocation of Capital. Working paper CESIS, Royal Institute of Technology, Stockholm.
Faccio, M. and Lang L.H.P. 2002. The Ultimate Ownership of Western European Corporations. Journal of Financial Economics, 65: 365-395.
Fernandes, A. M. and Pakes, A., (2008), “Factor Utilization in Indian Manufacturing: A Look at World Bank Investment Climate Surveys Data,” NBER working paper no. 14178.
Government of India, (1991) Ministry of Industry, Statement on Industrial Policy, New Delhi, July 24, 1991.
Gugler, K., and Yurtoglu, B.B. 2003. Average q, marginal q, and the relation between ownership and performance. Economics Letters, 78: 379-384.
Hsieh,C-T. and Klenow, P. J., (2007), Misallocation and Manufacturing TFP in China and India, NBER working paper no. 13290.
Klapper, L., Laeven L. and Rajan, R. 2006. The Regulation of Entry. Journal of
Financial Economics, 82: 591-629.
Kumbhakar, S. and Sarkar, S. 2003. Deregulation, Ownership and Productivity Growth in the Banking Industry: Evidence from India. Journal of Money, Credit, and
Banking, 35: 3.
Jorgenson, D.W. 1995. Productivity. Cambridge: MIT Press.
Jorgenson, D.W. 2005. “Growth Accounting” in Agion, P. and Durlauf, S. (eds) 2005.
Handbook of Economic Growth. Elsevier: Amsterdam.
Kochhar, K., Kumar, U., Rajan, R., Subramanian, A. and Tokatlidis, I., (2006), India’s Pattern of Developmet: What Happened, What Follows, NBER working paper no. 12023.
Lange, O. 1967. Essays on Economic Planning. Indian Statistical Institute Series no. 4, Calcutta.
Manne, A.S. 1945. Some Notes on the Acceleration Principle. Review of Economic
Statistics, 27(2): 93-99.
Marglin, S.A. 1967. Public Investment Criteria - Studies in the Economic Development of India. George Allen and Unwin Ltd: London.
Morck, R., Schleifer, A. and Vishny, R. 1988. Management Ownership and Market Valuation: An Empirical Analysis. Journal of Financial Economics, 20: 293-315. Mueller, D.C. 2003. The Corporation; Investments, Mergers and Growth. Routledge: London.
Mueller, D.C. and Reardon, E.A. 1993. Rates of Return on Corporate Investment.
Southern Economic Journal, 60(2): 430-453.
OECD. 2007. OECD Economic Surveys India, Organization for Economic Co-operation and Development.
Roe, M.J. 2003. Political Determinants of Corporate Governance. Oxford University Press, Oxford.
Rosenstein-Rodan, P.N. 1964. (Ed). Capital Formation and Economic Development - Studies in the Economic Development of India. George Allen and Unwin Ltd.: London.
Sáez, L. and Yang, J. 2001. The Deregulation of State-Owned Enterprises in India and China. Comparative Economic Studies, 43: 3.
Shleifer, A. and Vishny, R.W. 1997. A Survey of Corporate Governance. Journal of
Finance, 52(2): 737-783.
Shukla, P.R., Nah, T. and Biswas, D. 2005. Electricity Reforms and Firm-level Responses: Changing Ownership, Fuel Choices and Technology Decisions.
International Journal of Global Energy Issues, 23(2-3): 260-279.
Solow, R. M. 1956. A Contribution to the Theory of Economic Growth. Quarterly
Journal of Economics, 70: 65-94.
Solow, R.M. 1957. Technical Change and the Aggregate Production Function. Review
of Economics and Statistics, 39: 312-320.
Yergin, D. and Stanislaw, J. 1998. The Commanding Heights-The Battle for the World Economy. Simon & Schuster Inc: New York.
World Bank. 2006. Doing Business: Reforms Make a Difference. World Bank, Washington D.C.
Table 1 Variables and definitions
Component Definition
Sales The sum of industrial sales and income from
non-financial services. Source: Prowess
Capital Total assets. Source: Prowess
Inflation Inflation is measured with the average consumer price
index. Source: IMF, World Economic Outlook
Database 2007.
Ownership categories
Promoters holding (%) The dominant/controlling owner. Indian law defines
promoters as the person in “control” of the company. All ownership categories are measured as percentage share of the equity capital.
Indian Promoters(%) Domestic controlling owners, Source: Prowess
Foreign Promoters(%) Foreign controlling owner, Source: Prowess
Persons acting in concert (%) - Promoters
Persons/owners acting in concert as controlling owners,
Source: Prowess
Non-promoters holding (%) Non-promoters are the shares held by non controlling
owners, i.e. dispersed ownership, Source: Prowess
Institutions (%) - Non-Promoters
Institutional non-promoters are the sum of the shares held by mutual funds, banks and foreign institutional investors. Source: Prowess
Mutual Funds / UTI (%) - Non-Promoters This category includes non-promoting mutual funds
Source: Prowess
Banks, FI's, Insurance Cos. (%) - Non-Promoters
This category include non-promoting banks, financial institutes and insurance companies.
Source: Prowess
Foreign Institutional investors (%)- Non-Promoters This category includes non-promoting foreign
institutional investors Source: Prowess
Non-institutions (%) - Non-Promoters
This category include non-promoter non-institutional investors
Source: Prowess
Corporate Bodies (%) - Non-Promoters This category include non-promoter corporate bodies
Source: Prowess
Individuals (%) - Non-Promoters This category include non-promoting individual
investors Source: Prowess
Table 2 Mean share of ownership per type of owner and per year
Average ownership per year
Type of owner 2002 2003 2004 2005 2006
Promoters holding (%) 50.62 51.80 51.23 50.32 50.40
Indian Promoters(%) 39.37 40.29 39.28 38.71 43.87
Foreign Promoters(%) 5.93 6.08 5.86 5.95 6.53
Persons acting in concert (%) – Promoters 5.32 5.44 6.09 5.66 0
Non-promoters holding (%) 49.38 48.16 48.77 49.59 49.23
Institutions (%) - Non-Promoters 6.85 6.44 6.22 6.85 7.14
Mutual Funds / UTI (%) - Non-Promoters 1.81 1.54 1.45 1.63 1.74
Banks, FI's, Insurance Cos. (%) - Non-Promoters 4.34 3.77 3.37 2.94 2.80 Foreign Institutional investors (%)- Non-Promoters 0.70 1.14 1.38 2.27 2.65
Non-institutions (%) - Non-Promoters 42.53 41.71 42.57 42.79 41.82
Corporate Bodies (%) - Non-Promoters 9.99 10.15 10.92 11.22 9.03
Individuals (%) - Non-Promoters 31.42 30.31 30.28 30.11 30.41
Table 3 Ownership and Allocation of Capital
The regressions include industry effects, time effects, time dummies and industry dummies interacted with growth in sales, and constrained to zero. * and ** indicates significance at 1 percent and 5 percent level respectively.
Regression with fixed industry and year effects, and time and industry specific elasticity’s Dependent variable: It/Kt-1
∆St/St-1 0.125* (5.73) 0.146* (7.24) 0.183* (9.78) 0.244* (11.18) 0.166* (8.82) (8.71) 0.162* 0.196* (10.47) 0.165* (8.89) 0.263* (12.57) 0.258* (12.77) 0.192* (10.10) Promoters 0.001* (5.25) Indian promoters 0.001* (4.70) Foreign promoters 0.000 (0.65) Non-promoters -0.001* (-5.25) Institutions 0.003* (6.69) Mutual funds 0.015* (10.46) Banks, FI. and
insurance com. -0.004 (10.47) Foreign Institutional 0.011* (12.85) Non-institutions -0.002* (-8.16) Individuals -0.002* (-9.24) Corporate -0.001** (-2.05) Constant 0.026* (6.74) 0.026* (6.80) 0.027* (6.85) 0.026* (6.75) 0.026* (6.71) (6.54) 0.025* 0.026* (6.75) 0.024* (6.29) 0.026* (6.61) 0.026* (6.66) 0.026* (6.81) R2 0.21 0.21 0.21 0.21 0.21 0.22 0.21 0.22 0.21 0.21 0.21 R2 adjusted 0.20 0.20 0.20 0.20 0.20 0.21 0.20 0.21 0.20 0.20 0.20 F-value 32.8 32.7 32.4 32.8 33.0 33.8 32.9 34.5 33.3 33.5 32.5 No. observations 12423 12423 12423 12423 12423 12423 12423 12423 12423 12423 12423
Marginal effects evaluated at mean
Table 4 Industry specific elasticity’s
* indicates significance at 5 percent. The industry elasticity’s have been estimated with industry and year fixed effect. To obtain the industry specific elasticity’s ∆St/St-1 has been interacted with industry dummies and constrained to sum to zero.
Industry Industry
code16
Elasticity t-value No. observations Overall elasticity of capital (all industry weighted average) 0.225* 4.55 45443
1 Agriculture, hunting and related service activities 1 0.156 -1.28 469
2 Forestry, logging and related services 2 1.985 0.84 2
3 Mining of coal, lignite and extraction of peat 10 0.304 0.70 140
4 Extraction of crude petroleum, natural gas and incidental activities 11 0.196 -0.48 131
5 Mining of uranium and thorium 12 0.489 0.49 11
6 Mining of metal ores 13 0.199 -0.40 154
7 Other mining and quarrying 14 0.087* -2.52 463
8 Manufacturing of food and beverages 15 0.135* -1.80 4060
9 Manufacture of tobacco products 16 0.364 1.52 114
10 Manufacturing of textiles 17 0.172 -1.06 3574
11 Manufacture of wearing, dressing and dyeing of fur 18 0.217 -0.15 423
12 Tanning and dressing of leather, saddler et cetera 19 0.165 -1.03 305
13 Manufacture of wood, cork, straw and plating material 20 0.151 -1.03 165
14 Manufacture of paper and paper products 21 0.143 -1.55 1057
15 Publish and printing 22 0.302 1.20 293
16 Manufacture of coke, refined petroleum and nuclear fuel 23 0.219 -0.11 385
17 Manufacture of chemicals and chemical products 24 0.185 -0.81 7549
18 Manufacture of rubber and plastic products 25 0.181 -0.87 2266
19 Manufacture of non-metallic mineral products 26 0.096* -2.50 1631
20 Manufacture of basic metals 27 0.206 -0.38 3027
21Manufacture of fabricated metal, except machinery and equipment 28 0.207 -0.35 897
22 Manufacture of machinery and equipment N.E.C.* 29 0.195 -0.59 2568
23 Manufacturing of office, accounting and computing machinery 30 0.262 0.65 254
24 Manufacturing of electrical machinery and apparatus N.E.C.* 31 0.218 -0.13 1387
25 Manufacturing of radio, television and communication apparatus 32 0.178 -0.89 901
26 Manufacturing of medical, precision and optical instruments, clocks and
watches 33 0.234 0.17 379
27 Manufacture of motor vehicles, trailers and semi-trailers 34 0.286 1.19 2052
28 Manufacture of other transport equipment 35 0.156 -1.20 330
29 Manufacture of furniture; manufacturing N.E.C.* 36 0.203 -0.40 491
30 Electricity, gas, steam and hot water supply 40 0.121* -1.88 443
31 Construction 45 0.186 -0.76 1304
32 Sale, maintenance and repair of motor vehicles and motorcycles 50 -0.407 -1.14 6
33 Wholesale trade and commission trade except motor vehicles 51 0.166 -1.17 3176
34 Retail trade and repair of personal and household goods 52 0.281 0.78 57
35 Hotels and restaurants 55 0.092* -2.47 793
36 Land transport; transport via pipelines 60 0.333* 1.70 263
37 Water transport 61 0.205 -0.32 233
38 Air transport 62 0.312 1.02 75
39 Supporting and auxiliary transport activities 63 0.162 -1.01 189
40 Post and telecommunication 64 0.209 -0.29 246
41 Real estate activities 70 0.194 -0.49 150
42 Renting of machinery and equipment without operator 71 0.364* 1.82 48
43 Computer and related activities 72 0.251 0.51 1460
44 Research and development 73 0.053 -1.33 9
45 Other business activities 74 0.143 -1.43 255
46 Education 80 -0.141* -2.62 19
47 Health and social work 85 0.149 -1.22 229
48 Activities of membership organizations N.E.C.* 91 0.163 -0.60 21
49 Recreational, cultural and sporting activities 92 0.191 -0.63 334
50Undifferentiated service-producing activities 97 0.122 -1.28 40
51Diversified 98 0.219 -0.11 614
Table 5Elasticity of capital and yearly deviations from the overall elasticity of capital.
Includes fixed industry and time effects (not reported). Year dummies interacted with growth in sales. ∆St/St-1 0.182* (58.84) 1992 0.010 (0.48) 1993 0.006 (0.37) 1994 0.039* (2.97) 1995 0.034* (3.04) 1996 -0.015 (-1.61) 1997 -0.030* (-2.99) 1998 -0.025** (2.46) 1999 -0.013 (-1.29) 2000 -0.009 (-0.99) 2001 -0.016*** (-1.80) 2002 -0.014 (-1.51) 2003 -0.018** (-1.97) 2004 0.013 (1.48) 2005 0.020** (2.28) 2006 0.020** (2.09) Constant 0.004 (1.13) R2 0.22 R2 adjusted 0.22 F-value 164.7 No. observations 45443
Appendix 1 Summary statistics, ownership 2002 - 2006
Type of owner Obs Mean Std. Dev. Min Max
Promoters holding (%) 12 423 50.66 19.53 0 100
Indian Promoters(%) 12 423 39.94 23.15 0 100
Foreign Promoters(%) 12 423 6.11 16.81 0 97.45
Persons acting in concert (%) - Promoters 12 423 4.61 11.61 0 98.44
Non-promoters holding (%) 12 423 49.26 19.51 0 100
Institutions (%) - Non-Promoters 12 423 6.87 10.21 0 82.43
Mutual Funds / UTI (%) - Non-Promoters 12 423 1.71 3.52 0 35.41
Banks, FI's, Insurance Cos. (%) - Non-Promoters 12 423 3.63 6.65 0 30.63
Foreign Institutional Investors (%) -
Non-Promoters 12 423 1.50 4.63 0 56.59
Other Institutions (%) - Non-Promoters 12 423 0.02 0.63 0 47.53
Non-institutions (%) - Non-Promoters 12 423 42.39 20.24 0 100
Corporate Bodies (%) - Non-Promoters 12 423 10.28 11.21 0 99.29
Individuals (%) - Non-Promoters 12 423 30.66 17.11 0 99.81
Appendix 2 Correlations
* Correlation is significant at the 5 percent level
Promoters holding Non-promoters holding
SALE assets Total ∆St/St-1 It/Kt-1
Promoters
holding Promoters Indian Promoters Foreign promoters Non- Institutions Mutual Funds
Banks, FI's, Insurance Foreign Institution al
Investors institutions Non- Corporate Bodies
SALE 1 Total assets 0.71* 1 Growth in Sales, ∆St/St-1 0.01* 0.00 1 Investment ratio, It/Kt-1 0.02* 0.01* 0.40* 1 Promoters holding 0.05* 0.05* 0.01 0.07* 1 Indian Promoters 0.05* 0.06* 0.01 0.07* 0.60* 1 Foreign Promoters -0.00 -0.01 0.01 0.02* 0.28* -0.43* 1 Non-promoters holding -0.05* -0.05* -0.01 -0.07* -1* -0.60* -0.28* 1 Institutions - Non-Promoter 0.15* 0.18* 0.03* 0.05* -0.19* -0.16* 0.03* 0.19* 1
Mutual Funds / UTI
Non-Promoters 0.07* 0.08* 0.03* 0.07* -0.11* -0.11* 0.07* 0.11* 0.63* 1
Banks, FI's, Insurance Cos.
Non-Promoters 0.07* 0.08 -0.06* -0.11* -0.16* -0.13* -0.00 0.16* 0.73* 0.24* 1
Foreign Institutional Investors
Non-Promoters 0.17* 0.21 0.11* 0.21* -0.11* -0.08* 0.02* 0.10* 0.61* 0.29* 0.07* 1
institutions
Non-Promoters -0.12* -0.14* -0.03 -0.10* -0.86* -0.50* -0.29* 0.87* -0.32* -0.22* -0.23* -0.20* 1
Corporate Bodies -
Non-Promoters -0.05* -0.06* 0.02* 0.01 -0.48* -0.28* -0.15* 0.48* -0.11* -0.08* -0.08* -0.06* 0.52* 1