See discussions, stats, and author profiles for this publication at: https://www.researchgate.net/publication/312049571
Modeling Small-Angle X-Ray Scattering Data
for Low Density Lipoproteins – Insights Into
The Fatty Core Phase Packing And...
Article in ACS Nano · January 2017 DOI: 10.1021/acsnano.6b08089 CITATIONS0
READS37
5 authors, including: Some of the authors of this publication are also working on these related projects: PhD project: Complexes of proteins and lipids View project Salivary films structure and properties View project Selma Maric Karolinska Institutet 9 PUBLICATIONS 49 CITATIONS SEE PROFILE Tania Lind Malmö University 11 PUBLICATIONS 91 CITATIONS SEE PROFILE Marité Cárdenas Malmö University 68 PUBLICATIONS 941 CITATIONS SEE PROFILE Jan Skov Pedersen Aarhus University 403 PUBLICATIONS 12,644 CITATIONS SEE PROFILEAll content following this page was uploaded by Tania Lind on 27 March 2017.
Modeling Small-Angle X‑ray Scattering Data
for Low-Density Lipoproteins: Insights into the
Fatty Core Packing and Phase Transition
Selma Maric,
†Tania Kjellerup Lind,
†Jeppe Lyngsø,
‡Marité Cárdenas,
*
,†and Jan Skov Pedersen
*
,‡ †Biofilms- Research Center for Biointerfaces, Dept. of Biomedical Science, Faculty of Health and Society, Malmö University, Malmö20506, Sweden
‡Interdisciplinary Nanoscience Center (iNANO) and Department of Chemistry, Aarhus University, 8000 Aarhus, Denmark
*
S Supporting InformationABSTRACT: Atherosclerosis and its clinical consequences are the leading cause of death in the western hemisphere. While many studies throughout the last decades have aimed at understanding the disease, the clinical markers in use today still fail to accurately predict the risks. The role of the current main clinical indicator, low density lipoprotein (LDL), in depositing fat to the vessel wall is believed to be the onset of the process. However, many subfractions of the LDL, which differ both in structure and composition, are present in the blood and among different individuals. Understanding the relationship between LDL structure and composition is key to unravel the specific role of various LDL components in the development and/or prevention of atherosclerosis. Here, we describe a model for analyzing small-angle X-ray scattering data
for rapid and robust structure determination for the LDL. The model not only gives the overall structure but also the particular internal layering of the fats inside the LDL core. Thus, the melting of the LDL can be followed in situ as a function of temperature for samples extracted from healthy human patients and purified using a double protocol based on ultracentrifugation and size-exclusion chromatography. The model provides information on: (i) the particle-specific melting temperature of the core lipids, (ii) the structural organization of the core fats inside the LDL, (iii) the overall shape of the particle, and (iv) the flexibility and overall conformation of the outer protein/hydrophilic layer at a given temperature as governed by the organization of the core. The advantage of this method over other techniques such as cryo-TEM is the possibility of in situ experiments under near-physiological conditions which can be performed relatively fast (minutes at home source, seconds at synchrotron). This approach now allows the monitoring of structural changes in the LDL upon different stresses from the environment, such as changes in temperature, oxidation, or external agents used or currently in development against atherosclerotic plaque build-up and which are targeting the LDL.
KEYWORDS: low-density lipoprotein, small-angle X-ray scattering, cholesteryl ester packing
I
n westernized societies, atherosclerosis and its clinical consequences (cardiovascular diseases, CVD) constitute the leading cause of death.1In atherosclerosis, plaques of lipids and fibrous elements accumulate in the arteries, leading to heart disease and stroke.1 One of the main blood clinical indicators in use today and the main target of therapy for the prevention of CVD is low-density lipoprotein (LDL).2,3Even though there is well-established evidence for LDL involvement in atherosclerotic plaque build-up, it is clear that many different factors influence its atherogenecity.3 For example, it is widely accepted that different forms of LDL, including small dense LDL and oxidized LDL, promote atherosclerosis,2and thus, it is not surprising that measurements of total plasma LDL andcholesterol concentrations often fail to predict the risks for CVD.3,4 Detailed understanding of the LDL particle structure specifically related to its chemical composition is necessary to better evaluate the atherogenic capacity of various LDL subfractions and further develop robust and standardized methods for both diagnostics and therapeutic approaches against CVD.
LDL is a macromolecular complex of both proteins and fats: lipids, triglycerides, and sterols.3,4 Such complex multi-Received: December 2, 2016
Accepted: January 3, 2017 Published: January 3, 2017
Article
component biomolecular assemblies are some of the most challenging systems with regard to structural studies. The particles’ inherent heterogeneity has made crystallization extremely challenging, and while several attempts have led to diffracting crystals, a high-resolution structure of the LDL is yet to be reported.5−7 Instead, solution small-angle scattering (SAS) using both X-rays (SAXS) and neutrons (SANS) has been considered a useful tool for investigating the structure of the LDL.8−14 Despite their inherent orientational averaging, SAXS and SANS have been able to provide important structural information not only on the overall shape and size of the particles but also on the lipid packing inside the particle core.10,15,16The SAS models applied in the literature assumed a spherical centrosymmetry, following the many oscillations in the LDL SAXS data, which are usually only observed in cases with such symmetry. These early models have been strengthened by data obtained through electron microscopy (EM), NMR spectroscopy, differential scanning calorimetry (DSC), IR spectroscopy, and fluorescence spectroscopy, leading to a structural model of the LDL which has been widely accepted across the scientific community: a globular core−shell particle composed of a monolayer of phospholipids and the apolipoprotein ApoB-100 surrounding a cholesteryl ester and triglyceride core.15,17
Early studies using techniques such as DSC, and supported by SAXS and SANS, showed that the cholesteryl esters inside the particle core undergo a temperature-induced transition state between 20 and 40 °C, which varies considerably for LDL particles obtained from different individuals.14,16 Below the transition temperature, the cholesteryl esters were shown to be in a liquid−crystalline arrangement and thought to be forming concentric layers, while a more disordered liquid-like state at physiological temperature was assumed.16 This ordered arrangement of the core lipids, thought to be composition dependent (triglyceride content), has been shown to have a positive effect on LDL particles’ resistance to oxidation18and thus should have an impact on atherogenesis.
Over the past decade, the advancement of cryo-TEM revealed that LDL has rather an ellipsoidal shape with cylindrical lamellar layering of cholesteryl esters inside the particle core.19These findings were used in the present work as a base for the development of a model for the analysis of experimental SAXS data for LDL, which in contrast to previous models does not have spherical centrosymmetry. The model allows in situ determination of the structure of LDL particles, including the internal organization, and it provides an easy approach for following the variation of the structure when varying, e.g., temperature.
Although it is possible to calculate radial electron density profiles from the TEM micrographs20,21and also to calculate SAXS profiles from them, the results are only obtained after tedious data treatment with alignment, averaging, and filtering. In addition, the underfocusing usually applied in TEM and the selection of a threshold level can lead to some uncertainty in, e.g., size estimates. Moreover, the quenching speed of the cooling of the sample may influence the results, making high temperature state investigations challenging.19 Here, SAXS offers an important complementary alternative for characteriz-ing the structures in situ. With the structural features of the particles known from cryo-TEM, a parametric structural model as derived here can be least-squares fitted to experimental SAXS data providing a set of structural parameter values that describe the overall size of the particle and the internal arrangement of
the particle core. The latter is of particular importance due to the current discrepancies with respect to the possible existence of an intermediate state even though a clear layering of the cholesteryl esters is present at low temperatures that disappears at high temperatures.20,21
The model presented here describes the overall structure/ shape of the LDL while it gives insights into the lamellar inner packing of the cholesteryl esters and triglycerides in addition to providing the transition temperature as confirmed by DSC data. The model was successfully applied to SAXS data obtained on native LDL particles extracted and purified from human blood of three healthy males (pooled samples). The methodology established here together with detailed compositional analysis (i.e., proteonomics and lipidomics) can in the future be applied for systematic structural studies of various types of LDL subfractions, coming from larger populations, thus enabling comparisons between different risk groups.
RESULTS
LDL Composition and Heterogeneity. Human LDL are typically isolated through density gradient ultracentrifugation and include particles with densities between 1.019 and 1.050 g/ mL.22In this study, LDL was purified from the plasma of three healthy male volunteers and pooled after density gradient ultracentrifugation. The LDL fractions obtained through the same purification procedure but at two separate occasions and from different donors were further purified by size-exclusion chromatography (Supplementary Figure 1). These data showed the presence of three different populations: (1) very large particles eluting in the void volume of the column assigned to very-low density lipoprotein (vLDL) with a retention time (tR) of 20 min, (2) medium-sized particles assigned to LDL eluting at 25 min, and (3) smaller particles assigned to high-density lipoprotein (HDL) eluting after 30 min. The assignments were done in accordance with previous studies23 and confirmed through proteomic analysis (data not shown) of each of the peaks that confirmed the main presence of apoB-100 in the LDL fraction subsequently chosen for this study ( Supple-mentary Figure 1). Mass spectrometry of the protein content also showed large amounts of human serum albumin in addition to HDL with Apo-AI as the main apolipoprotein present in the peak eluting at tR= 35 min. The concentration of the total protein for LDL was determined by the Bradford method,24 while the different fat components of LDL were analyzed enzymatically and the relative concentrations of protein, total cholesterol, triglycerides, and phospholipids are summarized inSupplementary Table 1. For reliable structural analysis using SAS, ensuring samples of high purity is necessary to minimize polydispersity. With that in mind, and after comparison with SAXS data for crude LDL after ultra-centrifugation without further purification (Supplementary Figure S2), all structural data used for modeling were collected only on the SEC fractions corresponding to the size of the LDL and containing ApoB-100 as the main protein component. By a comparison to the results of Chapman et al.4 of different fractions of LDL obtained by analytical ultracentrifugation, the samples were expected to have a size polydispersity in the outer radius of less than 10%.
Structural Characterization of LDL. The recent TEM studies19revealed a particle shape that is neither spherical nor ellipsoidal but more like a cylindrical structure with rounded edges and corners. Therefore, the model derived in this study was based on a super ellipsoid25since it allowed more variation
of the particle form than an ellipsoid in the direction of the observed form. More specifically, an oblate super ellipsoid of revolution was used with a radius at equator, R, the half-height of the ellipsoid, εR, where ε is defined as eccentricity, and the shape exponent t which is defined as the particles super-ellipticity.Figure 1a illustrates a super ellipsoid with t = 3. A
usual ellipsoid of revolution is obtained for t = 2 and a super ellipsoid of revolution approaches a cylinder for t =∞.Figure 1b shows the cross-section structure of the LDL model where apolipoprotein and phospholipid head groups constitute the outer layer, the so-called hydrophilic shell, while cholesteryl esters are integrated as cylindrical disk layers within the core of the particle as shown by TEM.19,21,26The other components of the core are the cholesterol, the triglycerides, and the tails of the phospholipids.
The model involves a relatively large set of parameters, and in order to get unique and reasonable fits, several assumptions were imposed in the modeling: (1) Due to the narrow LDL size fraction used in the present work, the model was restricted to LDL particles containing only three layers. (2) The thickness of the hydrophilic shell (protein and lipid head groups) was constrained to 25 Å below the expected melting temperature (Tm), as a reasonable approximation of the size of the domains of the ApoB-100.19,21,27−29(3) A layer Dcbetween the particle core and the protein shell of approximately 5 Å was added, as such a separation is observed in TEM images. (4) The extra scattering contrast for cholesteryl ester layers was allowed to vary at low temperature but was set to zero for the highest temperatures when it converged to zero (within error) in the fits. This gave the appropriate description of a more disordered system at high temperature and resulted in the disappearance of the maxima at q = 0.17 Å−1, where q is the modulus of the scattering vector.
The experimental SAXS data for LDL at different temper-atures are shown inFigure 2a. Clear minima and maxima that extend out to rather large scattering vectors were observed at all temperatures. This supports the expectation that the size polydispersity in the sample was relatively low. Upon increased temperature, a clear shift in the periodicity of the oscillations was observed between q = 0.015 Å−1and q = 0.025 Å−1toward smaller q values, indicating that changes in both size and shape took place (Figure 3). In addition, the Bragg peak with maxima at q = 0.17 Å−1, attributed to the layering of cholesteryl
esters,19,30 dramatically decreased in intensity when the temperature increased from 5 to 40 °C.
The fitting of the layered superellipsoid was performed from low to high temperatures, and the best fits are presented in
Figure 2b. For the experimental data collected above the expected Tm, the superellipsoid model had too many degrees of freedom. Hence, the model needed to be adjusted for the three highest temperatures to incorporate the expected physical changes within the particle core, i.e., allow a more disordered system devoid of the cholesteryl esters layers. It also became clear that the thickness constraint for the hydrophilic shell of 25 Å (protein and headgroup layer) did not hold at temperatures above the expected Tm. Instead, free fitting of this parameter led to a thickness of ∼46 Å, suggesting that the flexibility of the protein could be dependent on the disorganization of the LDL core in addition to temperature. Note that including a layer Dc of ∼5 Å between the cholesteryl ester particle core and the protein shell below Tm improved the fits in the oscillation Figure 1. (a) Illustration of a super ellipsoid with ellipticity or
shape exponent t = 3. The symmetry axis goes vertically through the center, while the size and the shape are given by the radius at equator, R, the half-height of the ellipsoid, εR, and the shape exponent t. (b) Illustration of a super ellipsoid with a shape component t = 3 including three ordered layers of cholesterol esters (cyan) inside the hydrophobic core (blue) of the LDL particle. The protein and phospholipid head groups in the outer shell are illustrated in red.
Figure 2. (a) SAXS intensity profiles for LDL purified from human serum with increasing temperature (increasing red tone). (b) SAXS intensity profiles for LDL purified from human serum with increasing temperature (open circles) with corresponding fits based on the model for a layered superellipsoid (red lines). The samples were measured in 25 mM Tris buffer, 150 mM NaCl, 0.5 mM EDTA, after size-exclusion chromatography at a concentration of 0.4 mg/mL apolipoprotein (Supplementary Figure S1). The relative concentrations of the fat components in LDL are listed in
Supplementary Table 1. I(q), SAXS intensity; q, momentum transfer modulus.
occurring at the middle q range, suggesting the presence of a short phospholipid region that is not as mobile as the rest of the lipid core. This is expected as the headgroup packing imposes a restriction on the packing/mobility of the phospholipid tails.
Moreover, the apolipoprotein could adopt a different configuration in contact with the lipoprotein particle core, thus giving rise to the thin extra shell layer. Additionally, restricting the model to an LDL containing only three cholesteryl ester layers was sufficient to reproduce the experimental data, obtaining a “goodness of fit” (χ2) of two or below (Table 1).
The model parameters describing the overall size and shape obtained from the best fits to the SAXS data are summarized in
Figure 3: with radius (Figure 3a), eccentricity (Figure 3b), and superellipticity (Figure 3c). At 5 °C, the LDL particles displayed a radius of ∼125 Å, a half-height, εR, of ∼90 Å, and a superellipticity of∼3 resulting in a flattened ellipsoid with the overall dimensions of∼250 Å × ∼250 Å × ∼182 Å. This is in very close agreement with the LDL dimensions obtained through cryo-TEM at temperatures below LDL Tm,20,26 particularly considering the extent of LDL composition variation among different preparations/individuals.4
Above the expected Tm, the LDL showed an increase in outer particle radius, and the eccentricity term reached unity while the superellipticity decreased, resulting in a completely spherical particle with a diameter of∼262 Å. While this falls slightly out of the defined LDL size range (180−250 Å)14the obtained diameter is reasonable, well within the limits of the technique, and presents an improvement when compared with previous SAXS-based models. These previous models showed LDL particles with diameters of >300 Å. Such overestimation of the LDL size could also be explained by the presence of larger vLDL particles after ultracentrifugation30in the samples used for SAXS. Indeed, SAXS curves obtained from different LDL preparations before and after SEC clearly showed differences in size as well as shape of the particles that could, after further analysis, be assigned to the presence of other common blood components and simply result from insufficient lipoprotein purification (Supplementary Figure S2).
The change in the particles superellipticity and eccentricity, which shows that the LDL morphs from an ellipsoid to a sphere with increasing temperature, is reversible, although the shape is slightly different in overall dimensions (the radius becomes smaller, whereas the dimension in the perpendicular direction increases slightly). Consequently, the LDL undergoes a change from a sphere back to a slightly flattened shape upon cooling from 40 to 5 °C (Figure 3c). This specific flattening of the particles was originally thought to just be an artifact of the LDL Figure 3. LDL particle structure as a function of temperature upon
heating (open circles) and after cooling (closed circles): (a) LDL radius, R (open circles), and εR (red filled circles); (b) eccentricity, ε; (c) shape component, t, for the particles; (d) the cholesterol ester thickness, T; and (e) excess contrast of cholesterol ester layers,Δρc.
Table 1. Fitting Parameters for SAXS Profiles of LDL Particles
T (°C) shell layer thickness Dshell Δρcore CE thickness T CE layer distance d Δρc goodness of fit χ2
5 25 −1.96 ± 0.08 15 ± 2 36.7 ± 0.1 3.8 ± 0.2 2.24 10 25 −2.04 ± 0.09 16 ± 2 36.7 ± 0.1 3.8 ± 0.2 2.26 15 25 −2.07 ± 0.09 17 ± 2 36.7 ± 0.1 3.5 ± 0.1 2.21 20 25 −2.07 ± 0.06 17 ± 1 35.2 ± 0.1 3.15 ± 0.06 2.01 25 25 −1.77 ± 0.05 14 ± 1 35.0 ± 0.1 3.0 ± 0.2 2.10 30 25 −1.57 ± 0.05 11 ± 2 35.3 ± 0.2 3.0 ± 0.5 2.42 35 46.1 ± 0.4 −2.01 ± 0.02 − − 0a 1.05 37 46.5 ± 0.4 −2.05 ± 0.02 − − 0a 0.99 40 45.8 ± 0.4 −2.07 ± 0.02 − − 0a 0.87 5 25 −2.23 ± 0.07 19.4 ± 0.8 36.0 ± 0.1 3.45 ± 0.03 1.92
aParameter was fixed to zero as it converged to this value during the fitting and the corresponding peak disappeared. “− “ indicates the parameter is
not applicable as the electron density of the layers is fixed to zero. The rows indicated in boldface mark the melting of the core, where the scattering contrasts as well as the CE thickness and layer distance decrease. All dimensions are given in Angstroms. The excess scattering length densityΔρcore of the hydrocarbon core and the extra scattering of the layersΔρc(cholesterol part of cholesteryl esters) are taken relative to that of the shell.
particles’ interaction with the EM grid.31 However, such flattening depends on the crystallinity of the core lipids and thus on the specific core composition.19,20,26,32,33
Fatty Core Phase Transition and Cholesteryl Ester Packing. The inner layering of the cholesteryl esters in the LDL core is described by the layer thickness T, the layer distance d, and the extra scattering contrast defined asΔρc. The latter parameter is defined as “extra”, meaning on top of the core excess contrast of all hydrocarbons inside the particle core; thus, the higher the contrast the better defined the layering of the core. This comes from the higher electron density of the sterol part of the cholesteryl ester compared to that of the alkyl chains and triglycerides. The parameters representing the cholesteryl ester packing obtained through model fitting are summarized inTable 1andFigure 3d,e. The interlayer distance of 36.7 Å at low temperatures (5−15 °C) is in very good agreement with the dimensions that have previously been determined for LDL cholesteryl esters at low temperature as well as for extracted cholesteryl esters in the smectic phase.10,34,35Moreover,Δρc started to decrease at 15 °C as a result of the onset of the melting of the crystalline core. Free fitting of all three parameters representing the cholesteryl ester layering resulted in a successive decrease of both the Δρc (Figure 3e) and the cholesteryl ester thickness between 15 and 30 °C (Figure 3d). At 35 °C and temperatures above, the layered model resulted in an insignificant scattering contrast for the cholesteryl esters layering and was therefore omitted from the model (Table 1). The “disappearance” of the layered structure at 35 °C and above showed that the cholesteryl esters had transitioned from a smectic to a nematic phase or an isotropic distribution at higher temperatures. The parameter Δρcore is the excess scattering length density of the (hydro-carbon) core taken relative to that of the outer shell (which was correspondingly fixed at 1.0 as the modeling was done on a relative intensity scale). The results inTable 1show that this parameter decreased in the temperature range 15−30 °C, where the inner layering disappeared. As the layers were defined relative to the electron density of the hydrocarbons and triglyceride (Δρcis positive), this was in perfect agreement with a higher electron density being distributed more evenly in the core. At 35 °C and above, the shell that should contain the hydrophilic components (lipid head groups and protein) nearly doubled in width (from 25 to ∼46 Å). This means that the quite flexible apolipoprotein31,36−38must indeed be distributed within the shell. Due to the much larger volume of the shell at high temperature, the protein concentration is decreased, and the scattering length density of the shell is greatly reduced. As the core excess scattering length was taken relative to the scattering length density of the shell (which was kept constant in the model), this led to the increase ofΔρcore. Taken together, these data indicate that the LDL core had fully melted at 35 °C and that this was accompanied by an increase in flexibility of the protein in the outer shell. The observation of a thicker outer shell is in good agreement with the cryo-TEM pictures in Figure 1 of Kumar et al.21
The phase transition temperature for this LDL preparation was obtained in parallel through DSC, and the particle heat capacity (Cp) as a function of temperature is shown inFigure 4. Pure LDL was heated from 5 to 45 °C and showed a clear peak starting just above 15 °C and ending at 35 °C. This is in perfect agreement with the transition temperature obtained by the modeling of the SAXS data (Figure 3). The peak was also present upon reheating of the sample after cooling to 5 °C, thus
showing that the melting of the LDL was fully reversible. Such reversible thermal transition that occurs near physiological temperature in LDL was attributed to the layering of cholesteryl esters already in 1975 by Deckelbaum et al.16,34 The physiological relevance of this transition temperature has never been fully understood,19,39 even though it has been suggested to play a role in the progression of atherosclerosis; there is, e.g., a lower susceptibility to oxidation when the lipids are packed in a crystalline state.18 Our study shows that the fatty core of this LDL preparation melted between 15 and 35 °C. For an LDL preparation with a concentration of triglycerides in the normal range as in this case (Supplementary Table 1), the obtained onset of the melting temperature of 15 °C agrees fully with previous data on the correlation between triglyceride content and the LDL Tm.16
In order to investigate the variation and conservation of volumes and core−shell interface upon the shape transition from a super ellipsoid toward a sphere (schematically shown in
Figure 5), we calculated the volume and scattering mass (the scattering mass is the product of volume and excess scattering length) of the core and shell as well as the core−shell interface area as a function of temperature.Figure 6a shows that the core volume decreased (22%), whereas the shell volume increased by as much as 78%. This is in agreement with the protein becoming much more disordered above the transition, so that some of it leaves the surface of the particles. The ApoB-100 has a molecular mass of 550 kDa,38 and with a partial specific volume of 0.70 mL/g, the volume of a single molecule is 0.64 × 10⁶Å3. This means that at low temperature only about 20% of the total shell volume is the protein, whereas it is reduced to about 10% at high temperature. Moreover, the surface area decreased above the phase transition; seeFigure 6b. Indeed, a simple calculation shows that a 25 Å thick ApoB-100 layer covers about half of the surface at low temperature. Assuming that the core consists of cholesterol, cholesteryl esters, triglycerides, and the tails of the phospholipids, and using the mass fraction of the latter, the phospholipids can be calculated to cover the rest of the surface assuming a surface area per molecule of 65 Å2for fluid phase at low temperature.40Thus, these results agree well with the high flexibility of ApoB-10041 and with our conclusion for a more disordered protein Figure 4. Heat capacity (Cp) as a function of temperature for LDL. The sample was equilibrated for 30 min at 5 °C and heated to 45 °C (solid line), and the heating process was repeated (dotted line) after the LDL sample was cooled back to 5 °C. The reversible phase transition is indicated with arrows between 15 and 35 °C.
configuration that partly leaves the particle surface and protrudes toward the solution at high temperatures.
The results for the scattering masses of the various components of the particles are displayed inFigure 6c, showing a clear decrease of the scattering mass of the shell at high temperature. This means that some of the protein is actually intermixed with the core and contributes with a positive scattering length density to it and that the extent of intermixing depends on the protein configuration within the shell and thus the temperature. This is in agreement with the core-scattering mass becoming less negative at high temperature, with a change that almost exactly matches the decrease in the shell-scattering mass. Note that the overall scattering mass is the sum of the two large positive (shell) and negative (core) scattering masses that nearly cancel each other, and thus, a small change in one or both contributions can lead to a large overall change. Such a change, and the corresponding change in the forward scattering I(q = 0), is due to a difference in temperature dependence of the component volumes of the LDL particles. The change in the volumes and the redistribution of the components also leads to a shift of the first minimum and maximum of the form factor (Figure 2a).
As mentioned previously, although the particles are expected to have less than 10% polydispersity in outer radius, other variations in structure are possible, for example, that the particles are nonperfect super ellipsoids of resolution with some eccentricity around the symmetry axis or that the protein is nonuniformly distributed within the shell. The fluctuation term that is added to particle scattering (see the Methods for a detailed description of the model andFigure 7) is expected to describe the scattering from such variations and deviations, and this was the reason for including the term. However, in order to check the possible influence of the effects, a series of calculations were performed for the model without inclusion of the fluctuation term. The models are described in theSI, and the model curves obtained after fitting to the 5 °C SAXS data are shown inFigure 7, where the fit of the original model is also shown. For the original model without the fluctuation term (curve not shown), the first minimum in the form factor is very
pronounced due to the near-spherical symmetry of the particles with a constant shell thickness. When an elliptical cross-section is introduced in the model (Figure 7) there is relatively little influence on the curve at the first minimum in the form factor. The belt model influences the minimum much more; however, there is more oscillation throughout the q range and the curve also deviates from the original at the position of the peak that originates from the layering. The curve for the polydisperse model almost perfectly fits with the original model except at very high q where the more gradual, power-law like decay of the original model (and the measured SAXS data) is not reproduced. The optimized model parameters for these alternative models are given in Table 2. The conclusions from the calculations are that all three effects influence the model curve and are probably present in the particle structure. However, the polydispersity alone can almost perfectly account for the smearing of the curve at the first form factor minimum. Therefore, the original model with the fluctuation term can describe all of these structural effects, which are in fact impossible to distinguish from each other. Moreover, with the already relatively large number of parameters in the original Figure 5. Schematic representation of the LDL particle structure
shown as cuts through the particles. Cuts at the center perpendicular to the cylindrical symmetry axis (top) and cuts at the center containing the cylindrical symmetry axis (bottom) are shown at different temperatures from left to right: 5, 20, 30, and 40 °C. The structures were made by generating points in agreement with the various structural constraints by Monte Carlo methods42
and plotted using PyMOL (PyMOL Molecular Graphics System, Version 1.8, Schrödinger, LLC.), placing atoms/spheres of different colors, depending on the component, at the positions of the points. The van der Waal radius was chosen as 4 Å. Protein and phospholipid head groups are shown in red, cholesterol esters in cyan, and hydrocarbon in blue. The cut structure for the highest temperature is in the lower panel shown in a tilted perspective.
Figure 6. (a) Volume of shell (red filled circles) and core (blue filled circles) as a function of temperature. (b) Area of core−shell interface as a function of temperature. (c) Scattering mass of shell (red filled circles), core (blue filled circles), layers (green filled circles), nonlayer hydrocarbon part of core (black filled circles), and total scattering mass (yellow filled circles.).
model, it seems meaningless to include even more parameters with the information content of the experimental SAXS data.
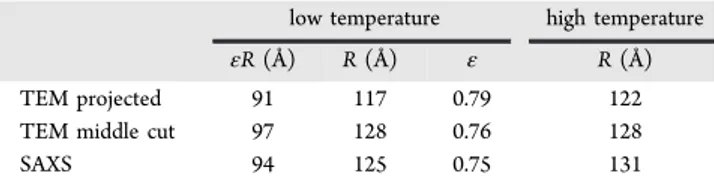
The SAXS values hereby reported on dimensions and shape can be compared to the published cryo-TEM results by Kumar et al.21Although there are several recent publications dealing with TEM images of LDL, this study was chosen as their temperature quenches are probably the most reliable; e.g., no traces of the ordered layer structure for the samples quenched from high temperature can be found. In order to obtain quantitative results from TEM, the micrographs of Kumar et al.,
Figure 2 and 4, respectively, representing the projected and center cuts of the particles were analyzed (see the description in theMethods). For the projected structure, the low-temperature data gave dimensions of 91 Å in the layer direction and 117 Å in the direction parallel to the layers, resulting in ε = 0.79. For the cut at the center, slightly larger values of, respectively, 97 and 128 Å with ε = 0.76 were determined. The corresponding values from the SAXS modeling are 94 and 125 Å, and ε = 0.75.
Thus, there is very good agreement between cryo-TEM and the SAXS results at low temperature.
The high temperature values for the outer radius of the projected and the cut through the structure are, respectively, 122 and 128 Å, compared to the value of 131 Å from SAXS. Note that for the projected and center cut there was an increase in radius of 4−5 Å in the largest radius along the layers upon increasing the temperature. This increase in radius was 6 Å for the SAXS model fitting. Overall, there is very good agreement between the SAXS obtained parameters and the cryo-TEM results of Kumar et al. (Table 3).
In summary, the structural changes derived from the model fitting, illustrated inFigure 5, show that LDL overall shape, in terms of eccentricity and size, changes only upon complete melting of the LDL core, i.e., above Tm. Interestingly, our data show that not only the superellipticity but also other parameters such as the thickness of the hydrophilic shell (the protein layer) are governed by the crystallinity of the inner core. This can be correlated with the higher motion of molecules in a more disordered system. The thickness of the hydrophilic shell almost doubles in size at temperatures above Tm, suggesting that even the flexibility of the protein is dependent on the organization of the LDL core. The structural arrangement of the protein is of high importance as even subtle conformational changes in ApoB-100 were shown to have vast implications on the apolipoproteins’ affinity for the cellular LDL receptor and can result in lower LDL removal rates, thus promoting plaque build-up.43
It is widely accepted that lipoproteins containing ApoB-100 tend to promote atherosclerosis2 and that their atherogenic capacity is composition/structure dependent. However, with the wide composition and size distribution associated with the LDL, several precautions are necessary when performing SAS experiments. Ensuring samples of high purity is crucial in order Figure 7. Test of three models with deviations from the perfect
symmetry of the original model with fluctuation term. The models with deviations did not include the fluctuation term. Black curve: original model fitted to the data at 5 °C. Gray curve: model with elliptical cross section in the direction perpendicular to the cylinder axis of the original model. Blue curve: model with protein belt with a height of 70 Å and a thickness of 25 Å. The shell is 10 Å thick at the areas not covered by the belt. Red curve: model with polydispersity in the outer radius and composition variation in the shell as described in the text.
Table 2. Structural Parameters for Original Model with Fluctuation Term and for the Models with Lower Symmestry without the Fluctuation Term after Adjusting the Model Parameters To Fit the 5 °C SAXS Data
original model elliptical cross section protein belt structurea polydisperse outer radiusb
R (Å) 124.9 ± 0.4 114.2 ± 1.1 109.7 ± 0.4 119.4 ± 0.3 ε 0.731 ± 0.003 0.772 ± 0.008 0.681 ± 0.004 0.734 ± 0.002 t 2.83 ± 0.08 2.51 ± 0.06 2.49 ± 0.08 3.01 ± 0.05 Δρcore −2.01 ± 0.09 −2.94 ± 0.08 −1.23 ± 0.03c −2.49 ± 0.03 Δρc 3.7 ± 0.1 3.77 ± 0.08 1.87 ± 0.02c 3.42 ± 0.03 T (Å) 16 ± 1 24.7 ± 0.3 20.2 ± 0.6 22.3 ± 0.2 d (Å) 36.7 ± 0.1 36.2 ± 0.1 37.5 ± 0.2 35.9 ± 0.1 εcs(perp) 1.40 ± 0.02 σ(R)/R 0.1, fixed
aThe protein belt was 70 Å high and 25 Å thick. The rest of the core surface was covered by a 10 Å thin shell.bThe contrast of the shell varied as 1 +
(4 × 10⁻⁵)S, where S is the core surface area, which depends on the size of the particles. Note that the contrast was further normalized to unity for the average size particles.cThese contrasts are lower than for the other models as the integral scattering of the shell is smaller in this model due to
the smaller volume of the shell.
Table 3. Comparison of Size and Shape between TEM and SAXS Data
low temperature high temperature
εR (Å) R (Å) ε R (Å)
TEM projected 91 117 0.79 122
TEM middle cut 97 128 0.76 128
to obtain reliable SAS data. This should furthermore be combined with full compositional characterization of the particles through lipidomic and proteomic studies to be able to elucidate as much structural information as possible when fitting to a predefined model.
Nonetheless, the advancement in modeling presented here allows for systematic structural studies of various composition-ally different LDL subfractions that are thought to promote atherogenic plaque build-up. It allows in situ measurements of the structural changes inflicted on the LDL and its core lipids by external stimuli including, e.g., different oxidation agents as well as LDL-specific drugs. This can in turn provide important information on the physiological relevance of the lipid packing (lipids packed in a crystalline state are thought to be shielded from the less mobile radicals18 and give insights into the conditions needed to protect the particles from structural modifications). The latter is essential in the quest for the development of drugs against CVD.
CONCLUSIONS
We have developed a SAXS model that describes the overall structure of LDL as well as the particular layering of lipids inside the LDL particle core. The model, when applied to experimental SAXS data, gives information on the particle-specific melting temperature of the core lipids and shows that the state of the lipid core influences the size and shape of the overall LDL particle and to which extent. The model is also able to extract information on the protein layer of the LDL, and the results show that it undergoes large structural changes induced by the crystalline packing of the core lipids. This model will now allow systematic studies to unravel composition/ structure dependency as well as LDLs susceptibility to external agents that are currently in use or are planned to be used for atherosclerosis control.
METHODS
Purification of LDL Particles from Human Plasma. Human LDL particles (densities between 1.019 and 1.050 g/mL) isolated by sequential ultracentrifugation were a kind gift from the group of Prof. Gunilla Fredrikson (Lund University). The samples conserved in 50% sucrose, 150 mM NaCl, 24 mM EDTA, pH 7.4, were buffer exchanged into 25 mM Tris, 150 mM NaCl, 0.5 mM EDTA, pH 7.4 using PD10 desalting columns (GE Healthcare) and fractionated on a Superose 6 Increase 10/300 GL column (GE Healthcare) equilibrated in the same buffer. The different fractions from SEC corresponding to LDL particle size were collected at 25 °C, stored at 4 °C, and tested individually using SAXS and used within a week of purification.
LDL Compositional Analysis. The concentration of the protein component of LDL (ApoB-100) was determined by the Bradford method and with bovine serum albumin as the standard.24 The
concentrations of the fat components of LDL were analyzed enzymatically. Total cholesterol (TC) and triglycerides (TG) were determined using colorimetric assays (Infinity Thermo Scientific) with a chemistry calibration standard (Pointe Scientific, Inc.). Phosphati-dylcholine was determined using the phosphatiPhosphati-dylcholine assay kit (Sigma-Aldrich) and confirmed through determination of total phosphorus content.44
SAXS Data Collection. All SAXS data were collected at the optimized SAXS (Bruker AXS) instrument at Aarhus University that uses a powerful gallium metal jet X-ray source (Excillum)45together
with home-built scatterless slits46 in front of the sample with a two-pinhole geometry. The home-built flow-through sample holders were made of quartz capillaries glued into stainless steel holders, and the samples were handled by an automated injection system, based on Gilson components, which also cleaned and dried the capillary
between measurements. The buffers were measured as background, and background subtraction and all necessary normalizations were made using our homemade software. The temperature was controlled by a Peltier element, and the samples were measured at nine different temperatures ranging from 5 to 40 °C.
Derivation of the SAXS Model for LDL. The SAXS intensity expressions for an LDL model were based on previously published cryo-TEM images on human LDL fractions collected and purified under similar conditions to the ones reported here.19,21These images
suggested that the shape of the LDL particles resembles that of a core−shell oblate ellipsoid of revolution, for which the core presents layers of ordered cholesteryl esters. This layering is thought to induce a flattening of the shape, which could be well reproduced by a superellipsoid of revolution. A central cut of a super ellipsoid is shown inFigure 1a. The size and shape are given by the radius at equator, R, the half-height of the ellipsoid, εR, and the shape exponent t.Figure 1
shows a super ellipsoid with t = 3. A usual ellipsoid of revolution is obtained for t = 2, and the super ellipsoid of revolution approaches a cylinder for t =∞.
The outer shape of a super ellipsoid of revolution is in Cartesian coordinates (x, y, z) given by ε + + = x y z R ( 2 2 /2)t t t or in cylindrical coordinates ε + = r z R ( )2 /2t t t
The form factor P(q) can be calculated using the form factor of a cylinder, which is symmetric around z = 0, with a radius r that depends on z
∫ ∫
π θ θ θ θ θ = π ⎛ ε ⎝ ⎜⎜ ⎞⎠⎟⎟ V P q r z J qr z qr z qz z ( ) 2 ( ) 2 ( ( ) sin )( ) sin cos( cos ) d sin d R 2 0 /2 0 /2 2 1 2
where V is the volume of the super ellipsoid and
ε =⎛⎝⎜ − ⎞ ⎠ ⎟ r z( ) Rt zt t 1/
J1(x) is the Bessel function of first order and first kind. In the implementation, both integrals are calculated numerically.
A core−shell model can easily be constructed by making appropriate differences inside the integrand of the angular integration on the amplitudes before they are squared. For this purpose, we introduce the notation
∫
θ π θ θ θ ε = ε VA q R r z J qr z qr z qz z ( , , , ) 2 ( ) 2 ( ( ) sin )( ) sin cos( cos ) d
R
SE 0
/2 2 1
For a constant shell thickness Dshell, an excess scattering length density ofΔρshelland a core excess scattering length density ofΔρcoreleads to
∫
ρ θ ρ ρ θ θ θ = Δ ε − Δ − Δ − ε π − P q V A q R V A q R D ( ) ( ( , , , ) ( ) ( , , , )) sin d core shell 0 /2 shell shell SEshell core core SE shell core 2
where εcore = (εR − Dshell)/(R − Dshell), Vshell is the volume corresponding to the outer shape of the particle and Vcore is the volume of the core. Also here the integrals in the implementation are calculated numerically. Note that the normalization in the core−shell form factor is changed so that it contains both the excess contrasts squared and the volume squared.
The model includes the specific layering of the cholesteryl esters as has been shown in the TEM data26 and illustrated inFigure 1b. To
distance Dc between the core−shell interface and the layers is introduced. For this purpose, we consider a shell with radius Rc= R− Dshell− Dcand eccentricity εc= (εR− Dshell− Dc)/(R− Dshell− Dc). Note that this shell is only used as a means of calculating the radius of the layers.
The extra contrast of the layers is defined asΔρc(extra meaning on top of the core excess contrast of hydrocarbon inside the particle core). The thickness of the cholesteryl ester layers is defined as T, leading to the following contribution of the central layer inside the square in the integral of the core−shell form factor:
θ ρπ θ θ θθ = Δ A q R L R T J qR qR qT qT ( , , , ) 2 ( sin ) sin sin( cos /2) cos /2 central c c c2 1 c c
The two other layers are defined to be at a separation of d from the central one, which then contributes the following term inside the square: θ ρπ θθ θθ θ θ = Δ + ++ − − − − ⎡ ⎣ ⎢ ⎤ ⎦ ⎥ A q R T d R J qR qR d T q d T q d T d T q d T q d T ( , , , , ) 2 ( sin ) sin (2 ) sin( (2 ) cos /2) (2 ) cos /2 (2 )sin( (2 ) cos /2) (2 ) cos /2 l 2layers l c 2 1 l l where Rlis given by ε =⎛ − ⎝ ⎜⎜ ⎞⎠⎟⎟ R Rt d t t l c c 1/
The total form factor then becomes
∫
ρ θ ρ ρ θ θ θ θ θ = Δ ε − Δ − Δ − ε + + + π P q V A q R V A q R D A q R L A q R T d C P qR ( ) ( ( , , , ) ( ) ( , , , ) ( , , , ) ( , , , , )) sin d ( ) LDL 0 /2shell shell SE shell core core SE shell core
central c 2layers l 2
fluct fluct g
where the last term, for example, describes the fluctuation scattering within the shell due to a partially disordered protein with an ensemble-average radius of gyration Rg. Note that calculations for particles with deviation from the ideal model in terms size polydispersity, eccentricity around the z axis, or the protein being located in a belt show that these effects influence the curve in a similar way as the fluctuation term (seeFigure 7and theSIfor model descriptions). The effect of deviations from the ideal model as well as of the fluctuation term is to add intensity at the minima of the form factor oscillations in a similar way. Therefore, the fluctuation term may also describe such deviations. Due to this and the fact that the model already contains a relatively large number of parameters, the model with the fluctuation term is to be preferred.
The parameter Cfluct is a scale factor and the fluctuations are described by the form factor of Gaussian chains
= − − + P x x x ( ) 2(e x 1 ) fluct 2 where x = q2R
g2. The model was implemented in a home-written program which uses standard weighted least-squares methods for optimizing the model parameters when fitting to the experimental data.47
The volume of a super ellipsoid of revolution is given by
π β ε = ⎜⎛ ⎟ ⎝ ⎞⎠ V R t t t t ( , , ) 4 3 2, 1
where β(x,y)=Γ(x) Γ(y) /Γ(x + y) and Γ(x) is the gamma function.48
The surface areas were calculated numerically as the volume of a thin shell with constant thickness divided by the shell thickness
δ δ δ δ
ε ≈ ε − − ε − −
S R( , , )t [ ( , , )V R t V R( , (R )/(R ), )]/t
The contribution to the scattering mass of the various components of the model are given by their scattering, which is the product of the excess scattering length densityΔρ of the component multiplied by volume V of the component. As the total scattering mass is conserved, except for small variations in the changes of the volume of the component with temperature, the calculation of this quantity can reveal if there is a change in the mixing of the components, when the temperature is changed.
In the calculation of the volumes of the various components from the composition (Supporting Table S1) as given in the texts, we used a protein partial specific density of 0.7 cm3/g, a density of 0.99 g/cm3for cholesterol and cholesteryl esters, a density of 1.00 g/cm3 for the phospholipids, a density of 0.925 g/cm3 for triglycerides, and partial volumes of head and tail for POPC of 324 and 980 Å3.49,50
Schematic Representation of LDL Particle Structure. The schematic representations of the LDL structures were made by generating points in agreement with the various structural constraints by Monte Carlo methods.42 The points for each component were saved in different files in PDB format. The structures were plotted using PyMOL (PyMOL Molecular Graphics System, Version 1.8, Schrödinger, LLC) placing atoms/spheres of different colors, depend-ing on component, at the positions of the points. The van der Waal radius was chosen as 4 Å.
Differential Scanning Calorimetry. The heat capacity (Cp) for purified LDL was collected using a VP-DSC from MicroCal. The LDL sample (protein concentration 0.5 mg/mL) in 50 mM Tris buffer, 150 mM NaCl, after SEC was heated from 5 to 45 °C, and 50 mM Tris, 150 mM NaCl used for equilibration of the SEC column and elution of LDL as the reference. The sample was first equilibrated for 30 min at 5 °C then heated to 45 °C with a heating rate of 60 °C/h and equilibrated for 10 min. The heating process was then repeated after cooling the sample down to 5 °C with the same rate. Background was subtracted using the Origin Software.
Size Analysis of Published Cryo-TEM Micrographs. The micrographs of Kumar et al.21were analyzed using the ImageJ software
(https://imagej.nih.gov) in order to estimate the dimensions of the particles for comparison with the SAXS data. By calculating line intensities in various directions of the particles; both projected and cuts through the particles in the middle were analyzed. The separation of the cholesteryl ester layers was used for calibration of the scale of micrographs by setting it equal to the SAXS value of 37 Å. The line intensities were analyzed by fitting a series of Gaussian functions plus a constant to the data so that the peak center positions could be obtained and used for calibration. The outer dimensions were determined from where the intensity in the line profile approaches the lowest value.
ASSOCIATED CONTENT
*
S Supporting InformationThe Supporting Information is available free of charge on the
ACS Publications websiteat DOI:10.1021/acsnano.6b08089. Size-exclusion chromatogram for LDL fractions after ultracentrifugation, SAXS profiles for LDL fractions before and after SEC, composition for LDL fraction after ultracentrifugation and SEC, description for derivation of alternative models shown in Figure 7
(PDF)
AUTHOR INFORMATION
Corresponding Authors
*E-mail:marite.cardenas@mah.se. *E-mail:jsp@chem.au.dk.
ORCID
Marité Cárdenas: 0000-0003-0392-3540
Author Contributions
S.M., M.C., and J.S.P. designed all experiments. S.M., T.K.L., J.L., and J.S.P. collected SAXS data. J.S.P. derived the mathematical model, and S.M. and J.S.P analyzed and modeled all SAXS data. S.M. performed all SEC and compositional studies. S.M. and T.K.L performed DSC experiments and analyzed data. S.M., M.C., and J.S.P wrote the article.
Notes
The authors declare no competing financial interest.
Studies investigating human LDL and HDL involves lipid extraction from plasma obtained from healthy blood donors. Plasma is obtained from clinical immunology and transfusion medicine, Skåne University Hospital, Sweden, in accordance with the Helsinki Declaration. The plasma is anonymized and outdated and can therefore not be used for transfusion of patients.
ACKNOWLEDGMENTS
This work was supported by the Swedish Research Council (Grant No. 2014-3981) and INTERREG ESS & MAX IV: Cross Border Science and Society (Grant No. 001). We thank Prof. Gunilla Fredrikson, Dr. Eva Bengtsson, and Irene Ljungkrantz (Lund University) for the kind gift of human LDL particles and Prof. Kell Mortensen (University of Copenhagen) for the use of the DSC. We thank Björn Sander for fruitful discussions of the interpretation of the cryo-TEM. The plasma used for purification of LDL was obtained from Blodcentralen Region Skåne.
REFERENCES
(1) Nichols, M.; Townsend, N.; Scarborough, P.; Rayner, M. Cardiovascular Disease In Europe 2014: Epidemiological Update. Eur. Heart J. 2014, 35, 2950−2959.
(2) Carmena, R.; Duriez, P.; Fruchart, J. C. Atherogenic Lipoprotein Particles In Atherosclerosis. Circulation 2004, 109, III2−7.
(3) Rajman, I.; Eacho, P. I.; Chowienczyk, P. J.; Ritter, J. M. LDL Particle Size: An Important Drug Target? Br. J. Clin. Pharmacol. 1999, 48, 125−133.
(4) Chapman, M. J.; Laplaud, P. M.; Luc, G.; Forgez, P.; Bruckert, E.; Goulinet, S.; Lagrange, D. Further Resolution Of The Low Density Lipoprotein Spectrum In Normal Human Plasma: Physicochemical Characteristics Of Discrete Subspecies Separated By Density Gradient Ultracentrifugation. J. Lipid Res. 1988, 29, 442−458.
(5) Ritter, S.; Frey, I.; Diederichs, K.; Grathwohl, D.; Keul, J.; Baumstark, M. W. Crystallization And Preliminary X-Ray Diffraction Data Of Two Different Human Low-Density Lipoprotein (LDL) Subfractions. Proteins: Struct., Funct., Genet. 1997, 28, 293−297.
(6) Ritter, S.; Diederichs, K.; Frey, I.; Berg, A.; Keul, J.; Baumstark, M. W. Crystallization Of Human Low Density Lipoprotein (LDL), A Large Lipid-Protein Complex - Collection Of X-Ray Data At Very Low Resolution. J. Cryst. Growth 1999, 196, 344−349.
(7) Prassl, R.; Chapman, J. M.; Nigon, F.; Sara, M.; Eschenburg, S.; Betzel, C.; Saxena, A.; Laggner, P. Crystallization And Preliminary X-Ray Analysis Of A Low Density Lipoprotein From Human Plasma. J. Biol. Chem. 1996, 271, 28731−28733.
(8) Stuhrmann, H. B.; Tardieu, A.; Mateu, L.; Sardet, C.; Luzzati, V.; Aggerbeck, L.; Scanu, A. M. Neutron Scattering Study Of Human Serum Low Density Lipoprotein. Proc. Natl. Acad. Sci. U. S. A. 1975, 72, 2270−2273.
(9) Laggner, P.; Degovics, G.; Muller, K. W.; Glatter, O.; Kratky, O.; Kostner, G.; Holasek, A. Molecular Packing And Fluidity Of Lipids In Human Serum Low Density Lipoproteins. Hoppe-Seyler's Z. Physiol. Chem. 1977, 358, 771−778.
(10) Atkinson, D.; Deckelbaum, R. J.; Small, D. M.; Shipley, G. G. Structure Of Human Plasma Low-Density Lipoproteins: Molecular Organization Of The Central Core. Proc. Natl. Acad. Sci. U. S. A. 1977, 74, 1042−1046.
(11) Muller, K.; Laggner, P.; Glatter, O.; Kostner, G. The Structure Of Human-Plasma Low-Density Lipoprotein B. An X-Ray Small-Angle Scattering Study. Eur. J. Biochem. 1978, 82, 73−90.
(12) Laggner, P.; Kostner, G. M.; Rakusch, U.; Worcester, D. Neutron Small Angle Scattering On Selectively Deuterated Human Plasma Low Density Lipoproteins. The Location Of Polar Phospholipid Headgroups. J. Biol. Chem. 1981, 256, 11832−11839.
(13) Meyer, D. F.; Nealis, A. S.; Bruckdorfer, K. R.; Perkins, S. J. Characterization Of The Structure Of Polydisperse Human Low-Density Lipoprotein By Neutron Scattering. Biochem. J. 1995, 310, 407−415.
(14) Prassl, R.; Laggner, P. Molecular Structure Of Low Density Lipoprotein: Current Status And Future Challenges. Eur. Biophys. J. 2009, 38, 145−158.
(15) Baumstark, M. W.; Kreutz, W.; Berg, A.; Frey, I.; Keul, J. Structure of Human Low-Density Lipoprotein Subfractions, Deter-mined by X-Ray Small-Angle Scattering. Biochim. Biophys. Acta, Protein Struct. Mol. Enzymol. 1990, 1037, 48−57.
(16) Deckelbaum, R. J.; Shipley, G. G.; Small, D. M. Structure And Interactions Of Lipids In Human Plasma Low Density Lipoproteins. J. Biol. Chem. 1977, 252, 744−754.
(17) Hevonoja, T.; Pentikainen, M. O.; Hyvonen, M. T.; Kovanen, P. T.; Ala-Korpela, M. Structure Of Low Density Lipoprotein (LDL) Particles: Basis For Understanding Molecular Changes In Modified LDL. Biochim. Biophys. Acta, Mol. Cell Biol. Lipids 2000, 1488, 189− 210.
(18) Schuster, B.; Prassl, R.; Nigon, F.; Chapman, M. J.; Laggner, P. Core Lipid Structure Is a Major Determinant of the Oxidative Resistance of Low-Density-Lipoprotein. Proc. Natl. Acad. Sci. U. S. A. 1995, 92, 2509−2513.
(19) Liu, Y.; Luo, D.; Atkinson, D. Human LDL Core Cholesterol Ester Packing: Three-Dimensional Image Reconstruction And SAXS Simulation Studies. J. Lipid Res. 2011, 52, 256−262.
(20) Orlova, E. V.; Sherman, M. B.; Chiu, W.; Mowri, H.; Smith, L. C.; Gotto, A. M., Jr. Three-Dimensional Structure Of Low Density Lipoproteins By Electron Cryomicroscopy. Proc. Natl. Acad. Sci. U. S. A. 1999, 96, 8420−8425.
(21) Kumar, V.; Butcher, S. J.; Oorni, K.; Engelhardt, P.; Heikkonen, J.; Kaski, K.; Ala-Korpela, M.; Kovanen, P. T. Three-Dimensional Cryoem Reconstruction Of Native LDL Particles To 16A Resolution At Physiological Body Temperature. PLoS One 2011, 6, e18841.
(22) Havel, R. J.; Eder, H. A.; Bragdon, J. H. Distribution And Chemical Composition Of Ultracentrifugally Separated Lipoproteins In Human Serum. J. Clin. Invest. 1955, 34, 1345−1353.
(23) Scheffer, P. G.; Bakker, S. J. L.; Heine, R. J.; Teerlink, T. Measurement Of Low-Density Lipoprotein Particle Size By High-Performance Gel-Filtration Chromatography. Clin Chem. 1997, 43, 1904−1912.
(24) Bradford, M. M. A Rapid And Sensitive Method For The Quantitation Of Microgram Quantities Of Protein Utilizing The Principle Of Protein-Dye Binding. Anal. Biochem. 1976, 72, 248−254. (25) Barr, A. H. Superquadrics and Angle-Preserving Trans-formations. IEEE Comput. Graph. Appl. 1981, 1, 11−23.
(26) Ren, G.; Rudenko, G.; Ludtke, S. J.; Deisenhofer, J.; Chiu, W.; Pownall, H. J. Model Of Human Low-Density Lipoprotein And Bound Receptor Based On Cryoem. Proc. Natl. Acad. Sci. U. S. A. 2010, 107, 1059−1064.
(27) Wu, Z.; Gogonea, V.; Lee, X.; May, R. P.; Pipich, V.; Wagner, M. A.; Undurti, A.; Tallant, T. C.; Baleanu-Gogonea, C.; Charlton, F.; Ioffe, A.; DiDonato, J. A.; Rye, K. A.; Hazen, S. L. The Low Resolution Structure Of Apoa1 In Spherical High Density Lipoprotein Revealed By Small Angle Neutron Scattering. J. Biol. Chem. 2011, 286, 12495− 12508.
(28) Andersen, K. K.; Oliveira, C. L.; Larsen, K. L.; Poulsen, F. M.; Callisen, T. H.; Westh, P.; Pedersen, J. S.; Otzen, D. The Role Of
Decorated SDS Micelles In Sub-CMC Protein Denaturation And Association. J. Mol. Biol. 2009, 391, 207−226.
(29) Kaspersen, J. D.; Pedersen, J. N.; Hansted, J. G.; Nielsen, S. B.; Sakthivel, S.; Wilhelm, K.; Nemashkalova, E. L.; Permyakov, S. E.; Permyakov, E. A.; Pinto Oliveira, C. L.; Morozova-Roche, L. A.; Otzen, D. E.; Pedersen, J. S. Generic Structures Of Cytotoxic Liprotides: Nano-Sized Complexes With Oleic Acid Cores And Shells Of Disordered Proteins. ChemBioChem 2014, 15, 2693−2702.
(30) Oliveira, C. L.; Santos, P. R.; Monteiro, A. M.; Figueiredo Neto, A. M. Effect Of Oxidation On The Structure Of Human Low- And High-Density Lipoproteins. Biophys. J. 2014, 106, 2595−2605.
(31) Chatterton, J. E.; Phillips, M. L.; Curtiss, L. K.; Milne, R. W.; Marcel, Y. L.; Schumaker, V. N. Mapping Apolipoprotein B On The Low Density Lipoprotein Surface By Immunoelectron Microscopy. J. Biol. Chem. 1991, 266, 5955−5962.
(32) van Antwerpen, R.; Chen, G. C.; Pullinger, C. R.; Kane, J. P.; LaBelle, M.; Krauss, R. M.; Luna-Chavez, C.; Forte, T. M.; Gilkey, J. C. Cryo-Electron Microscopy Of Low Density Lipoprotein And Reconstituted Discoidal High Density Lipoprotein: Imaging Of The Apolipoprotein Moiety. J. Lipid Res. 1997, 38, 659−669.
(33) van Antwerpen, R. Preferred Orientations Of LDL In Vitreous Ice Indicate A Discoid Shape Of The Lipoprotein Particle. Arch. Biochem. Biophys. 2004, 432, 122−127.
(34) Deckelbaum, R. J.; Shipley, G. G.; Small, D. M.; Lees, R. S.; George, P. K. Thermal Transitions In Human Plasma Low Density Lipoproteins. Science 1975, 190, 392−394.
(35) Ginsburg, G. S.; Atkinson, D.; Small, D. M. Physical Properties Of Cholesteryl Esters. Prog. Lipid Res. 1984, 23, 135−167.
(36) Schumaker, V. N.; Phillips, M. L.; Chatterton, J. E. Apolipoprotein B And Low-Density Lipoprotein Structure: Implica-tions For Biosynthesis Of Triglyceride-Rich Lipoproteins. Adv. Protein Chem. 1994, 45, 205−248.
(37) Segrest, J. P.; Jones, M. K.; De Loof, H.; Dashti, N. Structure Of Apolipoprotein B-100 In Low Density Lipoproteins. J. Lipid Res. 2001, 42, 1346−1367.
(38) Johs, A.; Hammel, M.; Waldner, I.; May, R. P.; Laggner, P.; Prassl, R. Modular Structure Of Solubilized Human Apolipoprotein B-100. Low Resolution Model Revealed By Small Angle Neutron Scattering. J. Biol. Chem. 2006, 281, 19732−19739.
(39) Prassl, R.; Pregetter, M.; Amenitsch, H.; Kriechbaum, M.; Schwarzenbacher, R.; Chapman, J. M.; Laggner, P. Low Density Lipoproteins As Circulating Fast Temperature Sensors. PLoS One 2008, 3, e4079.
(40) Kucerka, N.; Nieh, M. P.; Katsaras, J. Fluid Phase Lipid Areas And Bilayer Thicknesses Of Commonly Used Phosphatidylcholines As A Function Of Temperature. Biochim. Biophys. Acta, Biomembr. 2011, 1808, 2761−2771.
(41) Wang, L.; Walsh, M. T.; Small, D. M. Apolipoprotein B Is Conformationally Flexible But Anchored At A Triolein/Water Interface: A Possible Model For Lipoprotein Surfaces. Proc. Natl. Acad. Sci. U. S. A. 2006, 103, 6871−6876.
(42) Pedersen, J. S.; Oliveira, C. L. P.; Hubschmann, H. B.; Arleth, L.; Manniche, S.; Kirkby, N.; Nielsen, H. M. Structure of Immune Stimulating Complex Matrices and Immune Stimulating Complexes in Suspension Determined by Small-Angle X-Ray Scattering. Biophys. J. 2012, 102, 2372−2380.
(43) Lund-Katz, S.; Laplaud, P. M.; Phillips, M. C.; Chapman, M. J. Apolipoprotein B-100 Conformation And Particle Surface Charge In Human LDL Subspecies: Implication For LDL Receptor Interaction. Biochemistry 1998, 37, 12867−12874.
(44) Rouser, G.; Siakotos, A. N.; Fleischer, S. Quantitative Analysis Of Phospholipids By Thin-Layer Chromatography And Phosphorus Analysis Of Spots. Lipids 1966, 1, 85−86.
(45) Schwamberger, A.; De Roo, B.; Jacob, D.; Dillemans, L.; Bruegemann, L.; Seo, J. W.; Locquet, J. P. Combining SAXS And DLS For Simultaneous Measurements And Time-Resolved Monitoring Of Nanoparticle Synthesis. Nucl. Instrum. Methods Phys. Res., Sect. B 2015, 343, 116−122.
(46) Li, Y. L.; Beck, R.; Huang, T.; Choi, M. C.; Divinagracia, M. Scatterless Hybrid Metal-Single-Crystal Slit For Small-Angle X-Ray Scattering And High-Resolution X-Ray Diffraction. J. Appl. Crystallogr. 2008, 41, 1134−1139.
(47) Pedersen, J. S. Analysis Of Small-Angle Scattering Data From Colloids And Polymer Solutions: Modeling And Least-Squares Fitting. Adv. Colloid Interface Sci. 1997, 70, 171−210.
(48) Barr, A. H., Rigid Physically Based Superquadrics. In Graphics Gems III; Kirk, D., Ed.; Academic Press Professional, 1992; pp 137− 159.
(49) The Structure Of The VLD And The B-Lipoproteins. Acta Med. Scand. 1966, 179, 26−2910.1111/j.0954-6820.1966.tb02409.x.
(50) Greenwood, A. I.; Tristram-Nagle, S.; Nagle, J. F. Partial Molecular Volumes Of Lipids And Cholesterol. Chem. Phys. Lipids 2006, 143, 1−10.
DOI:10.1021/acsnano.6b08089 ACS Nano 2017, 11, 1080−1090