publisher proof-corrections or journal pagination.
Citation for the published paper:
Chrcanovic, Bruno; Kisch, Jenö; Albrektsson, Tomas; Wennerberg, Ann.
(2016). Factors Influencing Early Dental Implant Failures. Journal of Dental
Research, vol. 95, issue 9, p. null
URL: https://doi.org/10.1177/0022034516646098
Publisher: Sage
This document has been downloaded from MUEP (https://muep.mah.se) /
DIVA (https://mau.diva-portal.org).
For Peer Review
Factors influencing early dental implant failures
Journal: Journal of Dental Research
Manuscript ID JDR-16-0075.R3
Manuscript Type: Research Reports
Date Submitted by the Author: n/a
Complete List of Authors: Chrcanovic, Bruno; Faculty of Odontology, Malmö University, Prosthodontics
Kisch, Jenö; Centre of Dental Specialist Care, Clinic for Prosthodontics Albrektsson, Tomas; Göteborg University, Department of Biomaterials; Faculty of Odontology, Malmö University, Department of Prosthodontics Wennerberg, Ann; Faculty of Odontology, Malmö University, Department of Prosthodontics
Keywords: Dental implant(s), Clinical outcomes, Biostatistics, Oral-systemic disease(s), Osseointegration, Risk factor(s)
Abstract:
The purpose of the present study was to assess the influence of local and systemic factors on the occurrence of dental implant failures up to the 2nd stage surgery (abutment connection). This retrospective study is based on 2,670 patients who received 10,096 implants and were consecutively treated with implant-supported prostheses between 1980 and 2014 at one specialist clinic. Several anatomical-, patient-, health-, and implant-related factors were collected. Descriptive statistics were used to describe the patients and implants. Univariate and multivariate logistic regression models were used at the patient-level as well as at the implant-level, to evaluate the effect of explanatory variables on the failure of implants up to abutment connection. A generalized estimating equation method was used for the implant-level analysis, to account for the fact that repeated
observations (several implants) were available for a single patient. Overall, 642 implants (6.36%) failed, of which 176 implants (1.74%) in 139 patients were lost up to the 2nd stage surgery. The distribution of implants in sites of different bone quantities/qualities was quite similar between implants lost up to and after abutment connection. Smoking and the intake of antidepressants were the statistically significant predictors in the multivariate model. Trial registration at the U.S. National Institutes of Health (clinicaltrials.gov): NCT02369562
For Peer Review
Factors influencing early dental implant failuresBruno Ramos Chrcanovic 1* Jenö Kisch 2
Tomas Albrektsson 1,3 Ann Wennerberg 1
1
Department of Prosthodontics, Faculty of Odontology, Malmö University, Malmö, Sweden
2 Clinic for Prosthodontics, Centre of Dental Specialist Care, Malmö, Sweden 3
Department of Biomaterials, Göteborg University, Göteborg, Sweden * Corresponding author:
Bruno Ramos Chrcanovic, Department of Prosthodontics, Faculty of Odontology, Malmö University, Carl Gustafs väg 34, SE-205 06, Malmö, Sweden. bruno.chrcanovic@mah.se; brunochrcanovic@hotmail.com Mobile: +46 725 541 545 Fax: +46 40 6658503
Abstract word count: 206 Total word count: 3,196 Total number of tables: 5 Total number of figures: 0 Number of references: 40 2 3 4 5 6 7 8 9 10 11 12 13 14 15 16 17 18 19 20 21 22 23 24 25 26 27 28 29 30 31 32 33 34 35 36 37 38 39 40 41 42 43 44 45 46 47 48 49 50 51 52 53 54 55 56 57 58 59
For Peer Review
AbstractThe purpose of the present study was to assess the influence of local and systemic factors on the occurrence of dental implant failures up to the 2nd stage surgery (abutment connection). This retrospective study is based on 2,670 patients who received 10,096 implants and were consecutively treated with implant-supported prostheses between 1980 and 2014 at one specialist clinic. Several anatomical-, patient-, health-, and implant-related factors were collected. Descriptive statistics were used to describe the patients and implants. Univariate and multivariate logistic regression models were used at the patient-level as well as at the implant-level, to evaluate the effect of explanatory variables on the failure of implants up to abutment connection. A generalized estimating equation method was used for the implant-level analysis, to account for the fact that repeated observations (several implants) were available for a single patient. Overall, 642 implants (6.36%) failed, of which 176 implants (1.74%) in 139 patients were lost up to the 2nd stage surgery. The distribution of implants in sites of different bone quantities/qualities was quite similar between implants lost up to and after abutment connection. Smoking and the intake of antidepressants were the statistically significant predictors in the multivariate model. Trial registration at the U.S. National Institutes of Health (clinicaltrials.gov): NCT02369562
Keywords
Dental implants; endosseous dental implantation; osseointegration; treatment outcome; adverse effects; survival rate
2 3 4 5 6 7 8 9 10 11 12 13 14 15 16 17 18 19 20 21 22 23 24 25 26 27 28 29 30 31 32 33 34 35 36 37 38 39 40 41 42 43 44 45 46 47 48 49 50 51 52 53 54 55 56 57 58 59
For Peer Review
IntroductionNowadays dental implant placement is an effective and predictable treatment modality for replacing missing teeth in both fully and partially edentulous patients. Nevertheless, failures still happen despite the high implant survival and success rates (Chrcanovic et al., 2014). Failures of dental implants can be subdivided into early and late failures, depending on whether they occur before or at abutment connection surgery (early) or after occlusal loading by a prosthetic restoration (late). This subdivision is relevant as it is suggested that the failures in these two distinct time periods may be associated with different factors. An early failure of an implant results from an inability to establish an intimate bone-to-implant contact. In this case the bone healing after implant insertion is impaired and may be influenced by local and systemic factors (Alsaadi et al., 2007). Systemic diseases and compromising risky habits may affect oral tissues by increasing their susceptibility to other diseases or by interfering with wound healing. Surgical conditions, submission to radiotherapy, and the intake of medications by the patient may play a role on the outcome of implants. When it comes to late implant failures, the oral microbial environment, parafunctional habits, and the prosthetic rehabilitation variables are also taken into account. Although many studies have shown the influence of local and systemic factors in the long-term outcome of dental implants (Chrcanovic et al., 2014), less is known concerning the factors affecting the initial phases of osseointegration. The aim of the present study was to assess the influence of local and systemic factors on the occurrence of implant failures up to the 2nd stage surgery (abutment connection).
Materials and Methods
Materials. This retrospective study is based on all 2,670 patients who received 10,096
implants, and were consecutively treated with implant-supported prostheses between 1980 and 2014 at one specialist clinic (Clinic for Prosthodontics, Centre of Dental Specialist Care, Malmö, Sweden). The study was approved by the Regional Ethical Review Board in Lund (Dnr 2014/598; Dnr 2015/72). This study is in concordance with the STROBE guidelines for observational studies.
Inclusion and exclusion criteria. All implants that had failed up to the 2nd stage surgery (abutment connection) were included. Therefore, there is a minimum risk of selection bias, since all implants with early failure were selected from all implants ever inserted in this
clinic. Only modern endosseous dental implants with cylindrical or conical design were
2 3 4 5 6 7 8 9 10 11 12 13 14 15 16 17 18 19 20 21 22 23 24 25 26 27 28 29 30 31 32 33 34 35 36 37 38 39 40 41 42 43 44 45 46 47 48 49 50 51 52 53 54 55 56 57 58 59
For Peer Review
considered. Zygomatic implants were not included in the study, as well as implants detected in radiographies, but without basic information about them in the patients’ files.
Definitions. An implant was considered a failure if presenting signs and symptoms that
led to implant removal. Thus, a failed implant in our study is equal to a lost implant.
Data collection. The following data were collected: implant surface (turned/machined
or enlarged surfaces, the latter including sandblasted, acid-etched, sandblasted + acid-etched, anodized, hydroxyapatite-coated surfaces), implant system (Nobel turned, Nobel TiUnite, Astra TiOblast, Astra Osseospeed, Straumann SLA/SLActive/Roxlid, XIVE/Frialit-2, other), implant length and diameter, implant design (cylindrical or conical), prescription of antibiotics (the prophylactic antibiotic regimen was usually starting 1-2 hours before surgery and going from 5-7 days postoperatively), bone graft procedures, reason for tooth extraction (periodontal disease, fracture/trauma, advanced caries, agenesia, other), implant jaw location (maxilla or mandible), number of implants in maxilla/mandible, anterior or posterior location of the implant (locations between 13-23 and 33-43 were considered anterior location), patient’s sex, age of the patient at the implant insertion surgery, number of days until failure, time between loss of an implant and replacement by another one, follow-up time. Bone quantity and quality of the treated jaws were classified at the time of surgery according to the Lekholm and Zarb (Lekholm and Zarb, 1985) classification.
The general health and the behavioral history of the patients were collected from the patients’ files. The presence of a medicament list in the patients’ records was used to correlate the use of certain drugs to specific health conditions. The following health factors were assessed: diabetes types I or II, hypertension, hypercholesterolemia, hypothyroidism, asthma, psoriasis, chemotherapy, and irradiation of the head-neck region. The patients were also classified according to the intake of the following medication types: antidepressants, immunosuppressive drugs, bisphosphonates, antithrombotic agents (antiplatelet, anticoagulant, thrombolytic drugs), hormone replacement therapy (HRT) in women, and medicaments to reduce the acid gastric production. The following behavioral factors were assessed: smoking habits, use of snuff, bruxism.
Statistical analyses. The mean, standard deviation, and percentages were presented as
descriptive statistics. Logistic regression models were used at the patient-level as well as at the implant-level. The patient-level analysis considered the patient as the statistical unit, with patients presenting or not presenting implant failures. Regression at the patient-level was used to evaluate the effect of explanatory health variables on the failure of implants up to abutment connection, i.e. health factors there are inherently associated to the patient, not to the implant.
2 3 4 5 6 7 8 9 10 11 12 13 14 15 16 17 18 19 20 21 22 23 24 25 26 27 28 29 30 31 32 33 34 35 36 37 38 39 40 41 42 43 44 45 46 47 48 49 50 51 52 53 54 55 56 57 58 59
For Peer Review
First, a univariate effect of each health factor on the implant failure was evaluated. Odds ratios (OR) and their 95% confidence intervals (CI) were computed. The Wald test based on robust standard errors was used to assess the significance of each factor. A factor was excluded from further multivariate analysis if the univariate logistic regression resulted in a clearly non-significant odds ratio (P > 0.1). In the second step a multivariate logistic regression gave the effects on different risk factors when controlling for other factors. The results of the final model were presented as an estimated OR of each significant prognostic variable (P < 0.05).
An implant-level model having the implant as the statistical unit was performed in order to assess the effects of the implant-related and local bone factor on the failure of implants up to abutment connection, also including the health variables. A generalized estimating equation (GEE) method was used to account for the fact that repeated observations (several implants) were available for a single patient. Because the outcome relating to implants within a single patient must be more closely correlated to each other than implants in separate patients, ignoring these correlations could result in a bias in P-value computations (Shintani, 2014). All models were adjusted for clustering of subject and implants in a binary logistic regression model using GEE with a binomial distribution and a logit link function, while assuming an exchangeable working correlation structure to assess the relationship between implant failure up to abutment connection (dependent variable) and the risk factors (independent variables). Initially a univariate GEE on each of the variables was performed. In order to verify multicollinearity, a correlation matrix of all of the predictor variables with a significant odds ratio (P-value cut-off point of 0.1) identified in the univariate GEE was scanned, to see whether there were some high correlations among the predictors. Collinearity statistics obtaining variance inflation factor (VIF) and tolerance statistic were also performed to detect more subtle forms of multicollinearity. Then a multivariable model with a forced entry method was used to evaluate the effect of the factors that were univariately significant (P < 0.1) and didn’t present multicollinearity. A Wald chi-square test was used to analyze the statistical significance of each parameter within the model. The results of the final model were presented as an estimated OR of each significant prognostic variable (P < 0.05).
All data were statistically analyzed using the Statistical Package for the Social Sciences (SPSS) version 22 software (SPSS Inc., Chicago, IL, USA).
Results 2 3 4 5 6 7 8 9 10 11 12 13 14 15 16 17 18 19 20 21 22 23 24 25 26 27 28 29 30 31 32 33 34 35 36 37 38 39 40 41 42 43 44 45 46 47 48 49 50 51 52 53 54 55 56 57 58 59
For Peer Review
Overall, 642 of 10,096 implants (6.36%) failed. From this total of 642 lost implants, 176 implants in 139 patients (65 men and 74 women, mean age of 54.1±16.3 years (minimum 17.7, maximum 90.1) at the time of implant surgery) were lost up to the 2nd stage surgery. This corresponds to a failure rate up to abutment connection of 1.74% at the implant level and 5.21% at the patient level. The location of the implants was as follows: 73 in the anterior maxilla, 36 in the anterior mandible, 44 in the posterior maxilla, and 23 in the posterior mandible. Only 4 out of the 176 failures up to the abutment connection occurred in non-submerged implants with a delayed loading protocol.
Table 1 shows a comparison of groups of implants failed up to and after abutment connection according to the distribution of implants with regard to the Lekholm and Zarb (Lekholm and Zarb, 1985) classification of bone quantity and quality. It can be observed that the distribution of implants in sites of different bone quantities/qualities was quite similar between the groups.
The univariate binary logistic regression showed that the following predictors had a statistically significant odds ratio at the patient-level (Table 2): smoking (P<0.001), number of cigarettes per day (P=0.002), the intake of antidepressants (P=0.002), and age of the patient at the time of the surgery (P=0.001). After only the variables with a statistically significant odds ratio were included in the multivariate binary logistic regression model (Table 3), smoking (P=0.003) and the intake of antidepressants (P=0.009) continued to present a statistically significant odds ratio.
The univariate GEE model showed that the following predictors had a statistically significant odds ratio at the implant-level (Table 4): smoking (P<0.001), number of cigarettes per day (P=0.040), hypothyroidism (P=0.065), the intake of antidepressants (P=0.046), implant jaw location (P=0.064), bone quantity (quantity A as the reference category; quantity C, P=0.039; quantity D, P<0.001; quantity E, P<0.001), bone quality (quality 1 as the reference category; quality 4, P=0.034), implant surface (P<0.001), implant system (Nobel turned as the reference category; Nobel TiUnite, P=0.002), and bone graft procedures (P=0.009). After only the variables with a statistically significant odds ratio were included in the multivariate GEE model (Table 5), only smoking (P=0.022) continued to present a statistically significant odds ratio.
As none of the patients who presented a failure before abutment connection was taking bisphosphonates, this variable was not included in any statistical model.
2 3 4 5 6 7 8 9 10 11 12 13 14 15 16 17 18 19 20 21 22 23 24 25 26 27 28 29 30 31 32 33 34 35 36 37 38 39 40 41 42 43 44 45 46 47 48 49 50 51 52 53 54 55 56 57 58 59
For Peer Review
DiscussionThe aim of the present study was to assess the influence of local and systemic factors on the occurrence of implant failures up to the 2nd stage surgery. As the study of failures only before the abutment connection limits the observation to the stage before the prosthetic treatment, confounding factors are eliminated. The regression analyses performed in this study tried to identify the factors that could possibly be related to implant failure. The univariate regression assessed the relationship between each independent variable and implant failure separately, and the multivariate regression assessed the relationship of the variables that were univariately significant to implant failure, controlling for each other. In the multivariate model, only two variables were shown to exert some significant effect on the failures up to abutment connection: the intake of antidepressant drugs at the patient-level analysis and smoking at both the implant- and patient-level analysis.
The first one was the intake of antidepressants, and there are biochemical and clinical evidence suggesting a relationship between the intake of such medicaments and the impairment of bone metabolism, which in theory could interfere with the osseointegration process. From the biochemical point of view, it is possible that neuroendocrine mechanisms related to the serotonin system could regulate osteoclast differentiation/activation, because osteoclasts derive from hematopoietic cell precursors and a relationship between bone and the immune system has been established (Bab and Einhorn, 1993; Ershler et al., 1997; Gruber, 1991). Studies have identified a functional serotonin system in osteoblasts and osteoclasts (Battaglino et al., 2004; Bliziotes et al., 2001; Westbroek et al., 2001), in which the serotonin transporter and several receptors are expressed in osteoblasts as well as in osteoclasts (Bliziotes et al., 2001; Westbroek et al., 2001). The presence of serotonin receptors and the serotonin transporter in bone raises the question whether medications that antagonize serotonin reuptake could influence bone metabolism. Peripheral serotonin signaling directly activates osteoblastic serotonin receptors to inhibit bone formation. Central serotonin signaling inhibits the sympathetic nervous system, thus alleviating the negative adrenergic tone on osteoblasts. In the situation of elevated serotonin levels that result from treatment with selective serotonin reuptake inhibitors (SSRIs - a class of antidepressant drugs), the negative skeletal effects of peripheral serotonin may outweigh the positive skeletal benefits resulting from the enhanced central serotonin antidepressant and antisympathetic activity (Ducy and Karsenty, 2010). 2 3 4 5 6 7 8 9 10 11 12 13 14 15 16 17 18 19 20 21 22 23 24 25 26 27 28 29 30 31 32 33 34 35 36 37 38 39 40 41 42 43 44 45 46 47 48 49 50 51 52 53 54 55 56 57 58 59
For Peer Review
It has been shown in in vitro studies that activity of the serotonin transporter is required for osteoclast differentiation. While blockage of the serotonin transporter reduced osteoclast differentiation when fluoxetine, an antidepressant, was administered to produce µM concentrations (Battaglino et al., 2004; Gustafsson et al., 2006), there was an increase in osteoclast differentiation for the same medicament in the nM concentrations (Gustafsson et al., 2006). In vivo studies demonstrated detrimental effects of fluoxetine on trabecular architecture (Warden et al., 2008) and on bone mineral density (Warden et al., 2005; Warden et al., 2008) in mice. Another in vivo study showed that serotonin acts on osteoblasts inhibiting their proliferation (Yadav et al., 2008). These studies in animal models indicate a negative effect of SSRIs on bone mass and suggest that these antidepressants may possess direct anti-anabolic skeletal effects, through the pharmacological inhibition of the serotonin transporter.
From the clinical point of view, an association between antidepressants and decreased bone mineral density (BMD) in humans has been suggested (Cauley et al., 2005; Richards et al., 2007; Williams et al., 2008). Moreover, bone mass has been shown to remain negatively associated with not only clinical depression but depressive symptoms (Robbins et al., 2001; Williams et al., 2011). Bone quality has also been shown to be reduced among men and younger women with a history of mood disorders (Williams et al., 2013).
In some studies smoking has been associated with depression (Escobedo et al., 1998; Hall et al., 1993). And in the present study smoking was identified as the other predictor to exert some statistically significant effect on the failures up to abutment connection. A recent meta-analysis analyzing more than 100 studies has shown that failures of implants inserted in smokers are 2.23 times more likely to happen than failures of implants inserted in non-smokers (Chrcanovic et al., 2015). The increase of implant failure rates due to smoking is hypothesized to be related mainly to the effect of smoking in osteogenesis and angiogenesis (Ma et al., 2010). Concerning the effects on osteogenesis, Ma et al. (Ma et al., 2011) showed that nicotine inhibited the gene expression of BMP-2, TGF-b1, PDGF-AA and VEGF in osteoblasts. BMP-2 is the most potent osteogenic induction factor regulating osteoblast differentiation, ALP expression and subsequent mineralization (Rawadi et al., 2003). TGF-b1 is produced by osteoblasts and incorporated into the bone matrix. During bone remodeling, TGF-b1 plays an important role in the regulation of osteoblast proliferation, differentiation and apoptosis, with subsequent important effects on bone formation and remodeling (Deng et al., 2008). PDGF and VEGF have angiogenic effects during bone healing (De la Riva et al., 2010). Whereas their expression can be detected in osteoblasts, they are considered to be able
2 3 4 5 6 7 8 9 10 11 12 13 14 15 16 17 18 19 20 21 22 23 24 25 26 27 28 29 30 31 32 33 34 35 36 37 38 39 40 41 42 43 44 45 46 47 48 49 50 51 52 53 54 55 56 57 58 59
For Peer Review
to regulate osteoblast activity as well. VEGF can interact synergistically with bone morphogenetic protein (BMP) to promote skeletal development and bone healing by enhancing cell recruitment, prolonging cell survival, and increasing angiogenesis (Patel et al., 2008). BMP acts as an important regulator that stimulates production of VEGF in osteoblasts (Samee et al., 2008). Therefore, the inhibitive effect of nicotine on osteoblastic activity may contribute to the failure of dental implant osseointegration (Ma et al., 2011).
In addition, some studies showed that osteogenesis and angiogenesis are tightly coupled during bone formation, and angiogenesis plays a pivotal role in skeletal development and bone repair (Fang et al., 2005). Besides carrying oxygen and nutrients to bone tissue, blood flow play an active role in bone formation and remodeling by mediating the interactions among osteoblasts, osteocytes, osteoclasts, and vascular cells at a variety of levels (Fleming et al., 2001). The deleterious effects of smoking have not only been shown on osteoblasts, but also on the microcirculation, including morphologic aspects, particularly vessel wall injury and capillary loss and functional aspects, predominantly changes in tissue perfusion and its regulatory mechanisms, notable reactive hyperemia, and sequestration of blood cells in the microcirculation (Lehr, 2000). Studies (Ma et al., 2007; Ma et al., 2010) demonstrated that nicotine exposure has direct effects on blood vessels, producing vasoconstriction and systemic venoconstriction, which decreases blood perfusion and causes low oxygen and ischemia, which is the major stimulus for initiating the angiogenic cascade (Wang et al., 2007). Hypoxia and ischemia owing to nicotine exposure could stimulate HIF-1α expression, leading to an increased expression of VEGF, which, in turn, stimulates angiogenesis. However, the enhanced vessel formation is incapable of compensating for the adverse effect of the reduced blood flow possibly caused by nicotine-induced vasoconstriction (Ma et al., 2010). And even though the increased expression of VEGF caused by hypoxia and ischemia may stimulate angiogenesis, it may also contribute to the compromised bone healing, due to the fact that excessive VEGF may lead to impairment in bone formation, possibly by promoting mesenchymal stem cell differentiation toward an endothelial lineage (Kon et al., 2001), consequently reducing the availability of mesenchymal stem cells (MSCs) for osteogenic differentiation (Keramaris et al., 2008). Alternatively, excessive VEGF may increase recruitment of osteoclasts into the bone-regeneration sites and lead to an excessive bone resorption (Keramaris et al., 2008). Another fact that should also be taken into consideration is that the inflammatory response to bone trauma plays an important role in initiating the repair cascade. The trauma activates downstream factors such as cytokines and growth factors that recruit osteoprogenitor and mesenchymal cells to the injury site (Kon et al., 2001;
2 3 4 5 6 7 8 9 10 11 12 13 14 15 16 17 18 19 20 21 22 23 24 25 26 27 28 29 30 31 32 33 34 35 36 37 38 39 40 41 42 43 44 45 46 47 48 49 50 51 52 53 54 55 56 57 58 59
For Peer Review
Mountziaris and Mikos, 2008). The problem is that nicotine is an anti-inflammatory agent (Geng et al., 1996).
Concerning the bone quantity/quality of the implant site, as the distribution of implants that failed up to abutment connection of was similar to the implants failing after this procedure, it can be suggested that poor bone was not a determinant factor to influence an early failure for the patients of the present study.
The limitations of the present study include the fact that this is a retrospective study, which inherently results in flaws. These problems were manifested by the gaps in information and incomplete records. As all data rely on the accuracy of the original examination and documentation, items may have been excluded in the initial examination or not recorded in the dental/medical chart. The lack of specific information characterizing the patients’ systemic conditions status and the medications dosage are limitations also connected to the retrospective nature of this study. It is also important to stress that the different classes of antidepressants were prescribed to the patients of the present study. Antidepressants are a large family of drugs, some of which have different biological properties and mechanisms of action, which might have differently affected the bone metabolism, and consequently the failures of dental implants. It can be said that the present results might be applicable to the general population, since all patients ever treated with dental implants in the clinic were included in the database from which the implants with early failures were analyzed. No patient was excluded, regardless of any health or other condition. For that reason, selection bias was also minimized.
Conclusions
Smoking and the intake of antidepressants are suggested to be potential influencing factors to the occurrence of implant failures up to abutment connection.
2 3 4 5 6 7 8 9 10 11 12 13 14 15 16 17 18 19 20 21 22 23 24 25 26 27 28 29 30 31 32 33 34 35 36 37 38 39 40 41 42 43 44 45 46 47 48 49 50 51 52 53 54 55 56 57 58 59
For Peer Review
AcknowledgementsFunding and support: This work was supported by research funds from the Oral Health Related Research by Region Skåne (Odontologisk Forskning i Region Skåne, OFRS 414321), Sweden, and from the Scientific Research Council of Sweden (Vetenskapsrådet, Dnr 2015-02971). This work was supported by Folktandvården AB, Region Skåne, Sweden and by CNPq, Conselho Nacional de Desenvolvimento Científico e Tecnológico, Brazil.
Trial registration at the U.S. National Institutes of Health (clinicaltrials.gov): NCT02369562 Declaration of conflicting interests: There are no conflicts of interest to declare.
References
Alsaadi G, Quirynen M, Komarek A, van Steenberghe D. 2007. Impact of local and systemic factors on the incidence of oral implant failures, up to abutment connection. J Clin Periodontol. 34(7):610-617.
Bab IA, Einhorn TA. 1993. Regulatory role of osteogenic growth polypeptides in bone formation and hemopoiesis. Crit Rev Eukaryot Gene Expr. 3(1):31-46.
Battaglino R, Fu J, Spate U, Ersoy U, Joe M, Sedaghat L, Stashenko P. 2004. Serotonin regulates osteoclast differentiation through its transporter. J Bone Miner Res. 19(9):1420-1431.
Bliziotes MM, Eshleman AJ, Zhang XW, Wiren KM. 2001. Neurotransmitter action in osteoblasts: expression of a functional system for serotonin receptor activation and reuptake. Bone. 29(5):477-486.
Cauley JA, Fullman RL, Stone KL, Zmuda JM, Bauer DC, Barrett-Connor E, Ensrud K, Lau EM, Orwoll ES. 2005. Factors associated with the lumbar spine and proximal femur bone mineral density in older men. Osteoporos Int. 16(12):1525-1537.
Chrcanovic BR, Albrektsson T, Wennerberg A. 2014. Reasons for failures of oral implants. J Oral Rehabil. 41(6):443-476.
Chrcanovic BR, Albrektsson T, Wennerberg A. 2015. Smoking and dental implants: A systematic review and meta-analysis. J Dent. 43(5):487-498.
De la Riva B, Sanchez E, Hernandez A, Reyes R, Tamimi F, Lopez-Cabarcos E, Delgado A, Evora C. 2010. Local controlled release of VEGF and PDGF from a combined brushite-chitosan system enhances bone regeneration. J Control Release. 143(1):45-52.
2 3 4 5 6 7 8 9 10 11 12 13 14 15 16 17 18 19 20 21 22 23 24 25 26 27 28 29 30 31 32 33 34 35 36 37 38 39 40 41 42 43 44 45 46 47 48 49 50 51 52 53 54 55 56 57 58 59
For Peer Review
Deng ZL, Sharff KA, Tang N, Song WX, Luo J, Luo X, Chen J, Bennett E, Reid R, Manning D, Xue A, Montag AG, Luu HH, Haydon RC, He TC. 2008. Regulation of osteogenic differentiation during skeletal development. Front Biosci. 13(2001-2021.
Ducy P, Karsenty G. 2010. The two faces of serotonin in bone biology. J Cell Biol. 191(1):7-13.
Ershler WB, Harman SM, Keller ET. 1997. Immunologic aspects of osteoporosis. Dev Comp Immunol. 21(6):487-499.
Escobedo LG, Reddy M, Giovino GA. 1998. The relationship between depressive symptoms and cigarette smoking in US adolescents. Addiction. 93(3):433-440.
Fang TD, Salim A, Xia W, Nacamuli RP, Guccione S, Song HM, Carano RA, Filvaroff EH, Bednarski MD, Giaccia AJ, Longaker MT. 2005. Angiogenesis is required for successful bone induction during distraction osteogenesis. J Bone Miner Res. 20(7):1114-1124. Fleming JT, Barati MT, Beck DJ, Dodds JC, Malkani AL, Parameswaran D, Soukhova GK,
Voor MJ, Feitelson JB. 2001. Bone blood flow and vascular reactivity. Cells Tissues Organs. 169(3):279-284.
Geng Y, Savage SM, Razani-Boroujerdi S, Sopori ML. 1996. Effects of nicotine on the immune response. II. Chronic nicotine treatment induces T cell anergy. J Immunol. 156(7):2384-2390.
Gruber HE. 1991. Bone and the immune system. Proc Soc Exp Biol Med. 197(3):219-225. Gustafsson BI, Thommesen L, Stunes AK, Tommeras K, Westbroek I, Waldum HL, Slordahl
K, Tamburstuen MV, Reseland JE, Syversen U. 2006. Serotonin and fluoxetine modulate bone cell function in vitro. J Cell Biochem. 98(1):139-151.
Hall SM, Munoz RF, Reus VI, Sees KL. 1993. Nicotine, negative affect, and depression. J Consult Clin Psychol. 61(5):761-767.
Keramaris NC, Calori GM, Nikolaou VS, Schemitsch EH, Giannoudis PV. 2008. Fracture vascularity and bone healing: a systematic review of the role of VEGF. Injury. 39(Suppl 2):S45-57.
Kon T, Cho TJ, Aizawa T, Yamazaki M, Nooh N, Graves D, Gerstenfeld LC, Einhorn TA. 2001. Expression of osteoprotegerin, receptor activator of NF-kappaB ligand (osteoprotegerin ligand) and related proinflammatory cytokines during fracture healing. J Bone Miner Res. 16(6):1004-1014.
Lehr HA. 2000. Microcirculatory dysfunction induced by cigarette smoking. Microcirculation. 7(6 Pt 1):367-384. 2 3 4 5 6 7 8 9 10 11 12 13 14 15 16 17 18 19 20 21 22 23 24 25 26 27 28 29 30 31 32 33 34 35 36 37 38 39 40 41 42 43 44 45 46 47 48 49 50 51 52 53 54 55 56 57 58 59
For Peer Review
Lekholm U, Zarb GA (1985). Patient selection and preparation. In: Tissue integrated prostheses: osseointegration in clinical dentistry. PI Brånemark, GA Zarb and T Albrektsson editors. Chicago: Quintessence Publishing Company, pp. 199–209.
Ma L, Zheng LW, Cheung LK. 2007. Inhibitory effect of nicotine on bone regeneration in mandibular distraction osteogenesis. Front Biosci. 12:3256-3262.
Ma L, Zheng LW, Sham MH, Cheung LK. 2010. Uncoupled angiogenesis and osteogenesis in nicotine-compromised bone healing. J Bone Miner Res. 25(6):1305-1313.
Ma L, Zwahlen RA, Zheng LW, Sham MH. 2011. Influence of nicotine on the biological activity of rabbit osteoblasts. Clin Oral Implants Res. 22(3):338-342.
Mountziaris PM, Mikos AG. 2008. Modulation of the inflammatory response for enhanced bone tissue regeneration. Tissue Eng Part B Rev. 14(2):179-186.
Patel ZS, Young S, Tabata Y, Jansen JA, Wong ME, Mikos AG. 2008. Dual delivery of an angiogenic and an osteogenic growth factor for bone regeneration in a critical size defect model. Bone. 43(5):931-940.
Rawadi G, Vayssiere B, Dunn F, Baron R, Roman-Roman S. 2003. BMP-2 controls alkaline phosphatase expression and osteoblast mineralization by a Wnt autocrine loop. J Bone Miner Res. 18(10):1842-1853.
Richards JB, Papaioannou A, Adachi JD, Joseph L, Whitson HE, Prior JC, Goltzman D. 2007. Effect of selective serotonin reuptake inhibitors on the risk of fracture. Arch Intern Med. 167(2):188-194.
Robbins J, Hirsch C, Whitmer R, Cauley J, Harris T. 2001. The association of bone mineral density and depression in an older population. J Am Geriatr Soc. 49(6):732-736.
Samee M, Kasugai S, Kondo H, Ohya K, Shimokawa H, Kuroda S. 2008. Bone morphogenetic protein-2 (BMP-2) and vascular endothelial growth factor (VEGF) transfection to human periosteal cells enhances osteoblast differentiation and bone formation. J Pharmacol Sci. 108(1):18-31.
Shintani A. 2014. Primer of statistics in dental research: Part II. J Prosthodont Res. 58(2):85-91.
Wang Y, Wan C, Deng L, Liu X, Cao X, Gilbert SR, Bouxsein ML, Faugere MC, Guldberg RE, Gerstenfeld LC, Haase VH, Johnson RS, Schipani E, Clemens TL. 2007. The hypoxia-inducible factor alpha pathway couples angiogenesis to osteogenesis during skeletal development. J Clin Invest. 117(6):1616-1626.
2 3 4 5 6 7 8 9 10 11 12 13 14 15 16 17 18 19 20 21 22 23 24 25 26 27 28 29 30 31 32 33 34 35 36 37 38 39 40 41 42 43 44 45 46 47 48 49 50 51 52 53 54 55 56 57 58 59
For Peer Review
Warden SJ, Robling AG, Sanders MS, Bliziotes MM, Turner CH. 2005. Inhibition of the serotonin (5-hydroxytryptamine) transporter reduces bone accrual during growth. Endocrinology. 146(2):685-693.
Warden SJ, Nelson IR, Fuchs RK, Bliziotes MM, Turner CH. 2008. Serotonin (5-hydroxytryptamine) transporter inhibition causes bone loss in adult mice independently of estrogen deficiency. Menopause. 15(6):1176-1183.
Westbroek I, van der Plas A, de Rooij KE, Klein-Nulend J, Nijweide PJ. 2001. Expression of serotonin receptors in bone. J Biol Chem. 276(31):28961-28968.
Williams LJ, Henry MJ, Berk M, Dodd S, Jacka FN, Kotowicz MA, Nicholson GC, Pasco JA. 2008. Selective serotonin reuptake inhibitor use and bone mineral density in women with a history of depression. Int Clin Psychopharmacol. 23(2):84-87.
Williams LJ, Bjerkeset O, Langhammer A, Berk M, Pasco JA, Henry MJ, Schei B, Forsmo S. 2011. The association between depressive and anxiety symptoms and bone mineral density in the general population: the HUNT Study. J Affect Disord. 131(1-3):164-171. Williams LJ, Pasco JA, Jacka FN, Hodge JM, Kotowicz MA, Berk M. 2013. Quantitative
Heel Ultrasound (QUS) measures of bone quality in association with mood and anxiety disorders. J Affect Disord. 146(3):395-400.
Yadav VK, Ryu JH, Suda N, Tanaka KF, Gingrich JA, Schutz G, Glorieux FH, Chiang CY, Zajac JD, Insogna KL, Mann JJ, Hen R, Ducy P, Karsenty G. 2008. Lrp5 controls bone formation by inhibiting serotonin synthesis in the duodenum. Cell. 135(5):825-837.
2 3 4 5 6 7 8 9 10 11 12 13 14 15 16 17 18 19 20 21 22 23 24 25 26 27 28 29 30 31 32 33 34 35 36 37 38 39 40 41 42 43 44 45 46 47 48 49 50 51 52 53 54 55 56 57 58 59
For Peer Review
TablesTable 1. Comparison of group of implants that failed up to and after abutment connection, according to the distribution of implants with regard to Lekholm and Zarb* (1985) classification of bone quantity and quality.
Up to abutment connection A B C D E Total % 1 0 0 1 6 1 8 4.8 2 4 30 10 3 2 49 29.7 3 6 29 26 12 1 74 44.9 4 0 4 12 10 8 34 20.6 Total 10 63 49 31 12 165 100 % 6.0 38.2 29.7 18.8 7.3 100
Missing information of bone quantity/quality: 11 implants
After abutment connection
A B C D E Total % 1 0 1 5 0 1 7 1.5 2 7 67 37 12 3 126 27.8 3 9 72 85 51 7 224 49.3 4 0 16 24 32 25 97 21.4 Total 16 156 151 95 36 454 100 % 3.5 34.4 33.3 20.9 7.9 100
Missing information of bone quantity/quality: 12 implants
* According to the Lekholm and Zarb (1985) classification, bone quality is broken down into four groups according to the proportion and structure of compact and trabecular bone tissue: type 1 = large homogenous cortical/compact bone; type 2 = thick layer of compact bone surrounding a dense trabecular bone; type 3 = thin cortical layer surrounding a dense trabecular bone; type 4 = thin cortical layer surrounding a core of low-density trabecular bone. The quantity of jawbone is broken down into five groups (A, B, C, D, and E), based on the residual jaw shape following tooth extraction. Bone classified as ‘A’ presents the largest amount of bone among all classes, whereas bone classified as ‘E’ presents the lowest volume of bone.
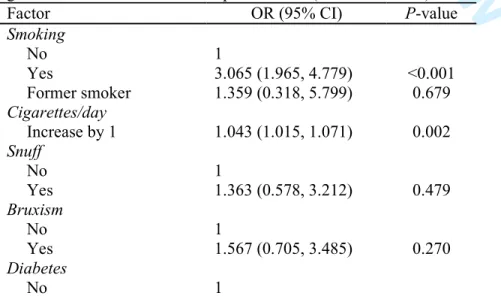
Table 2. Univariate binary logistic regression for implant failure up to abutment connection: gender and health factors at the patient-level (OR – odds ratio).
Factor OR (95% CI) P-value Smoking No 1 Yes 3.065 (1.965, 4.779) <0.001 Former smoker 1.359 (0.318, 5.799) 0.679 Cigarettes/day Increase by 1 1.043 (1.015, 1.071) 0.002 Snuff No 1 Yes 1.363 (0.578, 3.212) 0.479 Bruxism No 1 Yes 1.567 (0.705, 3.485) 0.270 Diabetes No 1 2 3 4 5 6 7 8 9 10 11 12 13 14 15 16 17 18 19 20 21 22 23 24 25 26 27 28 29 30 31 32 33 34 35 36 37 38 39 40 41 42 43 44 45 46 47 48 49 50 51 52 53 54 55 56 57 58 59
For Peer Review
Type I 0.775 (0.104, 5.775) 0.804 Type II 1.576 (0.708, 3.507) 0.265
High blood pressure
No 1 Yes 0.948 (0.580, 1.551) 0.832 High cholesterol No 1 Yes 0.893 (0.442, 1.807) 0.754 Hypothyroidism No 1 Yes 0.429 (0.104, 1.768) 0.241 Asthma No 1 Yes 1.471 (0.722, 2.997) 0.288 Intake of antidepressants No 1 Yes 2.477 (1.385, 4.429) 0.002 Irradiation No 1 Yes 1.076 (0.255, 4.534) 0.920
Hormone replacement therapy
No 1 Yes 1.452 (0.516, 4.086) 0.480 Gastric No 1 Yes 1.569 (0.739, 3.330) 0.241 Antithrombotics No 1 Yes 1.476 (0.875, 2.489) 0.145 Immunosuppressive No 1 Yes 0.845 (0.113, 6.321) 0.870 Psoriasis No 1 Yes 2.719 (0.612, 12.076) 0.189 Gender Male 1 Female 0.980 (0.696, 1.380) 0.909 Age Increase by 1 1.014 (1.006, 1.023) 0.001
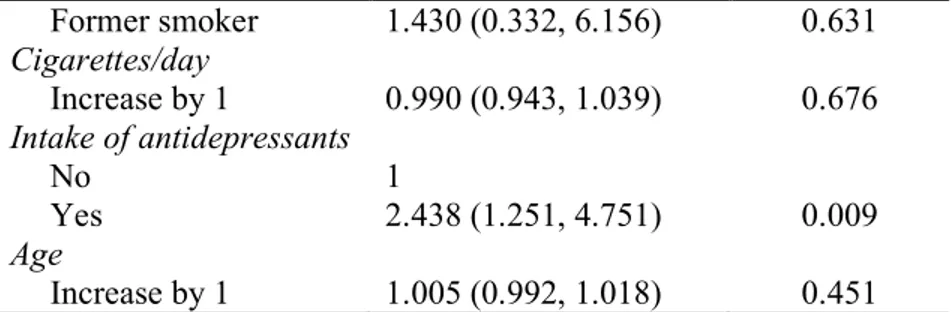
Table 3. Multivariate logistic regression model for implant failure up to abutment connection at the patient-level. Only the patient and health factors that were considered statistically significant (P < 0.1) in the univariate model and didn’t present multicollinearity were included in the multivariate model (OR – odds ratio).
Factor OR (95% CI) P-value Smoking No 1 Yes 3.265 (1.486, 7.173) 0.003 2 3 4 5 6 7 8 9 10 11 12 13 14 15 16 17 18 19 20 21 22 23 24 25 26 27 28 29 30 31 32 33 34 35 36 37 38 39 40 41 42 43 44 45 46 47 48 49 50 51 52 53 54 55 56 57 58 59
For Peer Review
Former smoker 1.430 (0.332, 6.156) 0.631 Cigarettes/day Increase by 1 0.990 (0.943, 1.039) 0.676 Intake of antidepressants No 1 Yes 2.438 (1.251, 4.751) 0.009 Age Increase by 1 1.005 (0.992, 1.018) 0.451Table 4. Risk factor analysis for implant failure up to abutment connection using a univariate generalized estimating equations (GEE) logistic regression model, at the implant-level (OR – odds ratio).
Factor Failure/survival* OR (95% CI) P-value Smoking No 232/4125 1 Yes 180/1838 2.709 (1.737, 4.226) <0.001 Former smoker 14/186 2.159 (0.463, 10.070) 0.327 Cigarettes/day Increase by 1 1.024 (1.001, 1.048) 0.040 Snuff No 380/5824 1 Yes 27/247 2.063 (0.829, 5.139) 0.120 Bruxism No 361/6320 1 Yes 85/342 1.386 (0.611, 3.142) 0.434 Gender Male 289/4471 1 Female 353/4983 1.034 (0.716, 1.494) 0.857 Diabetes No 404/6037 1 Type I 7/110 0.585 (0.085, 4.051) 0.588 Type II 33/477 1.574 (0.669, 3.703) 0.298
High blood pressure
No 295/4498 1 Yes 147/2101 0.857 (0.508, 1.445) 0.563 High cholesterol No 365/5652 1 Yes 76/910 0.806 (0.362, 1.793) 0.596 Hypothyroidism No 419/6210 1 Yes 24/358 0.274 (0.069, 1.086) 0.065 Asthma No 412/6056 1 Yes 35/527 1.559 (0.751, 3.237) 0.233 Intake of antidepressants No 358/5991 1 Yes 94/584 1.735 (1.010, 2.980) 0.046 Irradiation No 434/6443 1 Yes 12/172 0.760 (0.188, 3.080) 0.701 2 3 4 5 6 7 8 9 10 11 12 13 14 15 16 17 18 19 20 21 22 23 24 25 26 27 28 29 30 31 32 33 34 35 36 37 38 39 40 41 42 43 44 45 46 47 48 49 50 51 52 53 54 55 56 57 58 59
For Peer Review
Hormone replacement therapy
No 508/7750 1 Yes 20/227 1.472 (0.478, 4.540) 0.501 Gastric No 368/5990 1 Yes 58/475 1.059 (0.510, 2.199) 0.877 Antithrombotics No 304/5224 1 Yes 128/1322 1.276 (0.729, 2.233) 0.394 Immunosuppressive No 422/6428 1 Yes 8/87 0.614 (0.092, 4.097) 0.615 Psoriasis No 428/6448 1 Yes 3/72 1.974 (0.500, 7.796) 0.332 Age Increase by 1 0.997 (0.989, 1.005) 0.463 Implant diameter Increase by 1 0.982 (0.455, 2.118) 0.963 Implant length Increase by 1 0.945 (0.862, 1.036) 0.230 Implant design Cylindrical 631/9018 1 Conical 11/436 0.798 (0.357, 1.787) 0.584 Location Maxilla 473/5303 1 Mandible 169/4151 0.701 (0.481, 1.021) 0.064 Anterior 390/5702 1 Posterior 252/3752 1.001 (0.708, 1.414) 0.997 Bone quantity A 26/1247 1 B 219/4482 1.730 (0.803, 3.730) 0.162 C 200/2619 2.255 (1.042, 4.879) 0.039 D 126/735 4.714 (2.050, 10.840) <0.001 E 48/122 10.777 (4.221, 27.518) <0.001 Bone quality 1 15/371 1 2 175/4089 0.674 (0.213, 2.139) 0.504 3 298/4234 0.952 (0.317, 2.861) 0.930 4 131/511 3.399 (1.097, 10.537) 0.034 Reoperation No 596/9326 1 Yes 46/128 0.824 (0.084, 8.071) 0.868 Implant surface Turned 493/5255 1 Enlarged 149/4199 0.494 (0.341, 0.716) <0.001 Implant system Nobel turned 493/5255 1 Nobel TiUnite 102/2818 0.501 (0.326, 0.768) 0.002 Astra TiOblast 24/367 0.752 (0.314, 1.798) 0.522 2 3 4 5 6 7 8 9 10 11 12 13 14 15 16 17 18 19 20 21 22 23 24 25 26 27 28 29 30 31 32 33 34 35 36 37 38 39 40 41 42 43 44 45 46 47 48 49 50 51 52 53 54 55 56 57 58 59
For Peer Review
Astra Osseospeed 4/204 0.266 (0.041, 1.749) 0.168 Straumann 9/325 0.324 (0.084, 1.248) 0.101 XIVE/Frialit-2 6/260 0.579 (0.185, 1.813) 0.348 Other 4/226 0.373 (0.094, 1.417) 0.159 Antibiotics No 47/574 1 Yes 242/4309 0.773 (0.410, 1.458) 0.427 Bone grafting No 550/8980 1 Yes 91/473 2.274 (1.226, 4.216) 0.009Reason for tooth extraction
Periodontal disease 52/892 1
Fracture/trauma 27/558 1.006 (0.331, 3.060) 0.991 Advanced caries 9/236 1.453 (0.389, 5.424) 0.579 Agenesia 25/791 2.152 (0.888, 5.216) 0.102 Other 6/199 1.129 (0.245, 5.206) 0.876 * The information for some conditions is unknown for a variable number of implants
Table 5. Multivariate generalized estimating equations (GEE) logistic regression model at the implant-level. Only the factors that were considered statistically significant (P < 0.1) in the univariate model and didn’t present multicollinearity were included in the multivariate model (OR – odds ratio).
Factor OR (95% CI) P-value Smoking No 1 Yes 2.120 (1.113, 4.037) 0.022 Former smoker 2.129 (0.338, 13.411) 0.421 Cigarettes/day Increase by 1 0.987 (0.952, 1.023) 0.463 Hypothyroidism No 1 Yes 0.508 (0.131, 1.966) 0.327 Intake of antidepressants No 1 Yes 1.742 (0.856, 3.542) 0.126 Location Maxilla 1 Mandible 0.805 (0.421, 1.537) 0.510 Bone quantity A 1 B 2.838 (0.779, 10.343) 0.114 C 2.538 (0.670, 9.621) 0.171 D 3.621 (0.804, 16.308) 0.094 E 2.197 (0.267, 18.052) 0.464 Bone quality 1 1 2 1.176 (0.168, 8.233) 0.870 3 1.471 (0.202, 10.696) 0.703 4 4.679 (0.591, 37.050) 0.144 2 3 4 5 6 7 8 9 10 11 12 13 14 15 16 17 18 19 20 21 22 23 24 25 26 27 28 29 30 31 32 33 34 35 36 37 38 39 40 41 42 43 44 45 46 47 48 49 50 51 52 53 54 55 56 57 58 59
For Peer Review
Implant surface Turned 1 Enlarged 0.642 (0.339, 1.213) 0.172 Implant system Nobel turned 1 Nobel TiUnite 0.642 (0.339, 1.213) 0.172 Astra TiOblast 0.602 (0.152, 2.380) 0.469 Astra Osseospeed 0.515 (0.065, 4.098) 0.530 Straumann 0.311 (0.040, 2.397) 0.262 XIVE/Frialit-2 1.339 (0.264, 6.800) 0.725 Others 0.316 (0.048, 2.094) 0.232 Bone grafting No 1 Yes 1.680 (0.805, 3.507) 0.167 2 3 4 5 6 7 8 9 10 11 12 13 14 15 16 17 18 19 20 21 22 23 24 25 26 27 28 29 30 31 32 33 34 35 36 37 38 39 40 41 42 43 44 45 46 47 48 49 50 51 52 53 54 55 56 57 58 59For Peer Review
STROBE Statement—Checklist of items that should be included in reports of cross-sectional studies
Item
No Recommendation
(a) Indicate the study’s design with a commonly used term in the title or the abstract
Title and abstract 1
(b) Provide in the abstract an informative and balanced summary of what was done and what was found
Introduction
Background/rationale 2 Explain the scientific background and rationale for the investigation being reported Objectives 3 State specific objectives, including any prespecified hypotheses
Methods
Study design 4 Present key elements of study design early in the paper
Setting 5 Describe the setting, locations, and relevant dates, including periods of recruitment, exposure, follow-up, and data collection
Participants 6 (a) Give the eligibility criteria, and the sources and methods of selection of participants
Variables 7 Clearly define all outcomes, exposures, predictors, potential confounders, and effect modifiers. Give diagnostic criteria, if applicable
Data sources/ measurement
8* For each variable of interest, give sources of data and details of methods of
assessment (measurement). Describe comparability of assessment methods if there is more than one group
Bias 9 Describe any efforts to address potential sources of bias Study size 10 Explain how the study size was arrived at
Quantitative variables 11 Explain how quantitative variables were handled in the analyses. If applicable, describe which groupings were chosen and why
(a) Describe all statistical methods, including those used to control for confounding (b) Describe any methods used to examine subgroups and interactions
(c) Explain how missing data were addressed
(d) If applicable, describe analytical methods taking account of sampling strategy Statistical methods 12
(e) Describe any sensitivity analyses
Results
(a) Report numbers of individuals at each stage of study—eg numbers potentially eligible, examined for eligibility, confirmed eligible, included in the study, completing follow-up, and analysed
(b) Give reasons for non-participation at each stage Participants 13*
(c) Consider use of a flow diagram
(a) Give characteristics of study participants (eg demographic, clinical, social) and information on exposures and potential confounders
Descriptive data 14*
(b) Indicate number of participants with missing data for each variable of interest Outcome data 15* Report numbers of outcome events or summary measures
(a) Give unadjusted estimates and, if applicable, confounder-adjusted estimates and their precision (eg, 95% confidence interval). Make clear which confounders were adjusted for and why they were included
(b) Report category boundaries when continuous variables were categorized Main results 16
(c) If relevant, consider translating estimates of relative risk into absolute risk for a meaningful time period
Other analyses 17 Report other analyses done—eg analyses of subgroups and interactions, and sensitivity analyses 2 3 4 5 6 7 8 9 10 11 12 13 14 15 16 17 18 19 20 21 22 23 24 25 26 27 28 29 30 31 32 33 34 35 36 37 38 39 40 41 42 43 44 45 46 47 48 49 50 51 52 53 54 55 56 57 58 59 60 OK OK OK OK not applicable OK OK OK OK OK OK OK In abstract OK OK OK OK
OK, only one stage
OK, only one stage not applicable OK OK OK OK not applicable OK OK
For Peer Review
Discussion
Key results 18 Summarise key results with reference to study objectives
Limitations 19 Discuss limitations of the study, taking into account sources of potential bias or imprecision. Discuss both direction and magnitude of any potential bias
Interpretation 20 Give a cautious overall interpretation of results considering objectives, limitations, multiplicity of analyses, results from similar studies, and other relevant evidence Generalisability 21 Discuss the generalisability (external validity) of the study results
Other information
Funding 22 Give the source of funding and the role of the funders for the present study and, if applicable, for the original study on which the present article is based
*Give information separately for exposed and unexposed groups.
Note: An Explanation and Elaboration article discusses each checklist item and gives methodological background and
published examples of transparent reporting. The STROBE checklist is best used in conjunction with this article (freely available on the Web sites of PLoS Medicine at http://www.plosmedicine.org/, Annals of Internal Medicine at
http://www.annals.org/, and Epidemiology at http://www.epidem.com/). Information on the STROBE Initiative is available at www.strobe-statement.org. 2 3 4 5 6 7 8 9 10 11 12 13 14 15 16 17 18 19 20 21 22 23 24 25 26 27 28 29 30 31 32 33 34 35 36 37 38 39 40 41 42 43 44 45 46 47 48 49 50 51 52 53 54 55 56 57 58 59 60 OK OK OK OK OK