1
Chapter 8
Russia: Nationalization achieved through electoral and institutional
engineering
Derek S. Hutcheson and Arjan H. Schakel (2017), ‘Russia: Nationalization Achieved Through Electoral and Institutional Engineering’, in Arjan H. Shakel (ed.), Regional and National Elections in Eastern Europe. Territoriality of the Vote in Ten Countries (Basingstoke: Palgrave): 177-206. [ISBN
978-1-137-51787-6]
Reproduced with permission of Palgrave Macmillan
This extract is taken from the authors’ original manuscript and has not been edited. The definitive, published, version of record is available here: http://www.palgrave.com/gb/book/9781137517869.
Derek S. Hutcheson Arjan H. Schakel
8.1 Introduction
The nationalization of voting behaviour is of particular interest in Russia. As the world’s largest country, spanning the entire Eurasian sub-continent and bordering 16 countries, it has faced the perennial challenge of effectively governing its vast territory. The dynamics of Russian regional governance also exemplify the classical tension between sovereignty and centralization in federal structures. Whilst the constitutional federal structure of Russia has barely altered since 1993 (apart from some amalgamations of neighbouring regions), the degree of centralization has varied widely.
Scholars of the Soviet Union largely focused on politics inside the ‘Garden Ring’ of
Moscow. By contrast, the early post-Soviet years witnessed an explosion of studies in the newly accessible Russian regions (Löwenhardt and White 2007). At first these focused mainly on differential experiences of transformation around the country (e.g., Freidgut and Hahn 1994, Gel’man et al. 2000 and Ruble et al. 2001). By the late 1990s, there was interest in the emergence
2
of variegated types of regional regimes (Gel’man 1999) and the emergence of a decentralized and generally ungovernable system.
Following his election as president in 2000, Vladimir Putin’s earliest reforms focused on the re-establishment of control over this fragmented patchwork of regional regimes. Of particular interest to scholars were the creation of seven new ‘federal districts’ with presidential
plenipotentiaries (Nelson and Kuzes 2003; Petrov 2002; Ross 2002); reform of the representation of the federal subjects in the upper house of parliament (Remington 2003); and the abolition of the regional gubernatorial elections (Goode 2007). The number of detailed studies of individual regions has diminished somewhat compared with the early post-Soviet years, but the focus on the dynamics of regional governance continues (e.g., Chebankova 2009a; Cherkasov 2008; Golosov 2012; Reisinger and Moraski 2013; Ross 2010, 2014; Ryzhenkov 2011; Sharafutdinova 2010; Turovskii 2010; Zakharov 2011).
The relative lack of party involvement in regional politics in Russia in the early post-Soviet years was reflected in the initial paucity of the literature on the subject. Although a few studies focused on individual aspects of regional electoral politics –regional variation in national voting patterns (Clem and Craumer 1997, 1998; Stadelbauer 1996); regional legislative elections (Moses 2003; Slider 1996; Smirnova 1998); party organizations in the regions (Hutcheson 2003); and nationalization of the vote (Ishiyama 2002) –few synthesized all these approaches until
Golosov’s (1999, 2004) pioneering studies on party participation in regional politics, which noted a relative lack of party involvement in local legislative affairs. Since then, studies of regional legislatures have observed the gradual encroachment and eventual domination of them by the Kremlin’s ‘party of power’, Edinaya Rossiya (United Russia) (Golosov 2014a; Panov and Ross 2013).
In this chapter we analyze this phenomenon systematically by studying 204 elections for the lower chamber of regional (sub”ekty) parliaments held between 7 December 2003 and 13
September 2015. The 2000s are particularly interesting decade to study since significant nationalization of the vote has taken place during this period. In the Russian context, nationalization has occurred mainly because of the increasing vote shares won by Edinaya
Rossiya. Despite an overall trend of nationalization, however, we find significant traces of
regionalization of the vote. In other words, the depth and speed of nationalization have been unequal across the territory. In particular, we find that nationalization has been particularly
3
pronounced in ethnic and more populous regions. Furthermore, we find that electoral institutional engineering has facilitated nationalization.
In the next section we will discuss developments in regional government and regional electoral reform since the collapse of the Soviet Union in 1991. In the third section we discuss congruence between regional and federal elections. We explore nationalization of the vote in more detail in section four, and regionalization of the vote in section five. The final section summarizes and concludes.
8.2 Regional government and regional elections
Russia’s regional politics since the break-up of the Soviet Union can be divided into two halves. During the Yeltsin years (1991-99), power was decentralized to the regions in exchange for their political support for the centre, which led to the emergence of strong semi-autonomous regional fiefdoms and an entrenched gubernatorial class. The Putin era has seen re-centralization, starting with efforts (from approximately 2000 to 2004) to create a ‘unified legal space’ out of the disparate regional regimes of the 1990s, and thereafter to establish control over both the executive and legislative arms of power in the regions.
Russia’s basic organizational structure was inherited from the Soviet Union. Originally, there were 89 constituent entities (sub”ekty) until the consolidation of several regions into their larger neighbours from 2004-07. As of 2016, and including the controversial Crimean peninsula,1 the 85 regions of the Russian Federation comprise 22 republics (respubliki); 9 administrative territories (kraya); 46 administrative regions (oblasti), one autonomous region (avtonomnaya
oblast’); four autonomous areas (avtonomnye okruga); and three cities of federal standing
(Moscow, St Petersburg and Sevastopol).
The sub”ekty are highly asymmetrical in terms of rationale, power and size. Republics, autonomous areas and the autonomous province represent ‘ethnic regions’ where titular non-Russian ethnic groups generally form the plurality or majority of the population. Republics enjoy the highest formal level of autonomy, being allowed to have their own constitutions and
1 Although we include them on this list, the Republic of Crimea and its capital city of Sevastopol remain
unrecognized as Russian territory by the wider international community. We exclude them in the analyses presented below.
4
languages (Russian Constitution, Arts. 66.1 and 68.2). Administrative regions, administrative territories and the cities of federal standing are formed on territorial rather than ethnic grounds.
As Oracheva and Osipov (2010: 217-20) demonstrate, however, this ethnic/non-ethnic distinction is now largely a discourse rather than a legal fact, as the path-dependent
differentiation into the six categories is not given an official rationale in the constitution and each subject is given equal representation in the Federal Council. Nonetheless, the provisions on republican autonomy and regional powers provisions were used in the 1990s to particular effect by some republics –most notably Tatarstan– to make declarations of sovereignty and obtain considerable de facto autonomy that for a while stopped just short of full statehood. The asymmetry extends not only to autonomy but also to size and economic strength. The least populated region, Nenets Autonomous Area, had just 42,800 inhabitants in 2013, compared with nearly 12 million in Moscow city, the largest (Rosstat 2013: 138, 170). The GDP per capita in the poorest region (the Republic of Ingushetia) was sixteen times lower than that of the richest, Tyumen administrative region (Rosstat 2014).
The formal powers of the regions are the residuals of powers not explicitly reserved to the centre or shared between the centre and the regions (Russian Constitution 1993, Arts. 71-3). In principle, powers can be transferred in either direction by mutual agreement, as long as this does not contradict the Constitution (Russian Constitution 1993, Arts. 11 and 78.2-3). In the 1990s there was a parade of bilateral treaties (dogovory) and policy agreements (soglasheniya) between the regions and the centre – 46 in all between 1994 and 1998 (Ross 2010: 168). These delegated significant ad hoc extra powers to particular regions, and in many cases also shifted primary responsibility to the regional level for key appointments to federal law enforcement and tax agencies (Chebankova 2009b: 23-31). In many cases, they also contravened the Constitution. Putin claimed in 2001 that 3,500 laws in the regions contradicted federal laws (Putin 2001), and over the next four years the bilateral treaties were swiftly abandoned (Mironov and Burbulis 2010: 75-80).2
Selection methods for the chief executives (‘governors’) of regions have alternated every few years between appointment or indirect election (1992-95; 2005-12) and direct election (1991; 1995-2005; 2012 onwards). Regional legislatures have been directly elected more or less
2 Some regions (such as Tatarstan, Chechnya and Bashkortostan) retained significant de facto autonomy even after
formally cancelling their treaties. Bashkortostan incorporated the bilateral treaty into a revised constitution (Ross 2002: 149-150) and Tatarstan signed a new one in 2007 (Chebankova 2009: 66-67).
5
throughout the post-Soviet era, but with frequent electoral system changes. From late 1991, the large regional soviets elected the previous year were augmented by ‘small soviets’, chosen from within their ranks, which met more frequently to take day-to-day decisions (Stoner-Weiss 1997: 73-82). After the new constitution was ratified in December 1993, these were replaced by smaller regional legislatures initially elected for a two-year term, though some regions were slow to get going and others exceeded their initial mandate (Slider 1996). Since then, there has been a regular cycle of regional legislative elections.
Our focus for the rest of this chapter is on these regional legislative elections, and the
connection between voting patterns in these and in federal elections. Given the almost constantly changing context of central-federal relations in Russia, and the frequent changes in federal
legislation regarding elections and political parties, we investigate the knock-on effect of these on the nationalization of the vote.
The overall narrative is of a system that has shifted from fragmentation to consolidation. To a large extent, this has been the product of heavy and almost constant institutional and electoral engineering. Between their inceptions and mid-2015, the Law on Political Parties (2001) was modified 38 times; the framework election Law On Fundamental Guarantees (2002) received 73 updates; and the Law on the Structures of Legislative and Executive Organs (1999) was subject to no fewer than 126 separate amending acts. This continually shifting set of rules has created the framework for control over regional legislatures by the national parties, in particular the ‘party of power’, Edinaya Rossiya. Four aspects of institutional and electoral engineering in particular are worth noting.
The first concerns regulation of political parties. The Russian party system of the 1990s was chaotic and fragmented – a ‘floating party system’ in which an ever-changing menu of small and short-lived parties and other organizations ‘floated on and off the ballot’ (Rose 2009: 145). It was relatively easy to set up or dissolve a movement or organization. Parties also played little role in regional politics (Hutcheson 2003). A major innovation early in Putin’s tenure was the
replacement of the relatively lax Law on Public Organizations (1995) with a much stricter Law on Political Parties (2001), which outlawed interregional and regional movements or parties (Art. 9.3); imposed wide territorial penetration requirements (Art. 3.2), and introduced minimum participation criteria (Art. 37.1). This measure –as well as successive tightening of the minimum
6
membership and other requirements– led to a cull of eligible political parties. By 2011, only seven remained eligible to stand in the State Duma election (Ministry of Justice 2011). Since then, party registration has since been liberalized somewhat, leading to a mushrooming of obscure (and often misleadingly-named) parties. Superficially, then, things have come the full circle but the difference is that there is now an established Duma party ‘cartel’ (Hutcheson 2013) whose position –especially that of the dominant Edinaya Rossiya party– is strengthened by the splintering of the vote amongst numerous small parties, leaving the seats to be divided amongst the major parties that pass the electoral threshold (Golosov 2015).
A second major aspect of institutional engineering concerns changes to the electoral system. Regions have some leeway in choosing the details of their electoral system (Lyubarev 2011), but they must conform to the frameworks contained in federal legislation, which has been subject to frequent politically-motivated change. After the framework election law was changed in 2002 to stipulate that a minimum proportion of 50 per cent of deputies had to be elected from party lists (Law on Fundamental Guarantees 2002: Art 35.16), most regions changed from majoritarian to mixed electoral systems. Combined with the aforementioned reforms restricting the supply of eligible parties, the outlawing of electoral blocs after 2005 (Golosov 2014b), a high permitted electoral threshold (typically 7%), and the use of an unusual imperiali divisor in the proportional part of these elections –which advantages the largest party (Golosov 2014c)– the effect over time was to shift the dominant role from independent candidates to the leading parties.
Since 2011, there have been further extensive changes to the framework of Russian regional elections. Some of these appear to contradict the earlier measures, but they can be seen as part of a wider wave of renewed ‘electoral engineering’ more suited to the present-day circumstances. Moscow and St Petersburg have been exempted from the requirement to have any deputies elected from party lists (the 2014 Moscow City Duma election took place on a purely
majoritarian basis). The minimum proportion of deputies that have to be elected from party lists in other regions been cut from 50 per cent to 25 per cent. The maximum electoral threshold has been cut from 7 per cent to 5 per cent, and minimum and maximum legislature sizes have been set in relation to the sizes of regional populations. Edinaya Rossiya at one point benefited from the central nature of proportional lists with its generally high vote shares, but the return of majoritarian systems –in which landslide election victories for the leading party are more likely–
7
can be seen an insurance policy against the possibility of lower proportions of the vote after its long dominance.
In addition to overt electoral system change, elections have been consolidated
chronologically as well. Since 2006, the previous system of rolling regional elections that took place on their own cycles has been replaced by bi-annual and later annual ‘unified days of voting’ in which all regional legislative elections due that year have been held simultaneously. In
Western countries horizontal simultaneity is thought to increase second-order election effects because it induces a national campaign with large involvement of national media and politicians. The effect in Russia has been approximately similar: centralization has advantaged parties with greater resources. It has also made the annual election day a national ‘event’ that receives considerable federal media attention. The lack of variation in parties’ electoral messages was noted in the national press during the 2015 regional elections, for example (Razuvaev 2015).
The third aspect of institutional engineering involves the vertical and horizontal consolidation of the ‘party of power’ (partiya vlasti). The term ‘party of power’ comes from the second meaning of vlast’ (power) in Russian: it is the party not just ‘in power’, but more specifically, of power, formed by the authorities to cement and legitimize their rule (Oversloot and Verheul 2006). By contrast with the Kremlin’s numerous and hapless efforts to do this in the 1990s, the Edinaya
Rossiya party that was formed early in the Putin era has proved adept at consolidating and
eventually dominating legislative politics at all levels. One reason why the Kremlin devoted such energy to building a dominant party was that it allowed the centre to overcome the ‘commitment problem’ of the regions, by establishing a framework for intra-elite interaction that established access channels to the Kremlin in exchange for long-term commitment to the regime (Reuter and Remington 2009). In the electoral arena, this led to the co-option and re-orientation of the
‘electoral machines’ of prominent regional leaders towards Edinaya Rossiya (Golosov 2014a, 2014d).
Control over the regions by Edinaya Rossiya was consolidated by other institutional engineering. Governors’ independent bases of political power were dismantled – first by their removal from the Federation Council, and in particular by the abolition of gubernatorial elections after 2004 (Law on Gubernatorial Appointments 2004). Henceforth, regional legislatures played a formal role in confirming (and after 2009, informing) the president’s nominee. The extent to
8
which governors were simply central government appointees is debated (Goode 2007; Blakkisrud 2011) but a regional governor clearly had little incentive to build an independent power base, and every incentive to ensure a loyal local legislature and ‘deliver the vote’ in federal elections to the benefit of the federal authorities. Direct gubernatorial elections were reintroduced in 2012, but with a qualification: a ‘municipal filter’ requires prospective candidates to collect nomination signatures from between five and ten per cent of deputies in a region’s municipal assemblies, from at least four-fifths of municipal councils –which in practice makes it extremely difficult for non-approved candidates to get onto the ballot (Law on Gubernatorial Appointments 2012, Art. 3). Moreover, in 2013 a clause was added to the law that allowed regional assemblies to replace direct elections with appointment by the head of state. By April 2014, five of seven republics in the Northern Caucasus had done so (Dzutzev 2013, 2014).
Finally, we should address the fact that there are frequent questions raised about the impact of possible falsification in Russian elections. Even in the early 1990s, some analysts posted significant question marks over the reliability of the electoral process (e.g., Sobyaninin and Sukhovol’skii 1995), and similar allegations have been repeated frequently since (e.g., Borisova 2000; Myagkov et al. 2009). Concerns focus on two aspects: overt falsification (Lyubarev et al. 2007: 59-122), and the systematic use of ‘administrative resources’ (state-sponsored agency) to skew the election systemically to the benefit of particular candidates or parties (Hutcheson 2006: 60-64).
The two main methods used to detect apparent fraud are the compilation of individual
reported incidences of electoral law violations (e.g., Golos Movement 2014, Loshkina 2004; Ross 2014), and detailed statistical analysis of official voting and turnout patterns to spot anomalous results (e.g., Myagkov et al. 2009). Whilst neither approach is perfect, they suggest that some regions run relatively clean elections, whilst others are more problematic. Myagkov et al. (2009:5) point to the ethnic republics of the Northern Caucasus and the mid-Russian ethnic republics of Tatarstan and Dagestan as regions with particularly attention-worthy voting
statistics, consistent with other previous indices of Russian regional democracy (Petrov 2004) and local reports (e.g., Mikhailov et al. 2000).
Although election results seem both predictable and questionable, we think there are three reasons why a study of Russian regional elections is useful nonetheless. First, although the
inter-9
party competition may be limited, intra-party competition is rife within Edinaya Rossiya. Most regions have set their legislature sizes at or close to the minimum permitted level, which –when combined with the fact that party lists are generally divided into more sub-districts than there are seats available– means that the district party organisations (and local administrations) are
effectively competing with their neighbours to obtain representation (Kynev et al. 2014: 42). The competition to mobilize the local electorate thus assumes some importance despite the
predictability of the aggregate result. Second, the electoral engineering, and the large number of regions, makes for a turbulent process but provides an almost unparalleled laboratory for testing the impact of electoral engineering on the vote. Finally, there is a difference between relative and absolute fraud. Even if we accept that the electoral results in some regions seem to come under question more than others, it is likely that the same practices will be prevalent in these regions in both federal and regional elections –which means that election congruence will still be
discernible.
8.3 Congruence of the vote
Before we start discussing congruence between regional and federal elections we need first to set out the scope conditions for the comparison. In this chapter we analyse 204 regional elections which are grouped according three ‘electoral cycles’ (table 1). An electoral cycle starts with a federal parliamentary election (to the Russian parliament, the State Duma) and stops before the next federal election. Although there were already regional legislative elections in the 1990s, we start our analyses from the federal election of December 2003, for two reasons. First, the official reporting of regional elections before the turn of the century was fragmentary and often only contained details of the winners in each district, rather than full lists of candidates and their affiliations (e.g., Kozlov and Oreshkin 1998). Second, until 2003 most regional electoral systems used majoritarian rules to translate votes into seats. This resulted in very low vote shares for parties and the domination of regional legislatures by independent candidates with a local following. Golosov (2004: 73) concluded that party nominees won just 12.5 per cent of seats in the 1993-95 period, and 21.8 per cent from 1995 to 1999. Our data confirm this. Taking the inverse measure of party involvement –the percentage of votes won by non-affiliated candidates–
10
we find that on average independents won over 75 per cent of the vote in the regional elections held from 1999 to 2003, and won only 32 per cent and 16 per cent in the 2003-07 and 2007-11 election rounds respectively.3
The first regional elections included in our analysis were held on 7 December 2003 and our analysis stops with the regional elections which were held on 13 September 2015, the last round before the September 2016 federal State Duma election. The reason for analysing elections according to ‘cycles’ is because the length of the mandates of regional representatives differs from two to five years and thereby the number of included regional elections differs across the electoral cycles. For each election cycle we made sure that a region only appears once, and when a region held more than one election within an election cycle we took the regional election held closest in time to the previous federal election as a basis for comparison.
Table 1: included regional elections per cycle
Electoral Regional elections Number
Cycle First Last elections
1 ‘2003-07’ 7 December 2003 15 April 2007 74 2 ‘2007-11’ 2 December 2007 13 March 2011 63 3 ‘2011-15’ 4 December 2011 13 September 2015 67
Total 204
Starting at the federal level, half of the parliamentary seats in the 2003 State Duma election were elected under proportional rule, with the other half elected in single-member constituencies –as had also been the case in 1993, 1995 and 1999. All representatives were elected under
proportional rule in the federal elections of 2007 and 2011 (but the system reverted to a mixed unconnected one in 2016). Since 2003, most regions have used a mixed electoral system for their regional parliamentary elections. We compare the federal election results in the proportional tier to the regional election results in the proportional tier.
3 We could not assign vote share won by candidates to party labels for the majoritarian tier results for the 2011-15
electoral cycle. The results for the 1999, 2003, and 2007 election rounds have been assigned to parties by IRENA (Geliks Center hosted at http://irena.org.ru/index.html, accessed 14 November 2015). Unfortunately, the regional election database was taken offline by the federal election authority in 2012
(http://www.themoscownews.com/russia/20120224/189485434.html, accessed 14 November 2015). Therefore we
are not able to update the election data for regional assemblies held after the 2011 elections because the Central Electoral Commission and its regional affiliates (www.cikrf.ru) lists majoritarian candidates only by name and not by party affiliation in the official results.
11
Figure 1 displays the results for three different dissimilarity indices for the 2003-07, 2007-11 and 2011-15 electoral cycles. Party system congruence (NN-RR) compares the federal election result at the national level to the regional election result in a particular region. This measure conflates two sources of variation. Election results are compared across type of election and across level of aggregation. Election congruence (NR-RR) compares the federal election result in each region to the closest regional election outcome within the same region. Electorate congruence (NN-NR) compares the federal vote at the statewide level to the federal vote in a particular region. Figure 1 shows averages for three electoral cycles.
Figure 1. Dissimilarity between the regional and federal vote for the proportional tier results (PR). NN-RR = party system congruence; NN-NR = electorate congruence and NR-RR = election congruence.
The overall trend is quite clear: dissimilarity decreased considerably between the 2003-07 and 2007-11 election cycles. However, there is also interesting variation across the measurements. The overall difference between the national and regional vote (party system congruence) was about 35 per cent in the 2003-07 election round and more than halved for the 2007-11 and 2011-15 election cycles. Party system congruence seems to be highly related to election congruence and this suggests that most of the decline in dissimilarity in the vote can be attributed to a
decrease in vote switching between federal and regional elections. The more stable list of parties participating over time presumably also plays a role. Electorate congruence, which compares the federal vote at the statewide level to the federal vote in a region, is higher (indicated by lower scores) than for the other two measures. For the 2003 federal election, average electorate
0 5 10 15 20 25 30 35 40 2003-07 2007-11 2011-15 Dif fe re nc e be tw ee n r eg io na l an d nat io nal vo te sh ar es (% ) NR-RR NN-NR NN-RR
12
dissimilarity was about 14 per cent, decreasing to just below 10 per cent for the 2007 election and increasing to about 15 per cent in the 2011 election. When we compare the federal and regional vote within the proportional tier, we detect significant nationalization of the vote.
The results should be interpreted with care, since the comparison across time involves a different number of regions. However, federal election results allow us to assess the ‘representativeness’ of the regions included within an election cycle. Table 2 presents average election congruence (NN-NR) scores for two groups of regions across three electoral cycles. The first group includes all regions at the time of the federal election whereas the second group of regions are those which are included in an election cycle (see table 1). From table 2, one can observe that for each election round, averages and standard deviations are of comparable size across the two groups. The similarity in electorate congruence scores strengthens the finding that the decrease in dissimilarity in the vote cannot be (solely) ascribed to different regions included in the analysis. In the next two sections we explore in further depth the causes for the difference in the vote.
Table 2: comparison of electorate congruence (NN-NR)
Election All regions in the federal election Regions included in election round cycle N regions Mean St.dev. N regions Mean St.dev.
2003-07 89 13.94 8.98 74 13.41 8.46
2007-11 85 9.74 7.58 64 9.17 6.82
2011-15 83 14.43 9.41 67 14.43 9.67
8.4 Second-order election effects
One source of dual voting can relate to second-order election effects. The second-order election model posits that there is a (perceived) hierarchy between elections. National elections are considered to be the most important elections because there is more ‘at stake’ than in second-order regional elections. Because regional elections are considered to be less important, voters tend to display particular electoral behaviour. Voters are inclined to turn out less and those who do turn out tend to use their vote to send a signal of discontent. They punish parties in national government and vote for small, new and opposition parties. The observed decline in dissimilarity in the vote in figure 1 could relate to decreased second-order election behaviour. In this section
13
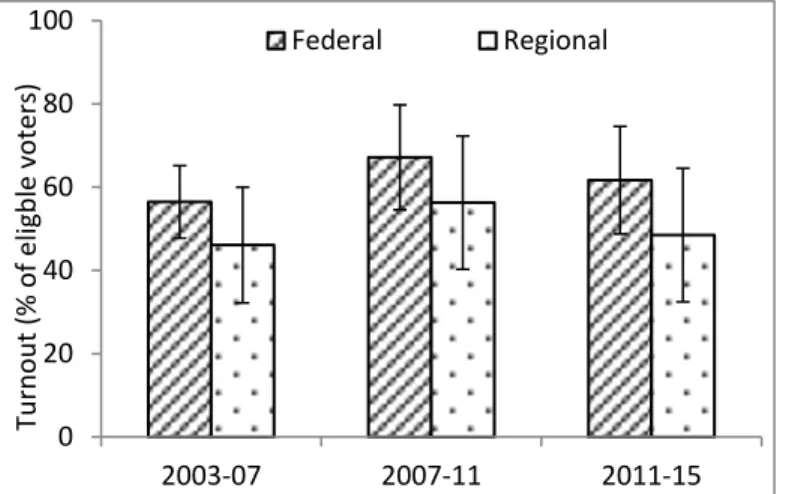
we explore the extent to which regional elections display second-order election outcomes and we start by exploring average turnout rates for federal and regional elections in figure 2.
Figure 2. Turnout in regional and federal legislative elections. Averages and their standard deviations for turnout rates in regional and federal elections are shown. See table 1 for the number of regions included.
Overall, average turnout was relatively low for both federal and regional legislative elections, and did not exceed 70 per cent in the three cycles. Turnout in federal legislative elections tend to be higher than for regional legislative elections (though it should be noted that it has always been higher still in presidential elections, which suggests that State Duma elections are also seen as ‘slightly less than first-order’ contests). Turnout in both regional and federal elections increased between the 2003 and 2007 election cycles, possibly reflecting the better mobilization of the regional elite in 2007 as they competed for the federal centre’s approval.
In order to explore second-order election effects in greater depth, we compare the regional vote to the previous federal vote for four party categories in figure 3:4
• The ‘government party’ category reflects the vote share change for Edinaya Rossiya (ER). In other chapters in this volume, this label is applied to the parties of the governing coalition, but as the Russian government is neither party-based nor formed on the basis of a parliamentary majority, we interpret ER, as the party with which most of the regional
4 A party is included when it won at least five percent of the vote in a region for at least one federal or regional
election (excluding independent candidates). 0 20 40 60 80 100 2003-07 2007-11 2011-15 Tu rn ou t ( % of e lig ble v ot ers) Federal Regional
14
governors are affiliated and which is explicitly endorsed by president, as the ‘government party’.
• ‘Opposition parties’ are considered to be the other non-ER parties that gained representation in the State Duma –five others in 1999, and three others in 2003, 2007 and 2011. As we shall see below, the extent to which they provide genuine opposition is sometimes debatable.
• ‘No representation parties’ participated in the preceding federal election, but did not manage to gain seats.
• ‘New parties’ are those established after the previous federal election was held.
According to the traditional second-order election model, government parties should lose vote share as an electoral cycle goes on, whereas vote share gains should be observed for the other categories of parties. Figure 3 displays average vote share transfers between regional and previously held federal elections.
Figure 3. Second-order election effects in regional elections. Average vote share transfers and their standard deviations between regional and previous federal elections are shown. See table 1 for the included number of regions.
We may observe different second-order election effects across the election cycles. Edinaya
Rossiya tended not be ‘punished’ in the 2003-07 round as it continued to extend its dominance,
but the party did suffer from a vote share loss in the 2007-11 cycle –reflected also in ER’s lower vote share in the 2011 State Duma election result. In the 2003-07 round, new parties tended to
-30 -20 -10 0 10 20 30 2003-07 2007-11 2011-15 Vo te sh ar e ch an ge (% vo te s)
15
gain votes to the detriment of opposition parties –though this is partly a statistical reflection of the machinations surrounding the Rodina (Motherland) party, which gained 37 out of 450 seats in the 2003 State Duma but split in 2005 and eventually became a component part of Spravedlivaya
Rossiya (SR, or A Just Russia), together with the Rossiyskaya Partiya Zhizni (Russian Party of
Life), and the Rossiyskaya Partiya Pensionerov (Russian Pensioner’s Party). SR is classified as a new party in figure 3, but its roots lay in previous opposition parties and its hostility to the regime was questionable. At least in its infancy, it was broadly seen as a second ‘party of power’, and for the 2007 State Duma election it declared itself ‘in opposition to the ruling liberal Edinaya
Rossiya party but supportive of Vladimir Putin’ (Mironov 2007) –a difficult balancing act when
Putin happened to be Edinaya Rossiya’s leading candidate!
Once these party splits and reformations are accounted for, second-order election effects in the 2003-07 cycle disappear, since the vote share loss for the other opposition parties is largely compensated for by the vote share gained incurred by SR. During the 2007-11 election cycle,
Edinaya Rossiya on average lost 7.5 per cent of its previous vote. A closer look at the party level
reveals that the Kommunisticheskaya Partiya Rossiiskoi Federatsii (KPRF, or Communist Party of the Russian Federation), Liberal’no-Demokraticheskaya Partiya Rossii (LDPR, or Liberal Democratic Party of Russia) and SR were the opposition parties that won an average total vote share of about 10 per cent in regional elections. Hence, second-order election effects occurred during the 2007-11 election cycle. The 2011-15 election cycle stands out because none of the party categories recorded an average loss or gain in vote share as indicated by the high standard deviations.
Nationalization of the vote can also be explored by looking at the ability of parties to win vote shares across the territory. In Russia, most vote share is won by a decreasing number of parties – largely reflecting also the ever-reducing number of parties that were eligible to stand between 2003 and 2011, as discussed above. In table 2 we present average regional vote share won by the six biggest parties over the three electoral cycles from 2003-15.5 These six parties among them won an increasing total of the overall vote in the federal State Duma elections: up from 75 per
5 These six parties have won at least five percent of the vote in a region for at least one federal or regional election
16
cent in the 2003 State Duma election, to 92 per cent in the 2007 and 97 per cent in 2011. They have also dominated regional elections, cumulatively winning (respectively) 73 per cent, 97 per cent and 92 per cent of the vote in the 2003-07, 2007-11 and 2011-15 cycles. Table 3 reveals clearly that most of the nationalization can be ascribed to the increased ability of Edinaya Rossiya to capture the vote. In the 2007 and 2011 election cycles, ER managed to win absolute majorities in federal and regional elections, even though its absolute vote share fell significantly between the 2007 and 2011 rounds.
Table 3. Average vote share won by the six largest parties
Party Federal elections Regional elections
2003 2007 2011 2003-07 2007-11 2011-15 ER 40.15 66.03 49.89 41.60 60.13 53.36 KPRF 12.35 11.11 19.57 14.86 16.53 15.90 LDPR 12.12 8.53 12.60 8.35 10.17 11.26 Motherland 7.88 - - 1.28 - - SR - 7.65 13.47 6.10 10.21 10.92 Yabloko 3.71 1.25 2.88 1.20 0.25 1.10 Total 76.20 94.57 98.40 73.38 97.30 92.54
Notes: shown are average regional party vote shares (per cent votes) for three election cycles for federal and regional elections. They differ from the official results published by the Central Electoral Commission as they omit the regions which did not hold a regional parliamentary election in the following cycle. See table 1 for the included number of regions.
8.5 Regionalization of the vote
In the previous section it was shown that, within a decade, federal and regional elections have become highly nationalized. In this section we take a region-level perspective and we explore in how far the process of nationalization has been uneven across the territory. As a measure of regionalization of the vote we look at the vote share won by three categories of parties. In practice, the appearance of nationalization is synonymous with Edinaya Rossiya winning large vote shares, while regionalization can be observed by looking at the vote share won by the opposition parties in the Duma (see table 3), and by other parties and independent candidates
17
(non-Duma parties). As independent variables we include factors that tap into the socio-economic and institutional regional context.
In section 2 we discussed the highly asymmetric nature of the Russian federation caused by earlier bilateral treaties, ethnicity, population size and economic strength. We group regions into those that signed bilateral treaties (46 regions) and those that did not. The 1994-98 bilateral treaties can be seen as an indicator of an increased ability of regional executives to challenge the federal government, since in many cases these contravened the Constitution’s divisions of powers. As noted above, almost all bilateral treaties were annulled in the early 2000s and we are interested to explore in how far resistance against the federal centre, or compliance with it, is still reflected in election outcomes in these regions. Republics (respubliki) and autonomous regions (avtonomnyye okruga and avtonomnaya oblast) are categorized as ethnic regions while provinces (oblasti), territories (kraya), and the two federal (federalnyye goroda) constitute the non-ethnic categories. The presence of titular nationalities would potentially provide regional elites with resources to mobilize the regional population politically along ethnic and religious lines.
However, given that such grounds for party formation were outlawed in the 2001 Law on Parties, and these same ethnic and religious mobilization strategies have generally given the presidents and governors of the ethnic regions considerable control over regional populations and elites, the counter-hypothesis would be that we would expect to see more nationalization of the vote after 2001 as these leaders traded off the delivery of electoral support for the centre against
concessions for their regions, and then re-oriented their electoral ‘machines’ to the cause (Golosov 2014d).
The population size of a region is measured by the size of the regional electorate as a percentage of the total Russian electorate, and regional economic strength is expressed as a percentage relative to the Gross Domestic Product per capita in Russia as a whole (i.e., GDP for Russia is set at 100 per cent and richer regions score above whereas poorer regions score below 100 per cent; Rosstat 2015). Just as with ethnic regions, we may pose two opposite hypotheses. More populous and economically rich regions may be better able to resist central efforts to nationalize the party system, but these regions are also likely to be subject to higher nationalization efforts given their importance in the Russian federal system. We also add a regional democracy variable which is
18
the sum of scores for 10 indicators6 which were rated on a five point scale by experts between 1998 and 2004, which applied at the start of the period under study. High scores indicate more democracy in a particular region (Petrov and Titkov 2004). We expect more regionalization of the vote with higher levels of regional democracy.
The models examining regional elections also include electoral timing variables. The timing of a regional election relative to the federal election cycle is measured by a variable labelled ‘cycle’ which is operationalized by dividing the number of months between a regional and a previously held federal election by 48 (the federal election cycle is four years). We include a squared cycle variable (cycle2) because we expect that nationalization of the vote is higher the closer a regional election is held to a previous or next federal election. Presidential elections took place in 2004, 2008, and 2012 and we include a dummy variable indicating whether a regional election was held concurrently with a presidential election, which would lead us to expect a nationalization of the regional vote. Finally, in section 2 we discussed the introduction of a ‘unified election day’ for regional elections, which should contribute to nationalization as well. We include a horizontal simultaneity variable which measures the total regional electorate voting on the same day relative to the total Russian electorate.
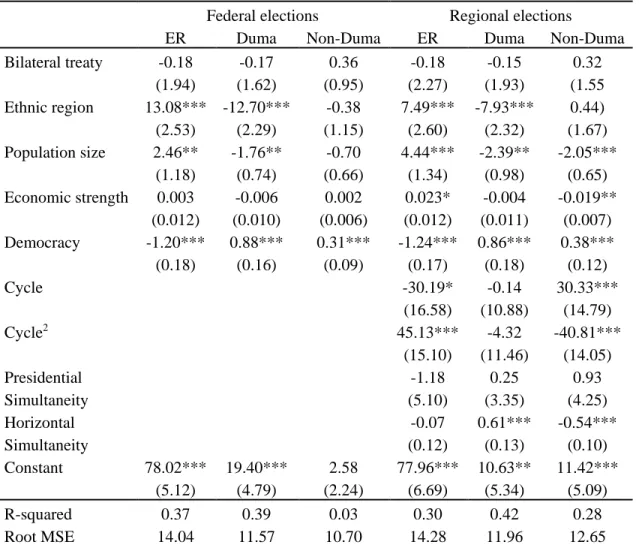
Table 4 displays the results of ordinary least squares regression models and we run, for federal and regional elections separately, three different models which analyse respectively the vote share for Edinaya Rossiya, the five opposition parties in the Duma (see table 3), and other parties and independent candidates (non-Duma parties). The vote share for Edinaya Rossiya is larger in ethnic and more populous regions, and smaller in more democratic regions. The combined vote share for the Duma-parties displays the opposite tendency. It is smaller in ethnic and more populous regions, and larger for the more ‘democratic’ regions.7 Bilateral treaties and relative
6 These dimensions are open/closed political life, democratic elections, political pluralism, independence of the
media, corruption, economic liberalization, civil society, political structure, elite turnover, and local government. More information is provided by Petrov and Titkov 2004.
7 The substantive results for federal elections are as follows. In ethnic regions, the vote share for United Russia is 13
per cent higher and the combined vote share for the five Duma-parties is 12.7 per cent lower. The most populous region has a six per cent higher weight relative to the total Russian population and this equals to 15 per cent higher vote share for United Russia and to 10.8 lower vote share for the five Duma-parties. The lowest democracy is 17 and the highest is 45 and the difference equals to 33.6 per cent lower vote share for United Russia and to 24.6 higher vote share for the five Duma-parties.
19
economic strength do not seem to matter. Nationalization of the vote has been facilitated or has focused on in ethnic and more populous regions while more democratic regions have been able to resist the nationalization efforts by Edinaya Rossiya.
Table 3: Multivariate analysis on the regionalization of the vote.
Federal elections Regional elections
ER Duma Non-Duma ER Duma Non-Duma
Bilateral treaty -0.18 -0.17 0.36 -0.18 -0.15 0.32 (1.94) (1.62) (0.95) (2.27) (1.93) (1.55 Ethnic region 13.08*** -12.70*** -0.38 7.49*** -7.93*** 0.44) (2.53) (2.29) (1.15) (2.60) (2.32) (1.67) Population size 2.46** -1.76** -0.70 4.44*** -2.39** -2.05*** (1.18) (0.74) (0.66) (1.34) (0.98) (0.65) Economic strength 0.003 -0.006 0.002 0.023* -0.004 -0.019** (0.012) (0.010) (0.006) (0.012) (0.011) (0.007) Democracy -1.20*** 0.88*** 0.31*** -1.24*** 0.86*** 0.38*** (0.18) (0.16) (0.09) (0.17) (0.18) (0.12) Cycle -30.19* -0.14 30.33*** (16.58) (10.88) (14.79) Cycle2 45.13*** -4.32 -40.81*** (15.10) (11.46) (14.05) Presidential -1.18 0.25 0.93 Simultaneity (5.10) (3.35) (4.25) Horizontal -0.07 0.61*** -0.54*** Simultaneity (0.12) (0.13) (0.10) Constant 78.02*** 19.40*** 2.58 77.96*** 10.63** 11.42*** (5.12) (4.79) (2.24) (6.69) (5.34) (5.09) R-squared 0.37 0.39 0.03 0.30 0.42 0.28 Root MSE 14.04 11.57 10.70 14.28 11.96 12.65
Notes: Shown are the results of an ordinary least square regression whereby standard errors are clustered by 86 regions. The number of observations is 201 regional vote shares for federal and regional elections held between 2003 and 2015. ER = vote share for Edinaya Rossiya; Duma = combined vote share for five opposition parties in the Duma (see table 3); non-Duma = combined vote share for parties not represented in the Duma.
Zooming in on regional elections and the vertical and horizontal simultaneity variables we may observe that vote shares for Edinaya Rossiya indeed follow a cyclical pattern and we display the results in Figure 4 to ease interpretation. Vote share losses are incurred when a regional election is held within two and a half years after a national election and a maximum vote share loss of five
20
per cent is incurred just after one year. Larger vote shares for Edinaya Rossiya are to be found in regions which hold their election within one year before the federal election and vote share gains may increase up to almost fifteen percent. Interestingly, it is the non-Duma parties which gain or lose vote share when Edinaya Rossiya respectively loses or gains vote share. In addition, the Duma parties gain vote share when horizontal simultaneity increases, to the detriment of the non-Duma parties. In contrast to expectations, holding a regional election concurrently with a
presidential election does not seem to matter. However, this may be explained by the fact that all the presidential elections in the period of investigation have been held within three months of a federal parliamentary election (this will change in 2016/18), and at that point in time vote share losses for Edinaya Rossiya relative to the preceding State Duma election are practically zero (see figure 4; three months equals 0.06 cycle). Overall, the results indicate that electoral engineering has contributed to a nationalization of the vote, i.e. from non-Duma to Duma parties (horizontal simultaneity) and from Duma parties to Edinaya Rossiya (vertical simultaneity).
Figure 4. Vote share in the federal election cycle.
Notes: shown is the effect of the placement of a regional election in the federal election cycle (0.25 = 1 year) on the vote share for Edinaya Rossiya and combined vote share for non-Duma parties. The estimates are based on the results presented in table 3.
8.6 Discussion -15 -10 -5 0 5 10 15 20 0 0.2 0.4 0.6 0.8 1 Vo te sh ar e ( % vo te s) Cycle United Russia Other parties
21
Russia has undergone a tremendous process of nationalization during the 2000s. While the 1990s can be described as a period of extreme asymmetrical federalism, the 2000s may be labelled as a period of extreme nationalization. In the regional elections that were held under majoritarian rule during the election cycle that started in 1999, more than 75 per cent of the vote share was won by independents. In the election round that commenced in 2011, the picture was reversed and more than 90 per cent of the vote was won by parties. The story of nationalization of regional and federal elections relates strongly to the story of the political elite’s consolidation of control over the political system –using, in the electoral sphere, the vehicle of Edinaya Rossiya to achieve dominance of the legislative organs of power. During the first election cycle of 2003-07, Edinaya
Rossiya won large vote shares but on average did not achieve absolute majorities. The party did
win more than 50 per cent of the vote on average in the subsequent election cycle, and fell back slightly in the election round of 2011-15.
The ability of Edinaya Rossiya to capture the vote can be in large part ascribed to significant and frequent electoral and institutional reform. Electoral systems seem to impact significantly on the nationalization of elections (see also Bochsler, 2010), also when elections take place in an ‘authoritarian’ regime. To this we can add that electoral institutional engineering also highly impacts on the nationalization of elections.
A strong process of nationalization has occurred across all elections and regions but the depth and speed of nationalization has been territorially uneven. Despite an overall trend of extreme
nationalization, there are still significant traces of regionalization according to identity,
population size and democracy. Regions with strong identities tend to be less nationalized in most countries. In contrast, Edinaya Rossiya has been able to win larger vote shares in ethnic regions. This may reflect larger efforts of Edinaya Rossiya to mobilize (or manipulate) the vote because ethnic regions can pose a threat to central government authority or hegemony, or it may reflect the greater ability of these regional leaders to harness their electoral machines to the cause.
22
• Bochsler, D. (2010) ‘The nationalisation of post-communist party systems’, Europe-Asia
Studies 62(5): 807-27.
• Borisova, Ye. (2000) ‘And the Winner is?’, The Moscow Times (Weekend), 9 September 2000: I-VIII.
• Blakkisrud, H. (2011) ‘Medvedev's New Governors’, Europe-Asia Studies, 63(3):367-395.
• Chebankova, E. (2009). ‘Russia's noncovenantal federalism: Past and present’. Journal of
Church and State 51(2), 312-340
• Chebankova, E. (2009b) Russia's Federal Relations: Putin's Reforms and Management of
the Regions. Hoboken: Taylor and Francis.
• Cherkasov, K.V. (2008) ‘Federal Districts: Their Definition and Place in the Federal Structure of Russia’, Gosudarstvo i Pravo 81(12): 67-75.
• Clem, R.S. and Craumer, P.R. (1997) ‘The Regional Dimension’ in Belin, L. and Orttung, R.W. (eds), The Russian Parliamentary Elections of 1995. Armonk, NY: M. E. Sharpe, 137–59.
• Clem, R.S. and Craumer. P.R. (1998) ‘Regional Patterns of Voter Turnout in Russian Elections, 1993–96’, in Wyman, M., White, S. and Oates, S. (eds), Elections and Voters
in Post-communist Russia. Cheltenham: Edward Elgar, 40–67.
• Dzutsev, V. (2013) ‘Moscow’s Appointment of Governors in the North Caucasus’, CACI Analyst, 13 November 2013. Available online:
http://www.cacianalyst.org/publications/analytical-articles/item/12855-moscows-appointment-of-governors-in-the-north-caucasus.html, accessed 18 November 2015. • Dzutsev, V. (2014) ‘Kabardino-Balkaria Joins Russian Regions Not Allowed to Elect
Governors’, North Caucasus Analysis 15(7). Available online:
http://www.jamestown.org/single/?tx_ttnews[any_of_the_words]=Zachary%20Abuza&tx _ttnews[pointer]=1&tx_ttnews[tt_news]=42200&tx_ttnews[backPid]=7&cHash=ea2e411 e7babbf98ca21956f75f906e6#.VkyaDr8ltCE, accessed 18 November 2015.
• Friedgut, T.H and. Hahn, J.W. (eds) (1994) Local Power and Post-Soviet Politics. Armonk, N.Y.: M. E. Sharpe.
23
• Gel'man, V. (1999) ‘Regime transition, uncertainty and prospects for democratisation: The politics of Russia's regions in a comparative perspective’, Europe-Asia Studies 51(6): 939-56.
• Gel’man, V.; Ryzhenkov, S. & Bri, M. (eds), Rossiya regionov: transformatsiya
politicheskikh rezhimov. Moscow: Ves’ Mir, 2000.
• Golos Movement (2014). ‘Zayavlenie “Golosa” po itogam obshchestvennogo
nablyudeniya za vyborami edinogo dna golosovaniya 14 sentyabrya 2014 goda’. Moscow, 15 September. Available online: http://www.golosinfo.org/ru/articles/1010, accessed 31 August 2015.
• Golosov, G.V. (1999) ‘From Adygeya to Yaroslavl: Factors of Party Development in the Regions of Russia, 1995-1998’, Europe-Asia Studies 51(8): 1333-65.
• Golosov, G.V. (2004) Political Parties in the Regions of Russia: Democracy Unclaimed. Lynne Boulder, CO: Lynne Rienner.
• Golosov, G.V (2012) ‘The 2012 Political Reform in Russia’, Problems of
Post-Communism 9(8): 3-14.
• Golosov, G.V. (2014a) ‘Co-optation in the process of dominant party system building: the case of Russia’, East European Politics 30:2: 271-285.
• Golosov. G.V. (2014b) ‘The last resort of political regionalism: electoral blocs in Russia's regional legislative elections, 2003–2005’, East European Politics 30(1): 71-85.
• Golosov, G.V. (2014c) ‘Authoritarian Electoral Engineering and its Limits: A Curious Case of the Imperiali Highest Averages Method in Russia’, Europe-Asia Studies, 66(10): 1611-28.
• Golosov, G.V. (2014d) ‘The territorial genealogies of Russia’s political parties and the transferability of political machines’, Post-Soviet Affairs 30(6): 464–480,
• Golosov, G.V. (2015) ‘Do spoilers make a difference? Instrumental manipulation of political parties in an electoral authoritarian regime, the case of Russia’, East European
Politics 31(2): 170-86
• Goode, J.P. (2007) ‘The Puzzle of Putin's Gubernatorial Appointments’, Europe-Asia
Studies, 59(3): 365-399.
• Hutcheson, D.S. (2003) Political Parties in the Russian Regions. London/New York: RoutledgeCurzon.
24
• Hutcheson, D.S. (2006) ‘How to Win Elections and Influence People: The Development of Political Consulting in Post-Communist Russia’, Journal of Political Marketing 5(4): 47-70.
• Hutcheson, D.S. (2013) ‘Party Cartels beyond Western Europe: Evidence from Russia’,
Party Politics 19(6): 907-924
• Ishiyama, John T. (2002) ‘Regionalism and the Nationalization of the Legislative Vote in Post-Communist Russian Politics’, Communist and Postcommunist Studies 35(2): 155– 68.
• Kozlov, V.N. & Oreshkin, D.B. (eds) (1998) Vybory v zakonodatel’nye (predstavitel’nye)
organy gosudarstvennoi vlasti sub”ektov Rossiiskoi Federatsii. 1995-1997. Moscow:
CEC/Ves’ Mir.
• Kynev, A., Lyuvbarev, A. and Maksimov, A. (2015) Regional’ye i mestnye vybory 2014
goda v Rossii v usloviyakh novykh ogranichenii konkurenstii. Moscow: Fond ‘Libera’naya
Missiya’.
• Law on the Structures of Legislative and Executive Organs (1999): Federal’nyi zakon ‘Ob obshchikh printsipakh organizatsii zakonodatel’nykh (predstavitel’nykh) i ispolnitel’nykh organov gosudarstvennoi vlasti sub”ektov Rossiiskoi Federatsii’. Law No. 184-F3 (6 October 1999), Rossiiskaya Gazeta, 19 October 1999. Latest version, amended 126 times, available from
http://base.consultant.ru/cons/cgi/online.cgi?req=doc;base=LAW;n=182926;dst=0;ts=5D9 603E152B4B55BC7252A5D19000152;rnd=0.2605657743492863, accessed 14 August 2015.
• Law on Fundamental Guarantees (2002). Federal’nyi zakon ‘Ob osnovnykh garantiyakh izbiratel’nykh prav i prava na uchastie v referendume grazhdan Rossiiskoi Federatsii’, Law No. 67-F3 (12 June 2002), Rossiiskaya Gazeta, No. 106 (2974), 15 June 2002, pp.7-14. Latest version, amended 73 times, available at
http://www.consultant.ru/document/cons_doc_LAW_37119/, accessed 1 September 2015. • Law on Gubernatorial Appointments (2004): Federal'nyi zakon Rossiiskoi Federatsii ot 11
dekabrya 2004 g. N 159-FZ ‘O vnesenii izmenenii v Federal'nyi zakon “Ob obshchikh printsipakh organizatsii zakonodatel'nykh (predstavitel'nykh) i ispolnitel'nykh organov gosudarstvennoi vlasti sub"ektov Rossiiskoi Federatsii” i v Federal'nyi zakon “Ob
25
osnovnykh garantiyakh izbiratel'nykh prav i prava na uchastie v referendume grazhdan Rossiiskoi Federatsii”, Rossiiskaya Gazeta, 15 December 2004.
• Law on Gubernatorial Appointments (2012): Federal’nyi zakon Rossiiskoi Federatsii ot 2 maya 2012 g. N 40-F3 ‘O vnesenii izmenenii v Federal’nyi zakon “Ob obshchkh
printispakh organizatsii zakonodatel’nykh (predstavitel’nykh) i ispolnitel’nykh organov gosudarsvetnnoi vlasti sub”ektov Rossiiskoi Federatsii” i Federal’nyi zakon “Ob
osnovnykh garantiyakh izbiratel’nykh prav i prava na uchastie v referendume grazhdan Rossiiskoi Federatsii”’, Rossiiskaya Gazeta, 2 May 2012. Available online:
http://www.rg.ru/printable/2012/05/04/gubernatori-dok.html, accessed 18 November 2015.
• Law on Political Parties (2001). Federal’nyi zakon ‘O politicheskikh partiyakh’, Law No. 95-F3 (11 July 2001), Vestnik Tsentral’noi Izbiratel’noi Komissii, No. 6 (120): 5-35. Latest version, amended 38 times of 23 May 2015, available at
http://www.consultant.ru/document/cons_doc_LAW_32459/, accessed 1 September 2015. • Law on Public Organisations (1995). Federal’nyi zakon ‘Ob obshchestvennykh
ob”edineniyakh’, Law No. 82-F3 (19 May 1995), Rossiiskaya Gazeta, 25 May 1995, 4-5. • Loshkina, T. (ed.) (2004) The Right to Fair and Free Elections in Russia 2003. Moscow:
Moscow Helsinki Group.
• Löwenhardt, J. and White, S. (2007). The Russian Regions: A Bibliography. The Carl Beck Papers in Russian and East European Studies 1804. CREES, University of Pittsburgh.
• Lyubarev, A. (2011) ‘Electoral Legislation in Russian Regions’, Europe-Asia Studies 63 (3): 415-27.
• Lyubarev, A.E., Buzin, A.Yu and Kynev, A.V. (2007), Mertvye dushi. Metody falsifikatsii
itogov golosovaniya i bor’ba s nimi. Moscow: Nikkolo M.
• Mikhailov, V.V., Bazhanov, V.A. and Farukshin, M.Kh. (2000) Osobaya zona: Vybory v
Tatarstane, Ul’yanovsk: Kazanskoe otdelenie Mezhdunarodnoi Pravozashchitnoi
Assamblei.
• Ministry of Justice of the Russian Federation (2011). ‘Spisok politicheskikh partii, imeyushchikh pravo v sootveststvii c Federal’nym zakonom ot 11 iyulya 2001 g. No. 95-F3 “O politicheskikh partiyakh” prinimat’ uchastie v vyborakh deputatov
26
izbiratel’nykh ob”edinenii’. Rossiiskaya Gazeta, 31 August 2011. Available online: http://www.cikrf.ru/news/relevant/2011/08/31/spisok_pp.html, accessed 20 August 2015. • Mironov, Sergei (2007) ‘Address of the Leader of “Fair Russia” Sergei Mironov to
Voters’, Interfax Press Conference, 30 November 2007. Accessed online:
http://www.spravedlivo.ru/first_face/203.smx (accessed 11 December 2007; no longer available).
• Mironov, S.M. and Burbulis, G.E (eds). 2010. ‘Doklad Soveta Federatstii Federal’nogo Sobraniya Rossiiskoi Federatsii 2009 goda: O sostoyanii zakonodatel’stva v Rossiiskoi Federatsii: Monitoring pravogo obespechiya osnovnykh napravlenii vnutrennei i vneshnei politiki’. Moscow: Federation Council Publishing.
• Moses, J.C. (2003). Voting, Regional Legislatures and Electoral Reform in Russia.
Europe-Asia Studies 55(7): 1049-75.
• Myagkov, M., Ordeshook, P.C. and Shakov, D. (2009) The Forensics of Election Fraud:
Russia and Ukraine. Oxford: Oxford University Press.
• Nelson, L. and Kuzes, I.Y. (2002). Regional Variations in the Implementation of Russia’s Federal Reforms. Democratization 10(1): 5-18.
• Osipov, A., & Oracheva, O. (2010). ‘Territories of “special status” in Russia: The ethnic dimension‘, Journal of Communist Studies and Transition Politics 26(2): 212-232. • Oversloot, H. and Verheul, R. (2006) ‘Managing Democracy: Political Parties and the
State in Russia’, Journal of Communist Studies and Transition Politics 22(3): 383–405. • Panov, Petr & Ross, Cameron (2013) ‘Sub-National Elections in Russia: Variations in
Edinaya Rossiya's Domination of Regional Assemblies’, Europe-Asia Studies 65 (4):
737-752
• Petrov, N. (2002). ‘Seven Faces of Putin’s Russia: Federal Districts as the New Level of State–Territorial Composition’ Security Dialogue 33(1): 73-91.
• Petrov, N. (2004). ‘Regional models of democratic development’ in McFaul, M., Petrov, N.V. and Ryabov, A., Between Democracy and Dictatorship. Washington DC: Carnegie Endowment for International Peace.
• Petrov, N. and Titkov, A. (2004) The index of democracy. Available online at: http://atlas.socpol.ru/indexes/index_democr.shtml,. Accessed 3 September 2015. • Putin, V. (2001). Poslanie Federal’nomu Sobraniyu Rossiiskoi Federatsii
27
• Razuvaev, V. (2015), ‘Parlamentskie partii agitiruyut bez osobykh fantazii’,
Nezavisimaya Gazeta, 3 September 2015: 1. Available online:
http://www.ng.ru/politics/2015-09-03/1_partii.html, accessed 18 November 2015. • Reisinger, W. and Moraski, B. (2013) ‘Deference or Governance? A survival analysis of
Russia’s Governors under Presidential Control’, in Reisinger, W.J. (ed.), Russia’s Regions
and Comparative Sub-national Politics. Abingdon/New York: Routledge: 40-62.
• Remington, T.F. (2003) ‘Majorities without Mandates: The Russian Federation Council since 2000’, Europe–Asia Studies 55(5): 667–91.
• Reuter, J.O. and Remington, T.F. (2009) ‘Dominant Party Regimes and the Commitment Problem: The Case of Edinaya Rossiya’, Comparative Political Studies 42: 501-26. • Rose, R. (2009). Understanding Post-Communist Transformation: A Bottom-Up
Approach. London/New York: Routledge.
• Ross, C. (2002) Federalism and Democratisation in Russia, Manchester University Press. • Ross, C. (2010) ‘Federalism and Inter-governmental Relations in Russia’, Journal of
Communist Studies and Transition Politics, 26(2), 165-87.
• Ross, C. (2014) ’Regional Elections and Electoral Malpractice in Russia: The
Manipulation of Electoral Rules, Voters, and Votes’, Region: Regional Studies of Russia,
Eastern Europe, and Central Asia 3(1): 147-72.
• Rosstat (2013) Regiony Rossii: osnovnye kharakteristiki sub”ektov Rossiiskoi Federatsii
2013. Statisticheskii sbornik. Moscow: Rosstat.
• Rosstat (2014) Regiony Rossii. Sotsial’no-ekonomicheskie pokazateli – 2014 g. Moscow. Available online:
http://www.gks.ru/wps/wcm/connect/rosstat_main/rosstat/ru/statistics/publications/catalog/doc_11386235 06156, Accessed 10 March 2015.
• Rossstat (2015). The gross regional product per capita in regions of the Russian Federation in
1998-2013gg. Available online at: http://www.gks.ru/free_doc/new_site/vvp/dusha98-13.xlsx, Accessed 3
September 2015.
• Ruble, B.A., Koehn, J. and Popson, N.E. (eds.) (2001) Fragmented Space in the
28
• Russian Constitution (1993). ‘Konstitutsiya Rossiiskoi Federatsii’, passed 12 December 1993. Official document available online from Kremlin:
http://constitution.kremlin.ru/constitution.pdf, accessed 18 November 2015.
• Ryzhenkov, S. 2011, ‘Local Regimes and the "Power Vertical"’, Russian Politics and
Law 49(4): 53-63.
• Sharafutdinova, G.(2010). ‘Subnational Governance in Russia: How Putin Changed the Contract with His Agents and the Problems it Created for Medvedev’, Publius: The
Journal of Federalism 40(4): 672-96.
• Slider, D. (1996) ‘Elections to Russia’s Regional Assemblies’, Post-Soviet Affairs 12(3): 243-64.
• Smirnova, M. (1998) ‘Gubernatorskie vybory: izbiratel’nyi marafon 1996–1997 gg’,
Vlast’, no. 4: 28–36.
• Sobyanin, A.A. and Sukhovol’skii, V.G. (1995). Demokratiya, ogranichennaya
falsifikatsiyami: vybory i referndumy v Rossii v 1991-1993 gg. Moscow: Project Group
for Human Rights.
• Stadelbauer, J. (1996)‘ Zur regionalen Differenzierung der Duma-Wahlergebnisse’,
Osteuropa 46(5): 449–57.
• Stoner-Weiss, K. (1997). Local Heroes: The Political Economy of Russian Regional
Governance, Princeton, NJ: Princeton University Press.
• Turovskii, R. (2010), ‘How Russian Governors are Appointed: Inertia and Radicalism in Central Policy’, Russian Politics and Law 48(1), 58-79.
• Zakharov, A. 2011, ‘Russian Federalism as a "Dormant" Institution’, Russian Politics and