Master
's thesis • 30 credits
Agricultural programme – Economics and Management
Can tourism Seal the deal?
-
an explorative study on Seal
tourism in Sweden
Sälturism -en undersökande studie av Sveriges
Sälturism
Can tourism seal the deal?
-an explorative study on seal
tourism in Sweden
Sälturism - en undersökande studie av Sveriges Sälturism
Ebba Alteg
Supervisor: Staffan Waldo, Swedish University of Agricultural Sciences, Department of Economics
Examiner: Jens Rommel, Swedish University of Agricultural Sciences, Department of Economics
Credits: 30 hec
Level: A2E
Course title: Master thesis in Economics Course code: EX0907
Programme/Education: Agricultural programme –
Economics and Management 270,0 hec
Responsible department: Department of Economics
Faculty: Faculty of Natural Resources and Agricultural Sciences Place of publication: Uppsala
Year of publication: 2019
Name of Series: Degree project/SLU, Department of Economics Part number: 1255
ISSN 1401-4084
Online publication: http://stud.epsilon.slu.se
Acknowledgements
I would like to express my gratitude towards my supervisor Staffan Waldo for his tireless support and feedback throughout the process, thank you! I also want to thank Sven-Gunnar Lunneryd for his very valuable comments on the survey. Furthermore, I want to thank the company managers that spent their time answering the survey. A special thanks to my friends Tina Sandell and Stefan Merza for constructive comments. Finally, I want to thank my dearest family and friends for cheering me on.
Abstract
The increased seal populations in the Swedish coastal areas have resulted in increased damages for fishing companies with associated costs. The negative aspect of seals has been quantified (costs for small-scale fishers) but both negative and positive aspects of natural resources must be considered for politicians to make efficient policy decisions. This
explorative study is a first approach to the positive aspects of the seal; seal tourism. By using an online survey is information gathered of the entire industry; characteristics of the
companies, the seals’ role for the industry and the companies’ obstacles for developing their seal tourism business. The result suggest that the estimated size of the industry is
approximately 56 companies and the entire industry had revenues generated from seal tourism by a total of approximately 9.85 million SEK (as of 2017). According to the study’s result, the industry’s employment corresponds to approximately 64 full-time jobs (including the owner’s work). The industry expresses that their business potential would benefit from the current size of the grey seal and the harbour seal population, which motivates license hunting. In essence, should seal management policies consider seal tourisms since it is a sustainable and profitable way of utilizing a natural resource while it also has future possibilities to contribute with employment and development in coastal areas.
Sammanfattning
Ökningen av sälpopulationerna har orsakat stora skador och kostnader för den svenska småskaliga fiskenäringen. Kostnaderna som sälarna orsakar har uppskattats men för att politiker skall göra informerade beslut behövs även kunskap om de positiva sidorna av sälar. Därför görs en enkätstudie av Sveriges sälturism där information om företagens storlek och karaktär samlas in. Även sälens roll för företaget och företagets upplevda hinder för
utveckling av verksamheten undersöks. Resultatet av enkätstudien tyder på att
sälturismnäringen består av cirka 56 företag som har intäkter från sälrelaterad verksamhet varje år motsvarande ca 9.85 miljoner kronor. Sälturismnäringen sysselsätter motsvarande totalt 64 stycken heltidstjänster. Företagens affärsmöjligheter gynnas av den nuvarande storleken på gråsäl och knubbsäl, vilket stärker motiven för licensjakt. Sammanfattningsvis bör sälförvaltningen ta hänsyn till sälturismen då det är ett hållbart sätt att skapa värde och nyttja en naturresurs samtidigt som det bidrar till sysselsättning och utveckling i de svenska kustområdena.
Table of Contents
Table of Contents ... 4 1 Introduction ... 7 1.1 Seals in Swedish coastal areas ... 8 1.2 Seal management ... 9 1.3 Problem statement ... 9 1.4 Aim and method ... 10 1.5 Definition of seal tourism ... 11 1.6 Structure of the report ... 11 2 Theoretical perspective and literature review ... 12 2.1 Theoretical framework ... 12 2.1.1 Externalities ... 12 2.1.2 Property rights ... 12 2.1.3 Wildlife and population size ... 13 2.1.4 Valuating wildlife ... 13 2.2 Previous studies ... 14 2.2.1 Estimating costs and benefits of wildlife ... 14 2.2.2 Wildlife management policies ... 15 2.2.3 Tourism ... 15 2.2.4 Considering the seal tourism ... 16 3 Survey and data description ... 18 3.1 Sample background ... 18 3.2 Survey design ... 18 3.3 Survey implementation ... 20 3.4 Statistical adaption and response rate ... 20 3.5 Methodology reflections ... 20 4 Empirical data ... 22 4.1 The size and characteristics of the industry ... 22 4.2 The role of the seal ... 23 4.3 Obstacles ... 25 5 Analysis and discussion ... 26 5.1 The seal tourism industry ... 26 5.2 The seal and the business ... 27 5.3 Obstacles ... 28 6 Conclusions ... 30 References ... 31 Appendices ... 34List of figures
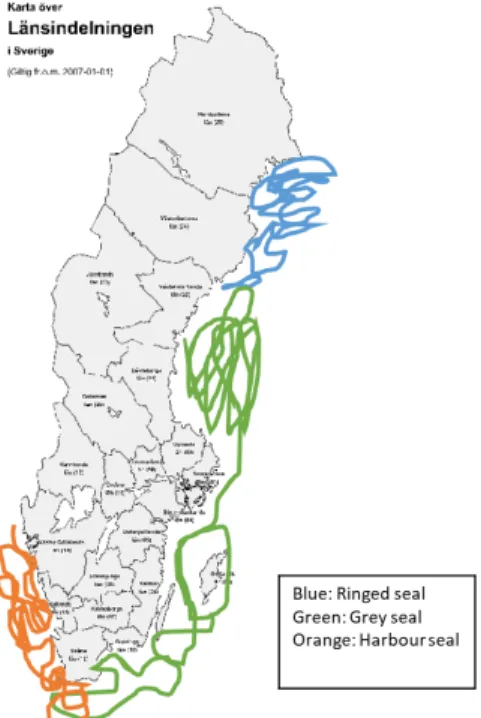
Figur 1. Overview of the seals habitats in Swedish coastal areas. Own adaptation from SCB ... 8
Figur 2. The relationship between the fish stock and growth. Own adaptation of Tietenberg & Lewis (2009, p204) ... 13
Figur 3. The responding seal tourism companies regional distribution. Own adaption of map from SCB. ... 22
Figur 4. The distribution of preferred sizes of the different seal species populations ... 24
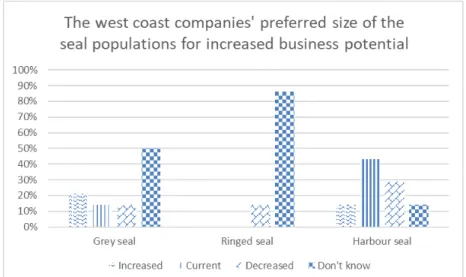
Figur 5. Distribution of the west coast's preferred size of seal populations ... 24
Figur 6. Distribution of the Baltic Sea companies' preferred size of the seal populations ... 25
List of tables
Table 1. The regional distribution of the total population and the companies that answered the survey. ... 21 Table 2. Distribution of the companies experienced obstacles and shares of large and no obstacles. 25Abbreviations
HaV: The Sea and Water Authority of Sweden, Havs och Vattenmyndigheten IUCN: International Union for Conservation of Nature and Natural Resources SCB: Statistics Sweden
HELCOME: The Baltic Marine Environment Protection Commission - Helsinki Commission EPA: Swedish Environmental Protection Agency, Naturvårdsverket
WTP: Willingness to pay for hypothetical changes in the supply of a public good, used in cost-benefit analysis) (Gren, Häggmark-Svensson, Elofsson, & Engelmann, 2018)
1 Introduction
Seals have since the 1900th century been a subject of debate, where society’s opinion has changed over time (HaV, 2014). At the beginning of the 1900th century, an international campaign in the Nordics initiated with the expressed objective to extinct the Baltic Sea populations of seals. It did not succeed but the population was massively reduced (ibid). Today society’s opinion has shifted towards protective interest, which is pervading the European Habitats directive (European Council directive, 1992 B). Also illustrated by the EU seal regime launched 2009 which prohibits seal products on EU-market (European
Commission & Directorate-General for the Environment, 2016).
The seal is a top consumer; hence environmental toxins are gathered in their fatty tissue (HaV, 2014). Seals’ health is therefore an indication of the pressure of environmental toxins in the ocean. Large populations of seals can be regarded as signs of a thriving and functioning eco-system and is perhaps the reason for society’s interest in seals. The recent years increased populations have resulted in problems for the fishing industry as they are sharing the fish resource with seals.
After recovering from the mass-hunt in the early 1900th century, the seal population experienced a new decrease. Afterwards the first outburst of the European seal epizootic in 1988, the mortality levels were 50-60 % in the Baltic Sea, Kattegat and the Skagerrak (Heide-Jørgensen, Härkönen, Dietz, & Thompson, 1992). The massive decrease in the harbour seal population in 1988 initiated the discussion if it was a natural phenomenon or if it was a result of humans’ actions such as pollutions and overfishing. Since then, the stock of seals has recovered and continues to grow, but remains a debated predator (HaV, 2014) .
Today seals are a topic of discussion in the fishing industry. The increased populations are causing extensive damages to the small-scale fisheries and ultimately affecting their economic viability. The costs of the seals’ damage on fisheries were estimated in 2005 to approximately 33 million SEK /year excluding “hidden costs”, which refers to the unknown part of the catch that the seals eat but leaves no traces in the gears (HaV, 2012 B). Consequently has the damage on gear and lost catch negatively affected the viability of the small scale fisheries’ (Waldo, Paulrud, & Blomquist, 2019). The increased seal population can therefore be argued to threaten humans’ interest. This conflicts with the government’s intention to encourage rural development and small scale businesses in the marine environment (Regeringskansliet, 2015). A negative external effect can be argued, as seal conservation doesn’t appear to consider the cost it imposes on those deriving utility from the fish stock seals feed on (the fishing
companies). External effects limit the possibility to find an efficient level of
conservation/harvest, as all costs of the activity are not considered in the decision-making (Tietenberg & Lewis, 2009). This creates a conflict and a management problem of wildlife where effective policy instruments could be used to re-allocate the potential asymmetry of costs and benefits associated with the current seal population level (Perman, Ma, Common, Maddison, & Mcgilvray, 2011).
To design efficient policies, both positive and negative aspects of a resource must be assessed. Attempts that examine the costs of the damages are done but it is necessary to focus on the benefits and positive aspects of seals as well. Consequently, this study surveys the supply of the so far unknown seal tourism industry in Sweden, which could potentially be an important aspect of seals to consider in policy design. Therefore will the current structure and scope of the Swedish industry be assessed for the first time to conclude, what business potential seal
tourism has, what obstacles they are experiencing and if any preferences of seal management policies can be concluded from their expressed preferences and obstacles.
1.1 Seals in Swedish coastal areas
In the Swedish coastal areas, three different seal species exist, ringed seal, harbour seal and grey seal. They are aquatic predators who are all part of the family Pho’cidae and are
characterized with an elongate body, smooth fur and no external ears. The three species don’t have fixed habitats but occur more often at certain parts of the Swedish coastal areas. See figure 1. The grey seal is the most common species and exists mainly in the Baltic Sea and the southern Gulf of Bothnia. The ringed seal mainly exists in the North’s in the Gulf of Bothnia, the Gulf of Finland, and the Gulf of Riga and in the Archipelago Sea. The harbour seal is dominating southwest, in Öresund, Kattegat and Skagerrak (HaV, 2014).
In 2014 the counted number of ringed seals was 9750, whereof 8100 individuals were found in the Gulf of Bothnia. Which can be compared to approximately 2000 counted seals in 1988, illustrating merely a growth rate of 4.8%. The number of calculated harbour seals in Kalmar Strait was approximately 1000 and in Skagerrak and Kattegat 14682 harbour seals were counted. The number of counted grey seals was in total 32240 in 2014. Irrespective of
counting techniques, the number of observed seals corresponds to approximately 60 – 80 % of the total population.
None of the seal species is currently red-listed/risk extinction according to IUCN (IUCN, A, B, C, 2019). The ringed seal is red-listed as “vulnerable” nationally and internationally according to IUCN in 2014 (ibid). In 2016 the trend of the Baltic ringed seal was classified with “the least concern”. The Baltic ringed seals currently show an increasing population trend (IUCN, A, 2019). The grey seal and harbour seal have recently not been threatened of extinction in the Baltic/Nordic areas. Today the population trend in the world is unknown for harbour seals but they are classified as “least concerns” according to IUCN (IUCN, B, 2019).
The grey seal had in 2014 a favourable conservative status in the Baltics, which still is the case. According to IUCN, they experience an increasing population trend (IUCN, C, 2019).
1.2 Seal management
The Swedish seal management plan for grey seal, harbour seal and ringed seal is based on recommendations expressed by HELCOM (HaV, 2012 A). HELCOM states that the total impact of seals on human’s interest should be positive or neutral and management plans should be developed to assure Favourable Conservation Status (HaV, 2014). The aim of a preservative status for the seal population is met, but it is not clear that the seal’s effect on human’s interest is unanimous neutral or positive.
The seal management policies are currently including hunting of seals, protected areas and support to the affected stakeholders. To limit the costs and damages associated with seals, the fishermen have possibilities to apply for economical support to invest in seal proactive
equipment. Likewise can counties, municipalities and organisations apply for support with the purpose of developing new equipment and protective measures (A, HaV, 2016).
Because protective measures do not always limit the damages enough, is hunting necessary, a sort of regulated harvest (Treves & Karanth, 2003). The EPA issues protective hunting for all three species at varying extent (EPA, 2019). Protective hunting is issued for particular
populations/individuals who are damaging and or threatening human’s interest. The protective hunting is either issued on EPA’s initiative or by individuals who hand in a formal request. In comparison to protective hunting, license hunting does not aim at a particular individual or population. It is a management instrument used to assure a sustainable harvest of the
carnivore population, which is not solely dependent on the current damage they have on a particular stakeholder. The EPA has on request by the government investigated if license hunting on seals is feasible, and concluded it is (ibid). The Parliament voted yes for license hunting in April (2019), implying that licence hunting will likely be introduced in the future (Riksdagsförvaltningen, n.d.).
Seal sanctuaries are a form of conservative policy used to ensure that seals are not disturbed at crucial and vulnerable moments (B, HaV, 2016). Generally, access to certain areas is
forbidden at particular times of the year. Besides can nature sanctuaries sometimes be issued where amongst other species, also seals flourish. These areas are not explicitly created in conservative purposes for seals but are nevertheless the effect.
1.3 Problem statement
Conflict arises between humankind and seals since fishermen and seals are dependent on the same fish resource. Ineffective management policies could result in threatening the seals’ existence through illegal hunting effort (Treves & Karanth, 2003). Furthermore, a non-effort of redistributing the costs of the seals would potentially result in a deficit of the fisheries companies if the costs of seals become unbarring to carry for the industry.
To formulate an effective policy that can solve the seal management problem, must all benefits and costs associated with the resource be known to reallocate costs and benefits that are potentially asymmetrically distributed (Perman et al., 2011). Currently, the costs of seals are known, the benefits are not. Since natural resources commonly possess both user and non-user values (ibid), must both be assessed when estimating society’s total utility of them. Seal tourism must be considered, both in the aspect of enabling future estimates of social benefits of the resource but also from a current national interest of supporting maritime industries in
Swedish coastal areas as expressed by the government’s Maritime strategy (Regeringskansliet, 2015).
The Swedish seal tourism industry has never been examined, it exists no quantitative information of the scope of the industry, their revenues nor how many people they employ. Swedish seal tourism could (similar to other types of wildlife tourism) potentially possess economic contribution to society, profits as well as recreational benefits (Barnes, Schier, & Van Rooy, 1999). Supply of the seal tourism is thus a first and relevant aspect to consider in this resource management problem. Especially since it could be a sustainable and effective way of utilizing a wildlife resource (assuming it is used in a non-consumptive way) which provides an economic contribution to society through employment in rural areas similar to what recreational fishing tourism does (Paulrud & Waldo, 2010).
Because we don’t know how many companies offer seal tourism or where they operate, it is impossible to foresee how the supply of seal tourism would be affected by different seal management policies. By studying the structure of the industry, it will be possible to address how the industry expects different seal management policies to affect their business
opportunities and finally the importance of the seals for their business. Consequently, it is necessary with an explorative study that can conclude how and to what extent seal tourism is a factor to consider in seal management.
1.4 Aim and method
The purpose of this study is to explore the benefits of seal tourism in Sweden. Additionally is the aim to discover the importance of the seals for the supply of seal tourism and its business potential. This study will gather information on the industry’s current situation and structure. The information will be used to evaluate the potential economic importance and future of seal tourism. In addition, will the paper conclude how and if different seal management policies affect business opportunities, or if there are other more important obstacles the seal tourism industry is experiencing. The result will enable a discussion of seal management policies effect on the industry, and potential policy implications for facilitating the industry’s development. Finally, this study will answer the research questions below.
What is the size and characteristics of the seal tourism industry?
What is the seal tourism industry’s preferences of seals’ population sizes?
What obstacles is the Swedish seal tourism industry experiencing developing its seal tourism business?
To address the purpose of this study, the chosen method is an explorative approach to the supply of seal tourism. Since no information exists of the industry will empirical data be gathered using surveys to collect information about the industry’s characteristics,
management preferences and obstacles for developing their businesses. The results of the survey will be presented and analysed to answer the research questions and to discuss potential policy implications of seal management.
This is the first attempt of a national supply approach to seal tourism and the scope is limited to the chosen topics of this study. Therefor will this study be strictly limited to the supply aspect of seal tourism, and not the demand. Consequently will this study not estimate the commonly assessed individuals’ utility of seals. Nor is this study an attempt at assessing the
economic impact of seal tourism, such as upstream and downstream effects commonly assessed in CB analysis (Gren et al., 2018).
1.5 Definition of seal tourism
The chosen term used in this study is seal tourism. This is chosen because it doesn’t exist any formal definition for this business. The term includes any form of tourism that in some way involves seals. For example, a boat trip with seal watching, kayaking with seals and seal hunting. This can be regarded as a type of wildlife tourism (Newsome, Dowling, & Moore, 2005).
1.6 Structure of the report
The paper will continue in the following order. Relevant theory and literature are presented in chapter 2. Followed by the methodology chapter 3, where the chosen method is motivated and described. Results are presented in chapter 4 and discussed and analysed in chapter 5. The paper ends with the conclusion of the study’s findings.
2 Theoretical perspective and literature review
In 2.1 is the relevant theoretical framework addressed, followed by a presentation of relevant previous studies in chapter 2.2.
2.1 Theoretical framework
This section provides theories relevant to the seal management problem that is addressed in the literature review and the empirical section.
2.1.1 Externalities
Externalities or external effects appear when production or consumption decisions made by one agent have an impact on another agent’s utility or profit in an unintended way and the creator of the impact makes no compensation/payment to the effected agent (Perman et al., 2011). Because no information about the seal tourism industry is known, it is not certain if and how the seal tourism industry is affected by different seal management policies. It is therefore interesting to address how the industry appears to be affected by the currently existing seal management policies. Therefor is the seal management policies (seal sanctuaries and seal hunting) included in the study’s survey.
Imperfect information occurs when the agents are not aware of the effect of their decision making (Perman et al., 2011). That can create an un-known effect for another agent that consequently becomes an externality as it’s not known and therefore not controlled for on the market. This results in the inefficient allocation and is solved with information spreading. It motivates the gathering of information about the seal tourism industry (one of the agents) since it could improve the possibilities to find an efficient seal management policy. In aspect of the questionnaire design, it motivates decisions made to increase the response rate. A higher response rate is necessary to retrieve accurate information about the industry, which is the purpose of the study and a necessity to support efficient resource management.
2.1.2 Property rights
An owner of a resource with defined property rights has incentives to efficiently use that resource because the decreased value of the resource represents a personal loss (Tietenberg, & Lewis, 2009). On the contrary, if private property rights are not assigned can a resource be regarded as “open-access” or “common property”. The common property resource is characterized by exploitation that is controlled by some sort of legal or customary
conventions (ibid). Seals can be regarded as a common property resource as the management of seals in the Baltic sea is based on conventions decided in EU (European Commission & Directorate-General for the Environment, 2016).
Property rights are discussed in wildlife management as attempts of creating markets for benefits and costs of wildlife and thereby limit the externalities (Tietenberg, & Lewis, 2009). Private property rights are argued to provide an economic incentive for management of endangered species as landowners can market wildlife and thereby creating markets for hunting rights. This creates economic incentives to manage wildlife populations efficiently (Gren et al., 2018). However, if demand for hunting/ and or watching is too low, incentives are limited for preservative management. It is therefore relevant to address how the seal tourism industry experiences the non-existing exclusive property rights For example, if competition of seal watching places or seal sanctuaries are a problem or not.
2.1.3 Wildlife and population size
The renewable resources are characterized by the possibility for reproduction and growth over time, like biological organisms with a growth capacity (Perman et al., 2011). The renewable resource can be of flow or stock characteristics. In theory, could the seal population be classified as a form of renewable stock resource as its future population is dependent on the population size today. The stock is the population size and the flow is the biological growth rate.
The biological dimension of resources is based on the populations’ growth function but can be applied to seal populations as well. The Schaefer (1957) model expresses the relationship of growth of fish populations and the fish populations size, assuming that the potential random influences balance out each other in the long term. A catch corresponding the growth rate will assure that the stock size remains the same. From figure 2 can each population size’s
sustainable yield be shown. S* is called the maximum sustainable yield population (Tietenberg & Lewis, 2009). Maximum sustainable yield is equal maximum growth and represents the largest harvest that continuously can be sustained. In the long run, would larger catches than S* result in the extinction of the species. Maximizing sustainable yield is not uniform with efficiency as efficiency is reached when maximizing the net benefit of the resource usage. Currently, the hunting effort of seals is below the maximum sustainable yield as the stock continues to increase. This means that the hunting effort of seals could increase without threatening the seals’ existence (Havs-och Vattenmyndigheten, 2014). The industry’s preferred population size is therefore addressed in the study. It gives a directly applicable indication of what seal management policy (conservation/harvest) the industry would benefit from.
Figur 2. The relationship between the fish stock and growth. Own adaptation of Tietenberg & Lewis (2009, p204)
2.1.4 Valuating wildlife
Different cost-benefit approaches are used to put a monetary value on natural resources to consider them as regular economic inputs and outputs (Perman et al., 2011). Wildlife is one type of natural resource that creates benefits and costs to humankind. The associated costs of wildlife can, for example, be predation on livestock and destruction of crops. Benefits of wildlife are for example ecosystem favours and recreational activities. The recreational activities have received more attention lately, where wildlife tourism is now an important economic and recreational aspect of wildlife, especially the non-consumptive kind like wildlife watching (Duffus & Dearden, 1990).
The benefits from wildlife resources are in economic theory said to consist of two types of values, user value and non-user value (ibid). Within the user-value category, there are
consumptive user values and non-consumptive user-values. The consumptive user-value is, for example, the value of hunting wildlife. The non-consumptive user-values include values of recreational activities, like seal watching. The other category, non-user values refer to the benefit an individual may gain from a resource without directly or indirectly physically interact with it. These types of values are called “existence values” and must be taken into consideration when assessing the entire benefit of a natural resource (ibid). Seal tourism can be regarded as a benefit and this study will address if and how the business is a provider of user value, of the consumptive and non-consumptive kind (seal watching and seal hunting).
2.2 Previous studies
This section addresses the relevant articles regarding wildlife population size and
management policy. Additionally, are relevant studies with supply approaches to tourism presented.
2.2.1 Estimating costs and benefits of wildlife
Boman, Bostedt, & Persson (2003) develop a bioeconomic model that maximizes net benefits of wolfs in different Swedish areas, and thereby take both biological and wolf-specific factors into account. The objective function includes varying spatial distributions and associated stock costs (loss game animal) and stock benefits (user values as hunting, tourism) as well as the rate of population change in each area. The result is very sensitive to the assumptions of harvest benefits and existence value; therefore it’s challenging to specify an absolute size of the population. This enlightens the difficulties of estimating the optimal level of wildlife populations in absolute terms and the importance of information about user-value when calculating net-benefits. It empathizes the importance of assessing the entire benefits of a natural resource to properly estimate at what usage level net-benefits are maximized. In essence, it is challenging but possible to estimate the optimal population size of wildlife, assuming information about user value is known.
Stage structured approaches are used for maximizing net benefits and identifying the unique utility-maximizing population. Skonhoft (2006) investigates costs of moose predation due to the augment of the wolf population in Scandinavia. First, the cost to the landlord is analysed (illustrating the hunting value that belongs to landlords) and secondly the cost of moose-vehicle accidents. The costs are then used in the reduced-form ecological model, to analyse different management programs (of wolfs) in equilibrium. They conclude also by using Norwegian data, that the cost the landlord’s experienced from moose predation is strongly dependent on what management goal is set. Threshold harvest, proportion harvest, quota harvest, or present value profit maximizing is considered. The ones that considered yield, reduced profits while the proportion schemes gave no clear result. The study investigates how management policies affect the stakeholders’ benefits. It is relevant as the
stakeholders/operators business opportunities potential impact on wildlife conservation is addressed.
The endangered species existence values are often estimated as an attempt of assessing the full value of the animal. One example is wolves, known as environmental “bad” and “good”. The period between 1972 and 1992 the marginal social cost of wolfs was approximately 75 000- 95 0000 SEK/year (Boman, 1994a). Further is a contingent valuation method used to estimate benefits of different population sizes of wolfs in Sweden and discovers that the existing value of wolfs are not dependent on the stock size, but rather it’s vitality ( Boman & Bostedt, 1999). The study can’t relate WTP directly to the population size, because it is possible that the responders are only paying for the existence level (viable level). No marginal
effect of increased supply is detected. They conclude that the average WTP of a viable wolf population amounts to 700-900 SEK (DC) and 100-200 SEK (OE) respectively. Due to the similarities with wolves and seals it is plausible that WTP of seal populations are similar the value of wolves. However, it is also an example of literature that doesn’t manage to relate the utility of wildlife with the population size.
Using Choice experiment methods Delibes-Mateos et al. ( 2014) assess the hunter’s preferences of ecological attributes for hunting estates in Spain. The survey regarded
commercialized hunt of red-legged partridge. They conclude that the hunters value the wild games (instead of breaded), possibility to hunt other small game species and natural
vegetation on the hunting estate and presence of non-hunting species. This illustrates an example of a method that can address preferences of conservative management of natural resources. They encourage further investigation of stakeholders’ opinions on conservation and management of natural resources as different stakeholders sometimes appear to have cohesive thoughts.
2.2.2 Wildlife management policies
Most of the literature on wildlife management focuses on population sizes, only a limited amount of literature is focused on policy design (Gren et al., 2018). Swanson & Barbier (1992) prove an example of successful wildlife management, where African wildlife went from state-owned into active resource controlled by commercial farmers and smallholders. Limited amount of trophy hunting created great economic gains for the villages. It’s a policy approach where people who have experienced property loss get compensated meanwhile the resources are managed sustainably.
Another empirical example is Lindsey, Alexander, Frank, Mathieson, & Romanach (2006) who illustrate that wildlife tourism could be an incentive for wildlife conservation. By interviewing hunting operators from Africa and their US clients, it’s shown that the clients’ preferences include values that could be of gain to the conservation of wildlife. This creates incentives for business opportunities and changes of opinions regarding conservation and is an example where the assignment of private property rights can have positive effects on wildlife management as it creates a market for hunting rights. Despite large differences between African game animals and seals, the two examples illustrate the positive effect property rights can have on wildlife conservation.
2.2.3 Tourism
Limited attention is given to supply of wildlife tourism, hence is a broader spectre of tourism literature relevant as they include supply approaches that are relatable to this study. Special attention is given to agricultural tourism and different kinds of fishing tourism.
Paulrud & Waldo (2010) surveyed the Swedish recreational fishing industry’s current structure and the companies’ view of future challenges and preferences of governmental actions. They estimated that the industry consisted of approx. 1300 companies and total revenues of 500 million SEK produced by 1000 employed full-time equivalents. The companies are mainly located in the northern rural areas of Sweden, which suggests contribution to regional employment and development. The companies provide different services to recreational fishers and many diversify their activities. The main obstacles associated with developing their business were labour costs, lack of varieties of large fish, marketing and receiving bank loans for investments.
Using the data from the survey in Paulrud & Waldo (2010), they address which characteristics of enterprises are important for the associated obstacles of developing their recreational fishing businesses in Sweden (Waldo & Paulrud, 2012). An ordered logit model is used to estimate the relationship between company characteristics and their view of the obstacle (if severe or not). The companies that view lack of fish/large fish as a severe problem is
characterized by salmon fishing in fresh waters, guides, marine fishery and are located close to a large city. Exclusive access is regarded problematic for companies that provide guidance services, larger companies and companies in the northern part of Sweden. Marketing is problematic for food and accommodations companies. Policy measurement is presented with respect to the fact that the fishing resource has several stakeholders whose welfare effects of introducing pro-recreation fishing policies are not evident.
The role of farm tourism in rural development is addressed by Sharpley & Vass (2006). Based on surveys in Northeast England, is farming families’ perception of diversification into
tourism and the associated challenges addressed. They conclude that farms engage in tourism businesses to increase profits, which it does. The farmer regards the tourism supply as an important factor and express that the diversification of farm tourism is an employment issue rather than a diversification issue (Sharpley & Vass, 2006). This implies policy measurements for continuing and not starting up businesses, which has previously been the focus in politics. Fleischer & Tchetchik (2005) includes consumer and producer aspect on the role of
agriculture on rural hospitality tourism. From a selected sample of tourism operators, a hedonic price study is completed on tourists’ preferences of rural tourism. They conclude that people don’t value if the farm is working or not, but a location with tourist attractions
increases the WTP. Additionally is the suppliers’ production function of rural
accommodations econometrically estimated to conclude that having an agricultural business increase the firms overall productivity. This suggests that diversification or additional businesses are beneficial from a business perspective as it increases the company’s productivity.
Saarinen (2003) examines the regional economy of tourism in the northern part of Finland by reviewing several studies on finish tourism. The articles assess direct/ indirect effects and multiplier effects. The income and employment of tourism vary and the recreational services are more employment-oriented than other accommodation businesses. Another example of the regional economic effect of different kinds of wildlife tourism is the economic impact of the white-tailed deer hunting in Mississippi (Grado, Hunt, & Whiteside, 2007). By calculating the indirect and direct effect of spendings via hunting tourism they calculate the hunting tourism spending’s in the county to approximately 80.78 million US dollars. The study is one example of the many studies on multipliers effects of tourism that illustrates the economic importance of wildlife tourism.
2.2.4 Considering the seal tourism
Wolves and seals have several similarities. Wolves are important to society because it has a great impact on other agents. Wolves and seals have been debated predators and are
commonly addressed by animal protection agencies(‘Varg’, n.d.) (‘Sälar i Sverige’, n.d.). Since wolves are the most similar predator addressed in economic literature, they are particularly relevant for this study. From literature, we know that by using a bioeconomic spatial distribution model it is possible to estimate the optimal population size of the predator that maximizes net benefits, even though the model faces difficulties assessing the population in absolute terms (Boman et al., 2003). The results suggest that the benefits from tourism and
the existence value could be substantial and should therefore not be neglected in policy design. To do a similar estimation of the seal population must information about the benefits be known. Hence, this study can contribute with gathering information about user-benefits, which is a first step in estimating which seal population size maximizes society’s utility. Also, can this study confirm if benefits from seal tourism are substantial, similar to the benefits of wolves. Further is the moose- wolf relationship interesting as we learn that the management program affects the stakeholder’s (landowner’s) benefits notably (Skonhoft, 2006). This suggests that the seal tourism industry’s benefits could be strongly affected by the management policies of the seals. This study can provide an empirical example of how wildlife tourism industries benefits could be affected by management policies.
Most wildlife management policy studies address American or African game animals, which commonly are grand tourism industries (Gren et al., 2018). Seal tourism is not comparable size-wise, but it is an example of wildlife management policies that could potentially be applicable in Sweden. For example, the increased interest of wildlife conservation due to assigning exclusive property rights. The two studies of wildlife policies are included to illustrate how wildlife tourism can create incentives for wildlife conservation, which is an important aspect to consider when studying unknown wildlife tourism like seals.
Nevertheless, is limited literature addressing management policies concerning animals’ population size and utility. Hence it is challenging to implement the estimates from literature to actual policies, as the benefits/costs of animals are not necessarily related to the number of animals. This study ad to the existing literature by addressing benefits of wildlife tourism and the stakeholder’s preferred population size.
Paulrud & Waldo (2010, 2012) illustrates an approach to gather new information of an initially unknown sector like the recreational fishing tourism industry, which is useful as it is very similar the seal tourism industry. Like seal tourism, the industry operates in maritime Sweden, and they compete with other agents (professional fishermen and other tourists). Nevertheless is the industry much larger than what the seal tourism industry can be expected to be. The result illustrates that wildlife tourism provides work opportunities and regional development. This study will be able to address if the seal tourism industry has similar characteristics and if they experience similar difficulties like the recreational fishing industry. Further, the literature addressing agricultural tourism illustrates examples of wildlife tourism from a supply point of view. It points out general organizational aspects of wildlife tourism industries (diversification, productivity) that are important for understanding the seal tourism industry and including relevant questions in the survey. The example of multiplier effects of tourism is included because it exemplifies the large economical effect wildlife tourism can have on society. This study can therefore confirm or reject if seal tourism can contribute with large economic effects like the White-tailed deer hunting (Grado et al., 2007).
To conclude, very limited attention is given to supply of wildlife tourism and non-regarding seal tourism. Therefore is this study’s largest contribution to address the supply of a so far un-known wildlife tourism sector. The previous studies illustrate that wildlife tourism is an important aspect of wildlife conservation, successful businesses and a contributor to rural employment and development. This study is an attempt of confirming if this is the case for the Swedish seal tourism industry as well. The inclusion of preferred population sizes is an
attempt to address the so far very limited aspect of utility and population size. The study can contribute with a rare but necessary explorative approach to the benefits of wildlife.
3 Survey and data description
This chapter describes the sampling method in 3.1, followed by the survey design in 3.2. Then the survey implementation is addressed in 3.3. The statistical adaption is presented in 3.4. Finally, 3.5 discusses the method.
3.1 Sample background
It exists no information if a company supplies seal tourism or not. Hence it is challenging to use a common random sample of Swedish companies, as it is very uncertain that the target population is within the random sample. Therefore, is instead a judgement sample method used. A sort of non-probability technique were the group of respondents is hand-picked for the study (Rahi, 2017). A judgement sample is appropriate for the objective of this study as it exists no information, the sample is very small, and the survey regards topics that are only of relevance/possible to answer if conducting business with seal tourism. Hence, have my own judgement been used to create the sample group which I also argue represent the entire target population, i.e. all seal tourism companies, with exception of the potential unidentified companies.
Prior research was made to identify the target population. I discovered a total of 62 companies by using systematically search phrases in the search engines Google, Eniro and Gula sidorna. The words used were “seal tourism”, “seal watching”, and “seal hunting”. The local tourism-information centres were consulted to confirm that no companies were left out. The research is based on the assumption that all tourism companies have webpages, as Sweden is one of the European countries with the highest level of digitalized economy (measured in
connectivity, human capital, use of the internet, integration of digital technology and digital public services) (European Commission, 2019 A). Thus, it’s plausible to assume that today’s tourism business must be online alternatively have contact with tourism centres. This raises a risk that not all seal tourism companies are included in the survey but no alternative sampling method is plausible because of lacking registration of seal tourism.
My assumption about companies Internet-awareness includes companies that offer seal hunting. I located two companies that according to their web page offered seal hunting. However, as only two companies out of 62 offered seal hunting, it implies that there could be unknowns that are not included in the sample. Alternatively is seal hunting tourism very limited. That is not unlikely due to the ban of seal products and restrictive hunting policies (European Commission & Directorate-General for the Environment, 2016). On another note, could marketing efforts of seal hunting be limited due to controversy, which motivates the argument of unknowns.
3.2 Survey design
The chosen distribution channel is an email survey using the web-based software Netigate. The survey was sent out in the middle of April 2019. The respondents had 2.5 weeks to answer. Two reminders were sent and with one week left; phone calls were made to the respondents to remind them of the survey.
Throughout the survey are multiple options questions used as frequently as possible to simplify the analysis and facilitate for the respondents. It is an appropriate method when the questions regard sensitive information, like the companies’ turnover (Fink, 2009). However, the category form of questions limits the preciseness of the answers, which is reflected in the result and analysis where no exact figures of for example revenue can be provided. The
chosen format of the questionnaire design is a trade-off between response rate and precise answers. Because this is a first study addressing the industry was the response rate regarded as more important than precise answers. A low response rate would make it challenging to make credible conclusions about the industry. Nevertheless, should the format of the questions be cautiously considered in future studies as the imprecise figures of revenue and employees could be argued to reduce the viability of the study. The survey is treated anonymously in the hope of increasing the response rate, as some may prefer to be anonymous. The survey was sent out in Swedish. In appendix1 and appendix 2 is the survey included in English and Swedish.
Three main topics were chosen for the survey, company characteristics, seals’ role in the company and obstacles for developing their businesses. The first two subjects relate to the first objective. Seals role and obstacles were used to address the second and third objective. Resultantly was the survey quite long with a total of 31 questions, which is extensive but not unreasonable. A long survey could result in a lower response rate (Dillman & Dillman, 2000). However, this study is expected to be of interest for the responder, which can be assumed to motivate participation regardless of the length of the study.
The survey starts with a control question that verifies that the company is within the target population. The control question was necessary in case the sampling was incorrect or the information was not up to date and the company is consequently not part of the target population. Since this is a selected sample, all the responders should be in the target
population. The ones who are not, could be of interest, but this sub-population would likely be very limited and therefore never representative of the entire sub-population and consequently not statistically motivated to include in the study.
The control question is followed by questions regarding the characteristics of the head of the company, gender and age. This is included to get an overview of the socio-economic
characters of the seal tourism companies. Afterwards follows a section on questions of the characteristics of the industry to get an overview of the scope of the industry, where they operate and what contribution seal related activities have to the companies’ revenues. This section ends with a question, which asks to rank the importance of the seal to the entire experience; this is an attempt of addressing how important seals are for the actual seal activity from a producer perspective.
The final section addresses obstacles and seal management policies. The company is asked to rank several factors (seal and non-seal related) level of significance as an obstacle for
developing their seal business in the coming three years. Some questions include seal
management policies, like seal conservatories. Companies are asked if they currently operate in seal conservatories or in areas where seal hunting occurs. This is an attempt of collecting policy-relevant information to understand if seal conservatories/ seal hunting is an obstacle for their development or beneficial for the industry’s development.
Companies are finally asked what size of the seal populations they believe would improve their business opportunities in effort to address the relationship between the supply of seal tourism and the size of the seal populations and compare if seals population sizes are a significant or irrelevant obstacles in comparison to the other difficulties the company might experience in aspects of seal business development.
3.3 Survey implementation
The online survey was chosen because it was a quick and less time-consuming alternative compared to a paper survey. Email surveys are also less time-consuming for the respondents and would thereby hopefully increases the response rate according to survey-design studies like Dillman (2000). Although respondents would prefer a paper survey, the digital survey was more appropriate in this setting. But it is impossible to tell if the chosen survey format affected the result, it is worth mentioning as a factor to consider if a similar study is made.
3.4 Statistical adaption and response rate
The data is automatically coded and retrieved from Netigate in a Microsoft Office Excel file. The statistical adaptation is computed in Excel as the program provides sufficient features for the statistical adaptation. The total number of responses was 33, but fully completed surveys where only 28, whereof 3 did not offer seal tourism. The response rate is calculated on the total number of complete responders divided by the total number of the original sample, which gives a response rate of 45%. The 25 responses will be used in the result as they are confirmed part of the target population (“answered yes to the control question if they operate seal tourism). The 5 companies that did not complete the survey operated seal tourism but will be excluded as they only answered a few questions.
Assuming that the responses are representative for the entire population, will the responders’ answers be applied and calculated for the entire industry. If assuming the responses are representative of the entire population found in research (62 companies), should the remaining part of the population also experience “drop-offs” in the same extent as the responding share of the population did. This means that the estimated population size of 62 companies must be altered before the answers of the 25 companies can be generalized to the remaining part of the population.
The adjusted population size is calculated by computing the percentage share of drop-offs out of the 33 answers (as these 5 uncompleted surveys answered that they operate seal tourism). That corresponds to 9 % that is applied to the original sample and gives 5.6. Which means that the industry consists of approximately 56 (62-5.6) companies. The answers of the 25 companies can now be generalized to the remaining 56 companies. The answers of the
responding population are generalized to the total population for a total number of employees, total average turnover and revenues generated from seal tourism business. The utilized
response rate is 44 % (25 divided by the new total population of 56 companies).
3.5 Methodology reflections
A hand-picked selected sample based on structured search in different search engines was regarded as the best possible for this setting. But a random selection would have been preferred as the results could then be generalized to the entire population while limiting the risk of selection bias. A random sampling selection process could have been feasible if seal tourism were a larger business and resultantly registered. Then a random sample frame design similar to Paulrud & Waldo (2010) could have been feasible. They create sample frames from registers of SCB and data from Swedish boards of fisheries. Nevertheless, this sampling approach requires a larger and more easily identified target group than seal tourism. When the sample is very limited it is possible to make a complete study of the entire population by selecting the studied population (Wahlin, 2011). It infers that the sampling method is not random and thereby subject to selection bias. In this setting, it means that the research and selection process risk being incomplete because the selection might
systematically be excluding companies. It will ultimately lead to inaccurate conclusions of the industry as the result only reflects the companies with characteristics included in the selection process. Because the sampling selection process assumes that all modern tourism businesses has connections online, the study faces the risk of excluding companies that are not online. It could result in biased and unrepresentative answers of the survey. The likeliness that a company does not operate online can’t be controlled as it doesn’t exist information about them. The risk remains that companies are not included in the sample and therefore is the estimated size and scope from this study potentially underestimated.
Phone calls were made to the respondents that didn’t answer after the final email reminder. Several of the contacted respondents expressed that lack of time was an obstacle for
computing the survey. April is the most stressful time of the year because it’s high season for the archipelago. Several companies have boat related businesses as their main activity. Therefore is likely shortage of time something that several experienced which potentially reduced the response rate. Hence the result could be biased towards companies not experiencing the high season. The risk of poor timing was not considered even though it likely influences the response rate and which companies that participated. If a similar survey is computed it is recommended to consider the timing of the study, as high and low seasons could affect the result.
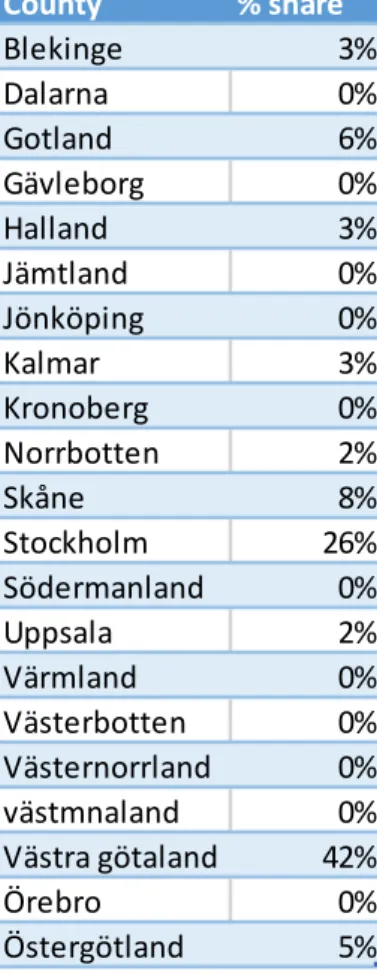
Assuming that the sampling is correct and the entire seal tourism industry is identified in the research, the question remains if the responses are representative of the population. Since this sample is very small and not randomly assigned the response rate is important. I want to limit the risk of non-response bias to avoid decreasing the viability of the result. 44% of responses can be argued as acceptable. The characteristics of the companies in the research are similar to the characteristics of the result from the survey. It implies that the respondents are not different from those who have not answered and therefore not likely systematically biasing the result of the study. The rather high response rate strengthens the viability of the result. Regional similarities can be found between the 25 responders and the entire population (identified in sampling research). See table 1. If the responses are geographically similar to the entire population can the responses arguably be geographically representative. The seal populations’ geographic distribution varies and seals are the largest explanatory factor for seal tourism. Hence, is the companies’ location the most important characteristic in assessing the representativeness of the responses. Consequently, I argue that the responses are fairly representative of the industry but the result is potentially biased due to the timing of the survey and the sampling method.
County % share research % share survey responses
Blekinge 3% 0% Dalarna 0% 0% Gotland 6% 0% Gävleborg 0% 4% Halland 3% 0% Jämtland 0% 0% Jönköping 0% 0% Kalmar 3% 8% Kronoberg 0% 0% Norrbotten 2% 4% Skåne 8% 8% Stockholm 26% 20% Södermanland 0% 0% Uppsala 2% 0% Värmland 0% 0% Västerbotten 0% 0% Västernorrland 0% 0% Västmanland 0% 0% Västra götaland 42% 48%
4 Empirical data
This chapter presents the empirical results of the survey. The size and characteristics of the industry will be presented in 4.1. Followed by 4.2 that presents the answers to the questions regarding the seal’s role for the business. Finally, 4.3 features the result of the companies’ stated obstacles.
4.1 The size and characteristics of the industry
The industry consists of 56 companies. All company managers are men, except for one identified as “other”. The majority corresponding to 58% was above 55 years old. In figure 3 is the regional distribution of the 25 companies displayed. The majority of the companies operated in central and south of Sweden, particularly in Västra Götaland. These areas are also the most populated areas in Sweden (Statistics Sweden, 2019).
The seal tourism industry’s seal related activities employ people corresponding to
approximately 64 full-time jobs (including the owner’s work). In total the seal industry had approximately 25 600 customers (2017), whereof approximately 8200 were foreign tourists corresponding 32 % of the tourists.
The companies charged on average 381 SEK (including VAT)/per person per hour. The market value can be estimated using the companies’ answers about their seal tourism business. Due to the lack of information about the duration of the companies’ seal tourism offers, will a lower and upper limit of the time consumption be assumed when estimating the market values of the services generated from the industry. The shortest offer found is for one hour, and the longest is 4 hours. If assuming all companies’ seal tourists bought 1-hour seal tourism as a lower limit, then the industry in total produced activates with a market value of about 9.15 million SEK. Assuming all seal tourism offers lasts 4 hours, then the total industry produced activities with a market value of 36.6 million SEK.
Aside from the income from seal tourism, the companies had other activities generating revenues. The majority has a total turnover of 100 000-499 000 SEK. The industry’s total turnover in 2017 computed on the averages of the turnover categories is approximately 138.9 million SEK. Information about the percentage of total revenue generated from seal tourism is collected, and the total revenue, for each company individually. Therefore can each
company’s seal tourism revenue be calculated on the average value of the total turnover categories. This is summarized. In total the entire industry had revenues from seal tourism by a total of 9.85 million SEK. It illustrates that the seal related revenues are somewhere between 9.15 and 36.6 million, depending on the calculation method. However, the seal related
revenues also imply that the lower limit of the consumption is likely a more appropriate measure since it’s closer to the more precise estimation of 9.85 million than the higher limit. Nevertheless, the average share of revenues generated from seal tourism activities is 20%. 20 % of the industry’s total turnover is approximately 28.4 million SEK, near the upper limit. The companies were asked, “What alternatives describe your main business the best”. From the answers we can conclude that all companies have some sort of diversification of their activities, no company’s operation is limited to seal tourism (See appendix 5). The most common businesses activity is nature tourism, fishing tourism and “other”. The companies were further asked what kind of seal tourism they offered. The commonly associated form of seal tourism is “seal watching” and “boats” (see appendix 6). Further, are the companies’ founding years required in the survey. The oldest company was started in 1985, which is in comparison to recreational fishing tourism quite young (Paulrud & Waldo, 2010).
Approximately 50% of the companies have provided seal tourism for longer than 10 years. The length of the period offering seal tourism confirms that seal tourism is not a new business or new form of diversification of businesses. Nevertheless, several companies have joined the industry in the recent 4-9 years.
Finally, the companies are asked in what extent they plan to continue their seal tourism business in the following three years. The alternatives are, the same extent, increased extent, decreased extent and don’t know. The majority of the companies plan to continue with seal tourism in the same extent (68%) (See appendix 7). Overall the result suggests an optimistic view of the future of seal tourism.
4.2 The role of the seal
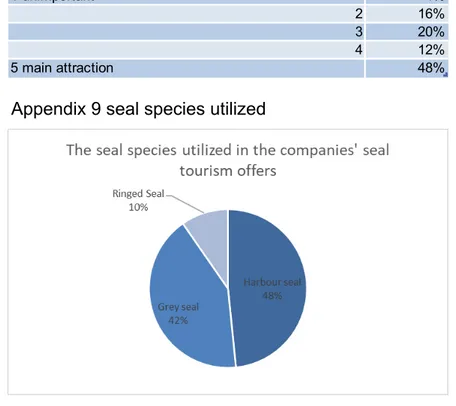
The second part of the survey regards the seal’s role in the company. The company is asked to rate the role of the seal for the entire experience of their seal tourism offer on a scale from 1-5. 1 if the seal is unimportant and 5 if the seals are the main attraction. The seal is regarded as the main attraction by 48% of the companies but the average of the importance of the seal for the experience is 3.84 with a standard deviation of 1.29 (see appendix 8). Overall, the seals can be regarded as important for the total experience of the seal tourism offer.
Further is the companies asked what seal species are used in their seal tourism business. The most common type of seal is harbour seal then grey seal and finally ringed seal (See appendix 9). It corresponds to the seal population sizes and the location of the seal tourism businesses. The companies are then asked what population size they think their own seal tourism business would benefit from. The companies’ preferences of the population sizes are shown in figure 4. From the results it’s shown that the companies preferred seal population size varies amongst the different species of seals. No general statement for all species can be made.
In an attempt to conclude the preferred population sizes are the companies divided into three different geographical subpopulations according to the natural habitat of the seal species and the location of the operating companies. The ringed seal mainly exists in the Gulf of Bothnia. The harbour seal occurs on the west coast and the grey seal lives in the Baltic Sea. Group Baltic Sea includes the counties Gävleborg, Stockholm, Östergötland, and Kalmar. The west coast includes the counties Västra Götaland and Skåne. Only one company operating in the north answered the survey. Consequently can’t their answers be analysed or discussed in a similar approach like the west coast and Baltic Sea companies.
Figure 5 shows the west coasts’ answers. Mainly harbour seals exist there. The answers imply that the current size of the harbour seal population is preferred for the increased business potential of their seal tourism business. 29 % prefer a decreased population size and only 12 % want an increased population.
The distribution of the answers for the subpopulation in the Baltic Sea is shown in figure 6. The preferred size of the grey seal population is the current size, similar to the west coasts’ opinion about harbour seal. 20 % prefer a smaller population and only 10 % of the companies want a larger seal population.
Figur 4. The distribution of preferred sizes of the different seal species populations
Finally, the companies are asked if they operate seal tourism business in seal sanctuaries and areas where seal hunting occurs. The operation in seal sanctuaries are limited, approximately 25 % operate in seal sanctuaries but one-third of the companies experience seal hunting in the areas where they operate seal tourism.
4.3 Obstacles
The final part of the survey includes questions of the companies’ perceived obstacles for developing their seal tourism business in the coming three years. They are asked to rank the obstacles from 1 to 5 where 1 is no obstacle and 5 is a very large obstacle. The companies do not appear to experience any of the factors as large obstacles. All obstacles averages are summarized and their percentage share of very large and no obstacles are presented in table 2. The companies are on average regarding competition as the largest obstacle and supply of watching area.
Table 2. Distribution of the companies experienced obstacles and shares of large and no obstacles.
If the respondent answered that competition with other stakeholders were an obstacle (larger than 1) they were asked to answer an open follow-up question that demands to specify what or which stakeholders compose the largest obstacle. The companies that expressed
competition as an obstacle (>1) answered that the following stakeholders were the largest source of competition; colleagues in the seal tourism industry, varying forms of traffic from boats, sailing boats and canoes, other forms of nature tourism (aquatic and land-based). Comments to the answers of the open questions and comments can be found in appendix 4.
Obstacle Average % share of no obstacle % share of very large obstacle
Workforce 1,68 64% 4% Service 1,72 48% 0% Marketing 2,16 40% 12% Population size 2,2 36% 12% Watching areas 2,28 40% 12% Hunting 1,92 48% 0% Protective areas 2 52% 8% Loan 1,8 60% 8% Competition 2,36 24% 4%
5 Analysis and discussion
In this chapter is the result analysed and discussed. Each of the research topics will be discussed separately and finished with answering the research question. In 5.1 the seal tourism industry is addressed. Chapter 5.2 presents the seal’s role. Lastly, 5.3 addresses the obstacles.
5.1 The seal tourism industry
The result shows that the regional distribution of the industry is mainly concentrated in the counties with high population in the middle and southern part of Sweden. Resultantly is the seal tourism industry’s contribution to regional development and employment not entirely evident. Nevertheless, the industry employs correspondingly 64 full-time jobs. The maritime strategy clearly states the need for increased employment with particular concern for coastal areas. Since the companies operate in the coastal areas should the 64 work opportunities not be neglected. Hence, in the maritime aspect is the seal tourism industry contributing to work opportunities and potentially a more attractive living area as it attracts tourists, which creates demand for services and other businesses. Without attempting to investigate the economic effect of seal tourism, it is likely that it has an economic effect. The effect could be furthers assessed in a similar approach as Grado et al. (2007) that study the aggregated economic sectors that benefit from the hunting of white-tailed deer.
The seal tourism industry has an optimistic view of the future as the majority plans to continue with seal tourism business in same or increased extent. The optimistic view of the future should be considered in light of the strong economy. But the service sector has a split view of the economic future at the time of the survey. One half expressed a negative view of profitability and the other an optimistic view (Konjunkturbarometern april 2019, n.d.). Nevertheless, as only 4% of the companies planned to operate in decreased extent can the overall view arguably be positive.
The age of the industry implies that this is not a current trend but a mature business, which will likely continue to exist. Alternatively, disappear as the business managers retire. The latter argument is supported by the fact that approximately 60% of the business managers are over 55 years, and 20 % are 67 years old. The industry’s optimistic view of the future and the entrances of new companies can be claimed to exceed the argument that the business risk vanishing as the business managers become older. Overall, the results imply that the industry will continue to exist.
Since no companies are exclusively operating seal tourism, it can be argued that similar to other agricultural businesses is seal tourism a good way to diversify the business (Sharply & Vass, 2006). 4 % of the companies operate seal hunting tourism; hence can’t any general conclusion be made of seal hunting tourism. The topic needs further attention since it is possible that not all companies are included in the population because seal hunting is controversial and therefore potentially not included in online marketing.
The lower limit of the companies seal related turnover of 9.85 million SEK appears to be the more appropriate figure out of the different alternatives but the plausibility of the result should be addressed. Assuming that the companies have answered correctly to the questions, and excluding employer social fees, would each employee have on average a yearly salary of approximately 154 000 SEK. In comparison, it is almost 100 000 SEK below the minimum salary in the hotel and restaurant business and it is far from Paulrud & Waldo’s (2010)