Determining Supply Chain Inventory Locations
Through Product Classification
A Case Study of a Sealing Materials Company
Authors: Lizza Castro Villagón & Caleb Rangel Master Program: ILSCM
Thesis credits: 30
Master’s Thesis in Business Administration
Title: Determining Supply Chain Inventory Locations Through Product Classification Authors: Lizza Castro Villagón & Caleb Rangel
Supervisor: Leif-Magnus Jensen Date: May 14, 2012
Subject terms: Product classification, customer segmentation, supplier segmentation, supply chain strategies, inventory management, inventory location, postponement, decoupling point
Abstract
Nowadays firms must develop inventory policies that enable them to cope with the changing mar-ketplace. Determining proper inventory locations can help decrease costs related to inventory hold-ing and transportation. Moreover, this allows firms to respond in a timely manner to customers’ re-quirements. As a result profit margins can be enhanced as well as the competitiveness of a firm. However, the decision of where to locate inventory in a supply chain is difficult since many compa-nies are managed independently.
The present research is developed as a case study where product classification, customer and sup-plier segmentation schemes are reviewed in order to determine appropriate inventory locations along the supply chain.
The thesis is written upon literature and empirical research, where most of the data was collected through personal interviews and observations at the supply chain management offices of a distributor for sealing material parts in Europe.
Our conclusion shows that product classification has an important impact on inventory location de-cisions. Also, we conclude that products should be classified based on both physical characteristics and demand factors, as well as according to customers’ requirements. Another factor to be consid-ered when deciding on inventory location is supply risks, due to issues related to raw material avail-ability and capacity. Nonetheless, the selection of classification variables is challenging as it is hard to determine which factors are more relevant than others as this varies depending on each firms’ needs. In addition, we find that supply chain strategies are not realistic due to the constant changes in the business environment and the inability of a firm to manage whole supply chains. Furthermore, a high level of communication among supply chain partners is fundamental, especially when a central-ized inventory policy and a postponement strategy are in place.
Acknowledgments
We would like to thank our supervisor Leif-Magnus Jensen for his guidance and counseling throughout the duration of this project. Likewise, we want to thank Jonas Karlsson for giving us the opportunity to conduct this study and for offering his support from the very beginning of our thesis. In addition, we express our grat-itude to all those who took part of their valuable time to participate in the interviews. And finally, we want thank our families and friends for their input and motivation.
Lizza Castro & Caleb Rangel May 2012
Table of Contents
1 Introduction ... 1
1.1 Background ... 1 1.2 Problem Discussion ... 1 1.3 Purpose ... 2 1.4 Perspective ... 2 1.5 Delimitations ... 2 1.6 Disposition ... 22 Literature Review ... 3
2.1 Supply Chain Management ... 3
2.2 Customer/Market Segmentation ... 4
2.3 Product Classification ... 4
2.3.1 Product Characteristics... 5
2.3.2 Demand/Market Factors ... 6
2.3.3 Supply/Source Factors ... 7
2.3.4 ABC Analysis: The Pareto Concept ... 8
2.4 Supplier Segmentation ... 9
2.5 Supply Chains Strategies ... 10
2.5.1 Lean Supply Chains ... 11
2.5.2 Agile Supply Chains ... 11
2.5.3 Leagile Supply Chains... 12
2.5.4 Production Strategies ... 12
2.6 Inventory Management ... 13
2.6.1 The Bullwhip Effect ... 13
2.6.2 Supply Chain Coordination Methods ... 14
2.6.3 Supply Chain Inventory Management ... 14
2.6.4 Uncertainty ... 15
2.6.5 Postponement ... 16
2.6.6 Inventory Location: The Decoupling Point ... 17
2.6.7 Speculation ... 18
2.7 Summary... 18
3 Methodology ... 20
3.1 Case Study Research ... 20
3.2 Case Study Design ... 20
3.3 Data Collection ... 21 3.4 Data Analysis ... 22 3.5 Research Credibility ... 23
4 Empirical Findings ... 24
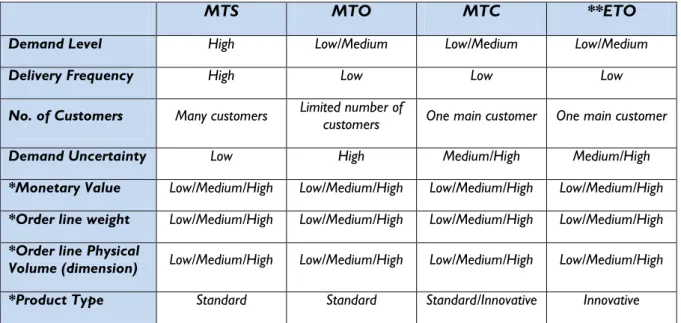
4.1 Company Background ... 24 4.2 Product Classification ... 24 4.2.1 Make-To-Stock (MTS)... 24 4.2.2 Make-To-Order (MTO) ... 25 4.2.3 Make-To-Customer (MTC) ... 254.2.4 Supplier Managed Stock (SMS) ... 26
4.2.5 MTS, MTO and MTC Figures ... 26
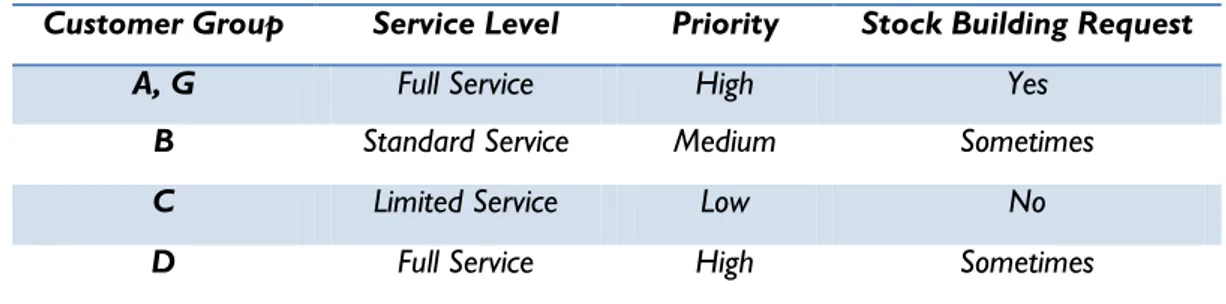
4.3 Customer Classification ... 26 4.4 Sales Companies ... 27 4.4.1 Sales Germany ... 27 4.4.2 Sales Sweden ... 28 4.5 Supplier Segmentation ... 28 4.6 Group Suppliers ... 29 4.7 Inventory Management ... 30
4.8 Lead Times ... 30
4.9 Supply Chain Strategy ... 31
4.10 Supply Chain Coordination ... 31
5 Analysis ... 32
5.1 Product Classification ... 32
5.2 Customer Segmentation ... 33
5.3 Supplier Segmentation ... 34
5.4 Supply Chain Strategy ... 35
5.5 Inventory Management ... 36
5.5.1 Supply Chain Coordination ... 36
5.5.2 Inventory Location ... 36
5.5.3 Postponement vs. Speculation ... 38
5.5.4 Product Classification & Inventory Location Issues ... 38
6 Conclusion... 40
7 Future Research ... 41
References ... 42
Figures ...
Fig. 2.1 ABC Analysis Graph ... 8Fig. 2.2 Kraljic’s Matrix ... 10
Fig. 2.3 Fisher’s Model ... 10
Fig. 2.4 Supply Chain Strategies ... 12
Fig. 2.5 Postponement Strategies & Decoupling Points ... 17
Fig. 4.1 Percentage of Products Sold ... 26
Fig. 4.2 Percentage of Total Stock Value ... 26
Fig. 4.3 Percentage of Sales Turnover according to Customer Type ... 27
Fig. 4.4 Inbound OTD ... 31
Fig. 4.5 Outbound OTD ... 31
Fig. 5.1 Supplier segmentation matrix ... 35
Fig. 5.2 Sealing Materials Business Supply Chain - Supply Chain Approach ... 35
Fig. 5.3 Sealing Materials’ supply chain and inventory location ... 37
Fig. 5.4 Postponement strategies applied at the Sealing Materials business... 37
Tables ...
Tab. 2.1 Seven Principles of SCM ... 3Tab. 2.2 Product Classification Factors – Summary ... 7
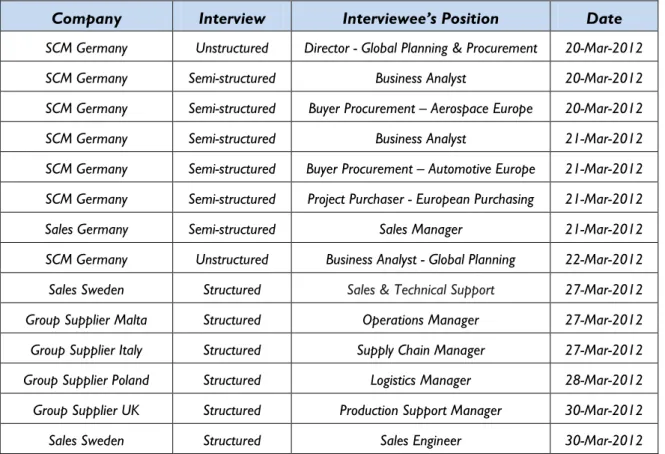
Tab. 3.1 Schedule of Interviews ... 22
Tab. 4.1 MTS Classification Criteria ... 25
Tab. 4.2 MTO Classification Criteria ... 25
Tab. 4.3 MTC Classification Criteria ... 26
Tab. 4.4 Customer groups ... 27
Tab. 5.1 Proposed Product Classification ... 33
Tab. 5.2 Internal Product Classification Proposal ... 39
Appendix A ...
Interview Questions for Sales Companies (Structured) ... 46Interview Questions for Sales Company in Germany (Semi-structured) ... 46
Appendix B ...
Interview Questions for Group Suppliers (Structured) ... 47Appendix C ...
Interview Questions for SCM Germany (Semi-structured) ... 471
Introduction
1.1
Background
In today’s fast-paced, changing business environment, firms struggle to maintain their profitability and remain competitive in the market (Pugh, 2011). Hence, they take cost reduction measures in order to improve their efficiency and to maximize their margins. However, they must be able to achieve a certain degree of responsiveness and flexibility to ensure customer satisfaction. Therefore, it is im-portant that suppliers understand their customer needs in order to provide a better service. This in-cludes having stock strategically located at one or different points along the supply chain, depending on the product or customer requirements for speed in terms of delivery. As a result, firms are re-quired to design different supply chains to meet varying customer demands. Nevertheless, this can represent a challenging task.
Product classification and customer segmentation schemes are important as they help firms to de-termine which supply chain strategies are appropriate for their markets. For instance, customers can be prioritized according to the number of sales they generate annually or simply by their buying be-haviors. On the other hand, some products are more critical in terms of delivery times, manufactur-ing complexity or customization level, while others are more functional. This suggests that firms should ideally establish a set of supply chain strategies in order to satisfy the requirements of specific customers or markets. In some cases strategy is based on cost, while in other circumstances on dif-ferentiation. However, sometimes it is necessary to balance both goals, where efficiency must be balanced against the level of responsiveness desired (Fisher, 1997). Furthermore, supplier segmenta-tion is equally important as it helps firms determine suitable suppliers for their product groups. The level of responsiveness demanded by customers or required to deliver a product will likely de-fine a supply chain inventory strategy, which comprises inventory location. However, the decision of where to locate inventory in the supply chain is a difficult task as most firms operate independently. Every company participates in many supply chains and thus, supply chain strategies differ for each unit. As a result, firms must still deal with supply and demand uncertainty issues due to the complex-ity of supply chain networks. This also implies that companies must still develop their own inventory policies and rely on forecasts. Moreover, given that most companies do not have complete control of their entire supply chains, they are forced to adapt to their current operational settings.
The present research is developed as a case study at the supply chain management (SCM) offices of a sealing materials company located in Germany. Due to confidentiality reasons, we do not reveal the actual name of the company. Therefore, we will refer to the firm as SCM Germany. The sealing ma-terials company belongs to a leading global corporation which provides engineered mama-terials based on polymer technology to protect, damp and seal (Sealing Materials, 2012). SCM Germany manages a major regional distribution center in Germany, where all supply chain management decisions are centralized. In order to capture a complete view of SCM Germany’s supply chain, group suppliers and sales companies were also involved in the research.
The firm’s goals for 2012 are to improve its on-time delivery (OTD) and increase its margins. Due to the company’s complex global supply chain network, it becomes a real challenge to design appro-priate supply chains to achieve these goals. An approach that could enhance timely deliveries and margins is to classify products and segment customers effectively. This classification would help in the selection of strategies to properly locate inventory along the supply chain, and hence allow SCM Germany to respond in a timely manner to its customers’ demands and to manage financial risks.
1.2
Problem Discussion
Most companies segment their markets and classify their products in order to respond to customer demands successfully. One of the ways to react effectively to market requirements is by strategically locating inventory along the supply chain. Normally, the strategies selected may help determine ap-propriate inventory locations. However, in reality supply chains are complex by nature and thus,
firms tend to adopt different strategies as business objectives diverge. As a consequence, companies still have to face supply and demand uncertainties as well as other limitations as their control over the entire supply chain network is restricted. Therefore, the current structure of the supply chain in some way limits inventory locations.
Hence, our interest is to find out answers for the following question:
How to determine appropriate inventory locations according to the current structure of the supply chain?
1.3
Purpose
In order to identify how appropriate inventory locations are determined, we will examine the schemes SCM Germany uses for product classification, customer segmentation and supplier segmen-tation, as we believe these could influence inventory location decisions. By locating inventory at suit-able places along the supply chain, a firm could enhance its competitiveness and profitability as cus-tomers’ demands are fulfilled effectively. Moreover, this could have a positive effect on on-time de-livery performance. Hence, the aim of this study is to illustrate the impact inventory locations have on a firm's ability to maximize customer satisfaction and minimize costs, considering the current supply chain structure. In addition, we want to exemplify the required managerial actions in order to find out appropriate inventory locations.
1.4
Perspective
This research problem is studied from the perspective of the supply chain management division of a firm, which liaises suppliers and sales companies.
1.5
Delimitations
We will mainly conduct our research at the supply chain management offices of SCM Germany. This will provide us with the knowledge on how things are managed in practice and also a perspective about the industry in which the firm operates. This will delimit our research since we will not be able to investigate other companies in different industries due to time constraints and confidentiality issues.
1.6
Disposition
The first chapter –Introduction– provides a background of the topic along with a problem discussion, followed by a research question and the purpose of the thesis. The second chapter –Literature Re-view– outlines the theory behind supply chain management, customer segmentation, product classifi-cation, supplier segmentation, supply chain strategies and inventory management, including post-ponement and inventory location. The relationship between these topics is described as well as its connection with the research question. The third chapter –Methodology– states the study’s structure and the research methods selected. The fourth chapter –Empirical Findings– presents the results from the interviews conducted at the company’s supply chain management offices, together with the data collected from sales companies and group suppliers. In the fifth chapter –Analysis–, the information is analyzed and connected to the literature review. This is followed by the sixth chapter –Conclusion–, where the analysis in regards to the research question found in the first chapter is discussed. The fi-nal chapter presents ideas for future research.
2
Literature Review
In this chapter we will discuss customer and supplier segmentation, product classification, supply chain strategies and inventory management. First, we will start our discussion with a brief overview on supply chain management, where we address the importance of customer orientation. This will be followed by customer segmentation and product classification, where we explore key categoriza-tion factors that help identify the most suitable supply chain strategies for specific customers or products. In addition, we will address the importance of supplier segmentation. This discussion will lead us to a general review on supply chain strategies. Finally, we will cover several points from the inventory management literature, particularly issues related to inventory location. The connection between the different bodies of literature is that product classification, customer segmentation and in part supplier profiles, altogether define supply chain strategies, and in turn supply chain strategies define inventory strategy. We find important to cover all of these topics to better understand the factors influencing supply chain inventory locations. A comprehensive frame of reference is neces-sary to find out to which degree theory matches the reality.
2.1
Supply Chain Management
A supply chain features a network of units that procure raw materials, transform them into a semi-finished state, and finally into semi-finished goods (Huang, Uppal & Shi, 2002). Basically, supply chain man-agement (SCM) features a set of practices which aims at coordinating and controlling the entire sup-ply chain, from raw material suppliers to the ultimate customer. Hence, the overall objective of SCM is to improve the entire process rather than focusing on local optimization of business units (Heikkilä, 2002). Likewise, the goal of SCM for any firm is to generate revenue and increase its mar-ket share. This requires the focal firm, together with its fellow supply chain members, to offer a product to the customer (Childerhouse & Towill, 2000). Thus, we deduce that the primary goal of SCM is customer satisfaction. The success or failure of supply chains is ultimately determined in the marketplace (Agarwal, Shankar & Tiwari, 2006).
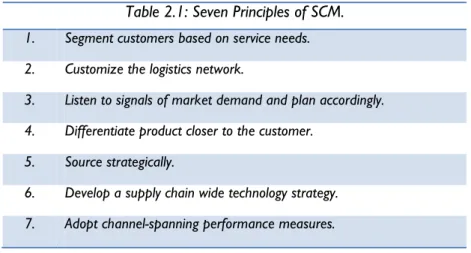
Anderson, Britt and Favre (1997) discuss the seven principles of SCM (Table 2.1), which support the efforts required to balance customer satisfaction with the need for profitable growth. The first four principles highlight the importance of customer orientation by addressing the need for customer segmentation, customized logistics solutions, demand planning and product differentiation. However, companies normally focus on the supply side of the chain and fail to recognize customer demands. This implies that customer segmentation is usually not the starting point for managers to begin their supply chain improvement efforts (Heikkilä, 2002).
Table 2.1: Seven Principles of SCM.
1. Segment customers based on service needs. 2. Customize the logistics network.
3. Listen to signals of market demand and plan accordingly. 4. Differentiate product closer to the customer.
5. Source strategically.
6. Develop a supply chain wide technology strategy. 7. Adopt channel-spanning performance measures.
Kopczak and Johnson (2003) claim that SCM has led to six main shifts in business focus. Among the most outstanding changes is the shift from physical efficiency to market mediation; from supply focus to demand focus; and from mass-market supply to tailored offerings. Once again the importance of customer orientation is emphasized. For instance, market mediation costs have escalated as demand in general is becoming more unstable. As a result, market-responsive supply chain strategies are in-creasingly being adopted. In addition, firms have increased their efforts in mitigating demand uncer-tainty through demand management instruments, such as pricing policies. Moreover, companies have discovered that better business opportunities exist by combining innovative supply chains with new market approaches. Lastly, businesses have realized that customers are not equally profitable and have different preferences (Kopczak & Johnson, 2003).
The literature demonstrates that there is general consensus that companies should focus more on their customer demands rather than on cost minimization and efficiency, as this proves to be a more effective approach to generate profits. This suggests that firms should concentrate their efforts on studying their markets and differentiating the demand for their products. This is possible through customer segmentation and product classification.
2.2
Customer/Market Segmentation
Customer or market segmentation is the process of dividing customers within a market into differ-ent groups where similar requiremdiffer-ents or differences can be iddiffer-entified (McDonald & Dunbar, 1998). Companies follow either a concentration or a multi-segment approach. The concentration approach entails the development of a marketing strategy for a single market segment with the aim to special-ize on one segment. On the other hand, the multi-segment approach involves aiming at various seg-ments with a different strategy for each group (Fridriksson, 2010). Firms should aim for strategic segmentation, an approach that combines customer focus and a high level of organizational integra-tion. Thus, the firm is able to apply customer-based data in order to develop segments of customers and integrate them across key functional activities (McDonald & Dunbar, 1998).
Different bases are suggested to segment consumer markets and industrial markets. Yet, in both cases the common variables include the customer’s background as well as attitudinal and behavioral characteristics. For instance, in industrial markets, the customer can be classified according to indus-try type, company size, location, technical capability, power structures, purchasing policies and prod-uct application. Attitudinal features refer to the purchasing criteria of customers and entails focusing on differences in why customers buy. Behavioral issues relevant to segmenting business markets may include buyers’ personal characteristics and product status and volume. Thus, business goods mar-kets can be segmented by buyer-seller similarity, buyer motivation and buyer risk perceptions. Iden-tifying major purchasers through volume purchased and idenIden-tifying the final use of the product is very useful (Hooley, Piercy & Nicouland, 2012).
2.3
Product Classification
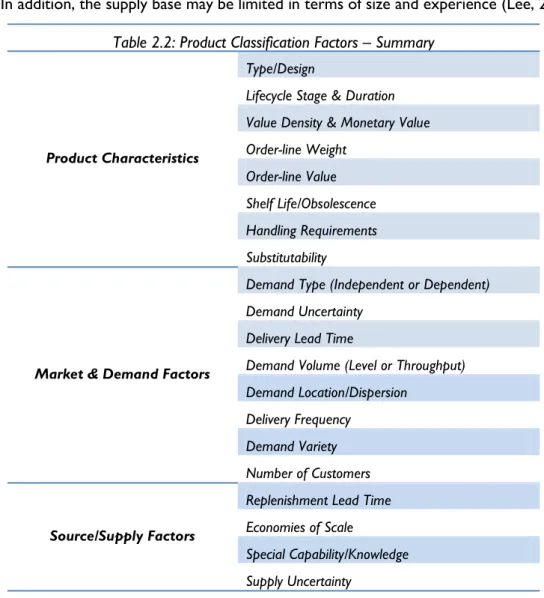
Product classification schemes are essential since they help determine appropriate supply chain strategies. This is required to identify different groupings of products in order to provide appropri-ate customer service (Childerhouse & Towill, 2000). In addition, not all products contribute equally to the profitability of a supply chain. A potential flaw for companies is to focus too much on prod-ucts that do not generate profit (Mentzer, 2004). Likewise, each product has a different risk profile depending upon its market, profile and value. Both supply side and demand side risks exist. Supply side risks vary according to supplier reliability, while demand side risks depend on forecasting errors (Emmett & Granville, 2007). Therefore, product classification serves as a fundamental base to sup-port supply chain strategies including inventory decisions. In general, products are classified based on their specific features including physical characteristics, demand/market factors and supply/source factors.
2.3.1 Product Characteristics
Products are generally categorized by their type or design. They can be functional or innovative, as suggested by Fisher (1997). However, other authors suggest that products can also be classified as hybrid (Huang, Mohit & Shi, 2002). Functional products are usually simple items, with a standard de-sign, long life-cycles and predictable demand patterns. Conversely, innovative products are new products developed by firms to capture new markets. They normally have an uncertain demand and are positioned in the introduction or growth stage of the life-cycle (Huang et al., 2002). Moreover, they often represent a breakthrough in design and command a premium price (Vonderembse, Uppal, Huang & Dismukes, 2006). On the other hand, hybrid products consist of either different combina-tions of standard components or a mix of standard and innovative components (Huang et al., 2002). Another characteristic that differentiates functional products from innovative ones is profit margin contribution, where innovative items normally have significantly higher margins. In addition, function-al products have a lower cost of obsolescence compared to innovative products (Lee, 2002).
Products can be classified according to their stage in the product life cycle. Likewise, the classification can be done by considering the duration of the life cycle (Childerhouse, Aitken & Towill, 2002). The product life cycle is one of the most important factors in product classification. It illustrates unit sales for a specific product category over time and it is divided into four separate stages: introduc-tion, growth, maturity and decline. The shape of the sales curve reflects the belief that a product’s sales begin slowly during the introductory stage, followed by a rapid growth, reaching a peak rela-tively early in a product’s life. During the maturity phase, demand may grow slowly for a long period of time before it begins to decrease. This growth is usually accompanied by changes in competition, strategies and performance. Innovative products become standardized as demand increases and competitors surface (Vonderembse et al., 2006). Pagh and Cooper (1998) address that the focus in the first two stages is mainly on customer service, while cost minimization is preferable in the final two stages.
Another widely recognized factor in product classification is value density, which comprises the prod-uct’s size and weight. Product value density is a main determinant of the level of inventory centraliza-tion. Also, high value density products are normally manufactured at few large-scale factories (Lovell, Saw & Stimson, 2005). Similarly, Pagh and Cooper (1998) address the significance of value in product classification. However, they define it as monetary density, which expresses the ratio between the monetary value of a product and its weight or volume. Products with high monetary density are costly to store but inexpensive to transport. Moreover, Pagh and Cooper (1998) mention that products can be categorized by their value profile, which refers to when and how much a product in-creases in value through its processing along the chain.
On the other hand, Payne and Peters (2004) cluster products according to average order-line value and average order-line weight. An average order-line value refers exclusively to the monetary value of the product. Order-line values have an effect on profitability after considering supply chain costs. Since supply chain costs are activity driven, higher value order-line products can stand a higher amount of activity as the articles are processed along the supply chain, and yet generate a reasonable return. However, low order-line value products would suffer a reduction in profitability if it experi-ences a lot of activity as it passes through the supply chain. In addition, order-line weights have a sig-nificant impact on transport costs (Payne & Peters, 2004).
Other characteristics that are taken into consideration when classifying products include the prod-uct’s shelf life or obsolescence, handling requirements and substitutability. Lee (2002) addresses product obsolescence as one of the key characteristics that differentiate functional and innovative products. Fisher (1997) argues that because innovative items have short life-cycles, the risk of obsolescence is higher. Likewise, Lovell et al. (2005) discuss that products with a short shelf life, that is a high rate of obsolescence, would lend themselves to networks that hold low levels of inventory and use quicker transport modes. In addition, these authors mention that differences in handling characteristics can impact supply chain costs. For instance, differences in the weight of the product or the level of secu-rity of the vehicle can affect the mode selection of transport and lead to network constraints in the
type of operation that can be utilized (Lovell et al., 2005). Lastly, substitutability refers to a firm’s ability to replace a product which is out of stock for another one (Payne & Peters, 2004).
2.3.2 Demand/Market Factors
Emmett and Granville (2007) stress that products must be categorized according to demand behav-ior and suggest that this can be done by distinguishing between independent and dependent demand. Independent demand is that which is independent of all other products, whereas dependent demand is that derived from consumer demand which produces end-use products. Generally, dependant de-mand is more consistent and there is a greater degree of certainty about orders (Emmett & Gran-ville, 2007).
One of the most common variables to classify products is demand uncertainty. Functional items have highly predictable demand patterns whereas innovative items usually have unstable demand (Fisher, 1997). Some authors refer to demand uncertainty as demand predictability (Christopher, Peck & Towill, 2006), while others refer it as demand variability (Childerhouse et al., 2002; Lovell et al., 2005) or demand volatility (Payne & Peters, 2004). Demand uncertainty significantly affects capacity utilization and it increases the risk of obsolescence and lost sales (Childerhouse et al., 2002).
The product’s time window for delivery or delivery lead time reveals the responsiveness requirements placed on the supply chain. For instance, some products required rapid response if they are selling very fast. Also, increasing competitive pressure constantly reduces acceptable response times (Childerhouse et al., 2002). Pagh and Cooper (1998) address delivery time as a significant determi-nant for supply chain strategy, but they refer to it as the average delivery time to customers in pro-portion to the average manufacturing and delivery lead time. Despite the importance of customer lead time due to its impact on profitability, this factor has not been widely considered in product classification schemes.
Product demand volume is another key characteristic in classification systems. Childerhouse et al. (2002) suggest that attention should be given to products that are both high in volume and high in profit because of their significance to the firm. The volume is an indication of the level of demand in terms of quantity. Volume can be accounted in terms of units or pallets, as suggested by Payne and Peters (2004). Other authors refer to demand volume as demand level or throughput. This refers par-ticularly to the amount of products processed within a given time. This attribute is also important as it helps determine the design of the supply chain network and has an effect on decisions concerning transport modes and warehousing. In addition, the concept of classifying products by demand levels is exemplified in the Pareto analysis, which is normally used to optimize inventory policy in relation to throughput level (Lovell et al. 2005). Furthermore, Lovell et al. (2005) also consider demand dis-persion/location as a potential product classification variable, since it can also affect supply chain costs. Another factor in product classification is delivery frequency, referred by Pagh and Cooper (1998) as the average delivery frequency to customers in proportion to the average manufacturing and deliv-ery cycle time. This factor helps differentiate products in terms of how actively they are ordered by customers (Payne & Peters, 2004). This way a company may be able to determine how much to stock for each item by categorizing products as fast-moving or slow-moving articles.
Demand variety is considered as a key classification variable by some authors. Childerhouse et al. (2002) recognize that product variety is more important than ever as nowadays demand chains compete on the basis of added value in relation to color, form or function. Also, they advise firms to evaluate their products continuously as they move through the different stages of the life cycle. Lastly, the number of customers buying the product is a critical factor used to assess the risk of obso-lescence. Hence, if a product is purchased by a small number of customers in a year it can be catego-rized as customized (Payne and Peters, 2004). On the other hand, the classification can be done ac-cording to service expectations (Lovell et al., 2005). However, this label seems too broad and we de-duce that it can be determined by analyzing the different demand features.
2.3.3 Supply/Source Factors
Source factors often act as a constraint to supply chain design. Limitations on raw material availabil-ity imply that all supply chains for a specific product must originate at very few locations (Lovell et al., 2005).
A significant supply factor in product classification is replenishment lead time, or supplier lead time. This is the time it would take the supply chain to respond to an increase in demand if materials had to be sourced or manufactured. If the time is measured in months rather than days, it suggests that the product has a long re-supply lead time (Christopher et al., 2006).
Another important supply factor is economies of scale. For instance, when fixed costs are high, vol-ume becomes critical so it is feasible to manufacture the products at large plants at lower prices (Lovell et al., 2005). Pagh and Cooper (1998) also address economies of scale as a constraint within manufacturing and logistics processes. Moreover, they include special knowledge/capabilities as a fur-ther limitation. This can be related to the level of manufacturing complexity involved. For example, in-novative products will probably require special know-how and manufacturing techniques compared to functional items.
Finally, products can be classified according to supply uncertainty. Lee (2002) categorizes supply char-acteristics into stable and evolving. He explains that a stable supply process is one where the manu-facturing stage has reached maturity and where the supply base is well-established. Conversely, an evolving supply process is where the manufacturing stage is still under development and is constantly changing. In addition, the supply base may be limited in terms of size and experience (Lee, 2002).
Table 2.2: Product Classification Factors – Summary
Product Characteristics
Type/Design
Lifecycle Stage & Duration Value Density & Monetary Value Order-line Weight Order-line Value Shelf Life/Obsolescence Hand Handling Requirements Sub Substitutability
Market & Demand Factors
Demand Type (Independent or Dependent) Demand Uncertainty
Delivery Lead Time
Demand Volume (Level or Throughput)
De Demand Location/Dispersion Delivery Frequency Demand Variety Number of Customers Source/Supply Factors
Replenishment Lead Time Economies of Scale
Special Capability/Knowledge Supply Uncertainty
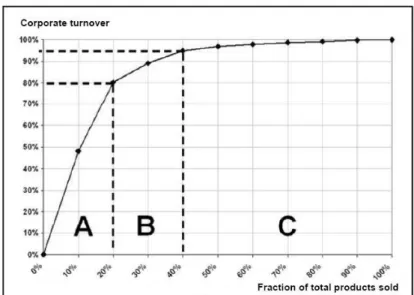
2.3.4 ABC Analysis: The Pareto Concept
A managerial tool to identify products based on importance is ABC analysis (Emmett & Granville, 2007). ABC analysis features a technique to identify categories of stock, thus enabling managers to focus their attention on items that outstand in terms of time and effort (Hines, 2004). This method applies the law developed by Pareto, who recognized that 80 percent of the wealth lay in the hands of 20 percent of the population. This suggests that a high incidence in one set of variables equates to a smaller incidence in a corresponding set of variables (Emmett & Granville, 2007).
The degree of importance can be analyzed based on different ranking factors, such as cash flows, stock-outs, stock-out costs, profitability or sales volume (Coyle, Bardi & Langley, 2003). This implies that ABC analysis can be applied to different supply chain issues (Hines, 2004). In order to perform the classification a ranking factor or criterion must be selected, such as sales revenues. Then, break points are chosen for classes, which are normally categorized as letters (A, B, C and so on). Subse-quently, products are placed in descending order of importance according to the criterion chosen and finally these are placed into discrete classes.
For instance, 80 percent of total sales can be attributed to 20 percent of the items in a particular product line. This example suggests that those products accounting for 80 percent of total sales should receive further attention and classified as “A” items. However, managers should avoid think-ing that “B” or “C” items are less significant than “A” items, and thus avoid neglectthink-ing other product lines. For instance, a decision to assure high in-stock levels for “A” items and limited or no availabil-ity for “B” and “C” items is misleading as all items regardless of their category are important to a certain degree, and each group of items deserves its own strategy to assure availability at a low cost. This notion led firms to differentiate inventory stocking policies by ABC category, making sure that “A” items are available immediately, while other items only available at an upstream location (Coyle et al., 2003).
The same concept can be applied to segment customers. For example, 80 percent of total sales can be attributed to only 20 percent of the customers. This illustration suggests that 20 percent of the customer base should be prioritized and classified as “A” customers (Hines, 2004). Therefore, man-agers should be careful when analyzing their products’ impact on profitability. Figure 2.1 shows the ABC Analysis graph. In this example, 20 percent of the firm’s products account for 80 percent of profits.
Figure 2.1: ABC Analysis Graph.
2.4
Supplier Segmentation
Effective categorization of suppliers is essential in supplier relationship management, a tool to reduce logistics costs (Zhang, Huang, Qian, Xu & Jing, 2006). Supplier categorization involves dividing suppli-ers into groups with different needs, characteristics, or behaviors, requiring different types of inter-firm relationship structures in order to realize value from an exchange (Day, Magnan & Moeller, 2010). Similarly, Guo and Xu (2007) address that supplier categorization determines the level of re-sources to be utilized as well as what expectations are placed on suppliers. The idea is to manage supplier risks and optimize value from exchange. A firm can reduce chances of opportunism under circumstances of information asymmetry by having a better understanding of its position. A driver for supply base management is to decrease the number of suppliers to reduce costs and leverage re-lationships for lower prices. Also, developing close rere-lationships with fewer suppliers can provide access to complementary assets and innovation (Day et al., 2010).
An approach for supplier segmentation is the portfolio matrix. The value of portfolio management results from balancing the expected return from an investment, given the expected level of risk (Day et al., 2010). Some guidelines to categorize suppliers include product growth, market drivers (price vs. technology), length of desired involvement, level of criticality, requirements (standard vs. custom-ized), project types (tactical vs. strategic) and switching costs. Normally, there are four types of sup-pliers: Type I (low value/low risk and convenience sources), type II (high value/low risk and multiples sources), type III (low value/high risk and sole sources), and type IV (high value/high risk and single sources). Likewise, suppliers can be classified as: strategic suppliers, key item suppliers, manage-by-exception suppliers and approved suppliers. Long-term relationships are preferred with strategic suppliers, which are related with Type I. On the other hand, key item suppliers require some in-volvement due to the criticality of the product they provide. These are most likely Type II suppliers. Manage-by-exception suppliers could be any of the four types. In this case it may be necessary to en-gage in a short-term relationship due to a change in the firm’s processes or a problem caused by the supplier. Finally, approved suppliers include those which are not identified as belonging to one of the other categories, but are nonetheless approved by the firm. Minimal resources should be devoted to these types of suppliers (Guo & Xu, 2007).
Zhang, Huang, Qian, Xu and Jing (2006) present a data-driven method to categorize suppliers from the suppliers’ business behaviors. A supplier business behavior refers to a set of product items the supplier has provided in a given time period, the amount of each item in each order, the frequencies of orders, as well as other attributes such as product quality, product arrival time, etc. Dynamic cat-egorization of suppliers based on business behaviors give a clear insight to the business with suppli-ers (Zhang, Huang, Qian, Xu & Jing, 2006).
Product classification also facilitates supplier segmentation, as it enables firms to identify their sources according to the relevance of the product. Kraljic (1983) establishes a model that relates strategies to different classes of purchase. The model features a 2x2 matrix (Figure 2.2) which illus-trates the relation between the importance of purchasing and supply market complexity (Malcolm, 1997). Firms can classify their purchased items in terms of financial impact and supply risk (Kraljic, 1983). For instance, routine items have both low supply risk and low financial impact, thus they are non-critical products. On the other extreme, strategic items have both high supply risk and financial impact.
Figure 2.2: Kraljic’s Matrix. Im po rt an ce of P ur ch asi ng (F ina nc ial Im pac
t) Leverage Items
Strategic Items
Routine Items (non-critical)
Bottleneck Items
Supply Market Complexity (Supply Risk) Source: Kraljic (1983).
2.5
Supply Chain Strategies
A supply chain strategy establishes the nature of procurement of raw materials, transportation, pro-duction and distribution, along with any follow-up services. It specifies whether these processes are performed in-house or outsourced, and the extension to which the operations, distribution and ser-vice functions should do particularly well. Furthermore, a supply chain strategy defines the role played by each supply chain entity and includes decisions regarding information flows, facilities and inventory (Chopra & Meindl, 2001). Lee (2002) suggests that firms should understand the need to customize supply chains to meet customer demands in order to succeed in a highly competitive en-vironment.
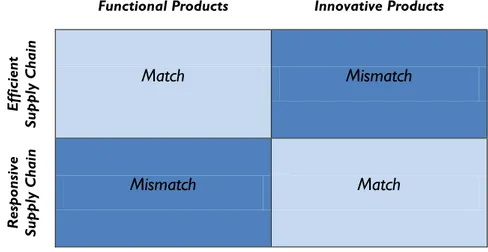
Fisher (1997) argues that functional products should be supplied with responsive supply chains, whereas innovative products should be supplied with efficient supply chains (Figure 2.3). Selldin and Olhager (2007) test the relationship among product design and supply chain design, with reference to the product-supply chain model developed by Fisher. Their data reveal significant relationships be-tween product types and supply chain types. However, they address that there is a limitation to use Fisher's model in practice, as a firm may not always have the resources to create a perfect supply chain for their products. Rather, they are forced to manage within their existing supply chain struc-tures as other members along the chain might dominate the supply chain. As a result, all firms are not able to design the supply chain of their choice (Selldin & Olhager, 2007).
Figure 2.3: Fisher’s Model.
Functional Products Innovative Products
Ef fi ci ent Sup pl y Chai n
Match
Mismatch
R esp onsi ve Sup pl y Chai nMismatch
Match
Source: Fisher (1997).Other researchers have developed frameworks to assist firms in selecting appropriate supply chain strategies, mostly based on different product attributes and demand variables. For instance, Huang et al. (2002) develop a questionnaire to obtain the feedback necessary to match products with desired supply chains. They consider the product’s demand predictability, customer requirements volatility, the duration of the product’s life cycle, special knowledge requirements, and the need for timeliness in product delivery among others. On the other hand, Christopher et al. (2006) develop a taxonomy for supply chain strategy selection, where they stress both supply and demand predictability, and re-plenishment lead times. Similarly, Lee (2002) constructs an uncertainty framework in order to char-acterize a product when seeking to formulate the right supply chain strategy. Both Lee (2002) and Christopher et al. (2006) expand Fisher’s model to include supply uncertainty. Conversely, Vonderembse et al. (2006) develop a framework to categorize supply chains according to product type and stage of the product life cycle. Moreover, Pagh & Cooper (1998) build a “Profile Analysis” to assist managers in selecting appropriate supply chain strategies. Their framework is very compre-hensive as it includes several product attributes as well as demand and manufacturing factors. Fur-thermore, Lovell et al. (2005) develop a framework that highlights the importance of product value density, throughput volume and product availability in selecting a supply chain strategy.
There has been a tendency for these prescriptive models for SC strategy to differentiate by product type. However, some researchers suggest this should change to buying behavior (Godsell, Harrison, Emberson & Storey, 2006). Thus, demand should be stressed over product type. Likewise, these models serve in most cases as managerial guidelines. Some of them are straight-forward, whereas others are more complex yet more inclusive. However, in reality these frameworks are not very practical as they do not take into consideration a firm’s operational capacity and supply chain control limitation, as Selldin and Olhager (2007) suggest in relation to the Fisher model.
The Fisher model has been focused on examining two basic supply chain strategies: Lean, which is the equivalent to Fisher's efficient supply chain, and agile, which corresponds to Fisher's responsive supply chain (Qi, Boyer & Zhao, 2009). There is a body of literature that classifies supply chains into three categories: lean, agile and “leagile”, a hybrid form of lean and agile theories. At both extremes, high product quality levels are required. In addition, the lead time to satisfy consumer demands is important for both lean and agile, but the reasoning differs in each case (Agarwal, Shankar & Tiwari, 2006). Essentially, the difference along the two ends is the variability in demand, and thus, the condi-tions in which they are most applicable (Childerhouse & Towill, 2000).
2.5.1 Lean Supply Chains
The focus of the lean approach is on waste elimination (Naylor et al., 1999). Hence, lean is about do-ing more with less. Lean concepts work well where demand is stable and predictable, as well as where variety is low (Agarwal et al., 2006). In lean supply chains, minimal lead times are required be-cause time is perceived as waste. The lean paradigm’s driving force is cost minimization and outper-formance of competitors on the basis of price in the market (Childerhouse & Towill, 2000). In lean production, the customer simply buys specific products (Mason-Jones, Naylor & Towill, 2000), as there is no requirements to purchase capacity ahead of need. This suggests that the lean paradigm principally fits standardized products. However, despite the presence of lean manufacturing facilities in the supply chain where throughput times are being dramatically reduced, customers would still experience significant delays for delivery of their orders (Fisher, 1997).
2.5.2 Agile Supply Chains
Agility means using market knowledge and a virtual corporation to exploit profitable opportunities in a volatile marketplace (Naylor et al., 1999). Likewise, agility refers to the ability of an organization to respond rapidly to changes in demand in terms of volume and variety. Thus, agility is critical in situa-tions where demand is highly unpredictable (Agarwal et al., 2006). In agile supply chains, minimal lead times are required to be able to service volatile consumer demands promptly and to facilitate the exploitation of new market opportunities. In the face of volatile markets, it is important for an agile supply chain to provide high levels of availability (Childerhouse & Towill, 2000). Hence, in agile
pro-duction, the customer reserves capacity that may additionally need to be made available at very short notice (Mason-Jones et al., 2000), in order to react to changes in demand. This implies that an agile approach suits customized products. Furthermore, the application of information enrichment in agile supply chains is compulsory in order to enable all supply chain members to have a clear under-standing of the actual consumer demand (Childerhouse & Towill, 2000). In addition, agile supply chains must be capable to process a variety of products and achieve different goals with the same fa-cilities, meaning that they must count with an extensive set of abilities that provide productivity, effi-ciency and effectiveness of activities towards the goals of the focal firm (Sharix & Zhang, 1999).
2.5.3 Leagile Supply Chains
Leagile is the combination of lean and agile paradigms within a supply chain strategy, by positioning the decoupling point so as to best suit the need for responding to a volatile demand downstream, yet providing level scheduling upstream from the marketplace (Naylor et al., 1999). The decoupling point is used to buffer the upstream players (suppliers) from the volatile market, allowing the use of lean principles upstream. On the other hand, agile principles are applied for downstream players in order to respond to the volatile customer demand. Hence, leagility features obtaining the best from both worlds in terms of efficiency and responsiveness (Childerhouse & Towill, 2000). In other words, enabling a level schedule upstream the chain allows firms to drive down costs while ensuring an agile approach downstream allows firms to respond to an unpredictable market (Mason-Jones et al., 2000).
Figure 2.4: Supply Chain Strategies.
Source: Mason-Jones et al. (2000).
2.5.4 Production Strategies
According to Langley et al. (2009), there are four production approaches: make-to-stock (MTS), en-gineer-to-order (ETO), assemble-to-order (ATO) and build-to-order (BTO). The volume and prod-uct diversity determine the combination of these manufacturing methods used by firms.
Make-to-Stock (MTS) is the manufacturing method where end-products are completed before the arrival of a customer order. This enables the producers to provide their customers with shorter lead times. Likewise, the manufacturing of goods becomes more cost effective and easier to plan. Consequently, inventory management and accurate forecasting are important factors as the storage of finish products is a rule for MTS (Langley et al., 2009).
Engineer-to-order (ETO) concentrates in creating extremely customized products which require
ex-Supplies Customers Supplies Supplies Customers Customers Lean Processes Agile Processes Lean Agile Lean Supply Agile Supply Leagile Supply Decoupling Point
bled until the customer order arrives. Due to the rareness of the product, lead times might be long (Langley et al., 2009).
Assemble-to-order (ATO) manufacturing starts after an order has been received. The final product is often a mixture of a regular component and customized accessories. Different components may be kept in stock before the arrival of an order, but the end goods are only finished after the receipt of the customer order. Some benefits of this production practice are reduced costs due to econo-mies of scale, lower inventory levels, enhanced response times and decreased complexity for fore-casted items (Langley et al., 2009).
Build-to-order (BTO) or make-to-order (MTO) postpones assembly waiting for the receipt of an order. This approach requires an advanced degree of customization and a lower manufacturing vol-ume. BTO is a good selection for customized products as holding inventory for them may be expen-sive. Subsequently, the benefit of this method is that it manages variety and fulfills customers’ par-ticular needs (Langley et al., 2009).
So far we have illustrated how customer segmentation and product classification, as well as supplier segmentation influence supply chain strategy. The supply chain strategies selected, whether it’s lean, agile or leagile, determine strategies within the areas of production, distribution, information, trans-portation and inventory. However, our interest is to focus on inventory, particularly on issues relat-ed to inventory location.
2.6
Inventory Management
The American Production and Inventory Society (APICS) describes inventory management as the section in charge of controlling and planning inventories. Inventory management handles the product flow in a supply chain and its purpose is to provide the desired service level of product availability to customers at reasonable costs. Consequently, the cost of inventory for an item is the total inventory costs of all members in the supply chain. Therefore, the role of inventory is to act as a buffer pro-tecting and smoothing the effects of forecast errors, demand fluctuations and supply errors (Toomey, 2000).
Firms form part of many supply chains. Hence, supply chain strategies are different for each industry sector and depend on the type of business and on the products’ characteristics. This often involves a complex network and different inventory policies. In order to optimize the levels of inventory in a supply chain, the flows of information and goods must be coordinated (Emmert & Granville, 2007). Thus, local objectives must be aligned with the rest of the supply chain to prevent them from con-flicting with each other. Otherwise, they will lead to the sub-optimization of the whole supply chain performance. Moreover, the lack of coordination in inventory management along the supply chain causes the bullwhip effect (Giannoccaro, Pontrandolfo, & Scozzi, 2002).
2.6.1 The Bullwhip Effect
This is defined as the demand variability amplification which moves in direction of the upstream lev-els in the uncoordinated supply chain (Giannoccaro et al., 2002). The distortion of the demand in-formation has serious cost implications for the suppliers (Lee et al., 2004). According to Lee et al. (2004), there are four causes to the bullwhip effect: Demand signal processing, the rationing game, or-der batching and price variations.
Demand Signal Processing: The demand that is perceived at the retailer is transferred to the supplier in an amplified way. The retailer handles the demand indications, but the initial sales information is misleading and its variance intensifies as it is passed to the supplier. Additionally, long lead times from suppliers tend to worsen the distortion even more (Lee et al., 2004). Even if the forecast is ac-curate, delays in receiving orders from the customers and not knowing how fast their demand can be fulfilled may influence the retailers’ decision to order unnecessary amount of products to prevent shortage (Levy & Weitz, 2009).
The Rationing Game: Uncertainty or capacity limitation in production, contribute for a shortage situa-tion in which the manufacturers might have to rasitua-tionalize the supply of items to satisfy their custom-ers’ demand. In an attempt to secure more items, each customer places an order which surpasses the amount they normally order if there was no risk for shortage (Lee et al., 2004). Thus, this over-reaction to shortage makes the suppliers to manufacture and ship more products than the customer really needs (Levy & Weitz, 2009).
Order Batching: This occurs when the customer places an order for the same amount as in the previ-ous review cycle’s demand. There may be different ordering patterns with different variances, such as seasonal orders and random orders that contribute to the variability of demand. Also, instead of creating several small orders, the customers wait to place a larger order to diminish transportation costs. Likewise, they might be able to take advantage of discounts due to the quantities being pur-chased (Levy & Weitz, 2009). Hence, batching at the customer level amplifies the demand variability for the upstream level of the supply chain (Lee et al., 2004).
Price Variations: The price fluctuations that the customer experiences contribute to stock building as the suppliers have a high-low pricing practice. The customers may increase the amount of items pur-chased if there are discounts involved buying more products than they really need (Lee et al., 2004).
2.6.2 Supply Chain Coordination Methods
Suppliers, customers and retailers have realized that working together helps decrease the effects of the bullwhip effect and the level of inventory in the supply chain. According to Levy & Weitz (2009), there are four methods to coordinate the level of supply chain activities: Electronic Data Interchange (EDI), information sharing, Vendor-Managed Inventory (VMI) and Collaborative Planning, Forecasting & Re-plenishment (CPFR).
Electronic Data Interchange (EDI) enables time reduction for placing orders, receiving them and com-municating delivery information related to these orders (Levy & Weitz, 2009). Therefore, the ap-propriate use of EDI improves the information flows along the supply chain.
Information sharing: Unnecessary inventory is built due to the lack of knowledge of what happens at different points in the supply chain. Suppliers may not know what customers need. Hence, by sharing sales information, suppliers are able to improve efficiency in their production and reduce unneces-sary backup inventory (Levy & Weitz, 2009).
Vendor-Managed Inventory (VMI) is an inventory system that allows supply chains to increase their effi-ciency. The supplier looks after the customer’s inventory levels and once they reach the minimum point, the supplier creates an order and delivers the products to replenish inventory (Langley et al., 2009). One type of VMI is consignment stock. This occurs when the suppliers own the stock until the customer sells it. The customer only pays for the products when they are sold (Levy & Weitz, 2009). Collaborative Planning, Forecasting & Replenishment (CPFR) takes place when different actors in the sup-ply chain cooperate with each other sharing information, forecasts and planning in order to enhance efficiency and product fulfillment. CPFR is a more advanced practice of VMI, since it comprises re-vealing proprietary information, such as business strategies and new product developments (Levy & Weitz, 2009). Moreover, CPFR stresses the significance of data sharing between the different mem-bers in the supply chain (Langley et al., 2009).
Although the approaches explained above help reduce the levels of inventory, there is still a need for an integrated method that controls the inventory in the entire supply chain.
2.6.3 Supply Chain Inventory Management
Supply Chain Inventory Management (SCIM) is an integrated method to control and plan inventory throughout the supply chain. The focus is on the end-customer’s demand, as it aims to improve the customer service decreasing costs and increasing product variety (Giannoccaro et al., 2002). SCIM policies can be classified by optimization goals, control type, inventory control frequency, temporal
infor-Optimization Goal: Inventory policies can have global or local objectives. Local inventory policies are established by each actor in the supply chain on its own based on local performance, while global in-ventory policy decisions are made to optimize the global performance of the supply chain. Neverthe-less, every actor’s goal can be aligned to the supply chain by developing incentive systems such as quantity discounts and transfer pricing schemes (Giannoccaro et al., 2002). Hence, optimization in-struments and goals enable supply chains to find solutions to its problems (Langley et al., 2009). Control Type: Two different strategies can be applied for managing supply chain inventory, namely centralized and decentralized inventory management. A centralized policy tends to minimize the whole supply chain costs, but this requires a high degree of communication between the actors in the supply chain. On the contrary, a decentralized policy monitors inventory locally (Giannoccaro et al., 2002). For instance, a firm may opt for a dispersed stock model, where finished goods are held in many distribution centers, or for a central stock model, where goods are held in one main distribu-tion center. In addidistribu-tion, finished goods may be shipped directly to customers from the factory (Payne & Peters, 2004).
Inventory Control Frequency: A periodic-review control occurs when the inventory level is reviewed on a continuous time interval at every stage. A continuous-review control requires that a replenishment order is issued when the inventory level falls below the predetermined level. A hybrid-review con-trol uses both periodic and continuous-review concon-trols (Giannoccaro et al., 2002). Thus, inventory control enhances appropriate inventory levels and inventory precision (Langley et al., 2009).
Temporal Information Requirements: This describes whether inventory planning should adopt a proac-tive approach or a reacproac-tive approach. A proacproac-tive approach necessitates future demand information in form of forecast or customer orders. A proactive approach necessitates future demand infor-mation in form of forecast or customer orders, while a reactive approach is based on the actual con-sumption of stock (Giannoccaro et al., 2002).
Spatial Information Requirements: These are characterized by the way inventory position in the supply chain is measured. Inventory can be handled locally or in different locations in the supply chain (Giannoccaro et al., 2002).
In order to achieve an integrated control and planning of inventory, firms must differentiate the fac-tors that can affect the wellbeing of the whole supply chain. One of them is the degree of uncertain-ty present in each supply chain.
2.6.4 Uncertainty
Inventory exists as insurance against the uncertainty that comprises the suppliers’ performance, the trustworthiness of the manufacturing process, the changing of customers’ desires and transportation processes. In order to control uncertainty, a firm must understand the impact of the different sources of uncertainty along the supply chain and try to reduce the impact they have (Davis, 1993). According to Davis (1993), there are three causes of uncertainty in the supply chain: customers, sup-pliers and manufacturers.
Customers’ Demand: This is the main cause of uncertainty in supply chains. Irregular purchase orders may occur depending on the factory’s location, unexpected demand from other customers and the fulfillment of inventory orders. These irregular orders increase the level of uncertainty in the supply chain due to their variability, which makes it difficult for suppliers to have the required stock level. The average demand and its variability help managers to set inventory goals according to customers’ needs (Davis, 1993).
Suppliers’ Performance: Many unforeseen events can occur such as longer lead times than quoted from other suppliers, force majeure incidents and machinery breakdowns. The suppliers’ on-time delivery, incongruence or late deliveries can be registered throughout time. This data can help characterize each supplier and determine the stock that must be held in order to avoid shortages (Davis, 1993). Manufacturers’ Performance: Examples of variability in the manufacturing process include a new order with high priority transmitted to the factory, a machinery breakdown or a computer failure.
Measur-ing the entire process performance usMeasur-ing key metrics, such as frequency of downtime, repair time and variation of repair time, can help managers to find out the reliability in their production and to take appropriate actions to improve customer service (Davis, 1993).
The three major causes of uncertainty addressed by Davis (1993) still remain important in inventory management. Nonetheless, in recent studies, authors mention product uncertainty as a significant source of uncertainty in the supply chains. As previously mentioned, product uncertainty represents the demand uncertainty that is connected to the predictability of the items’ demand (Lee, 2002). Given that uncertainty is present in all supply chains, strategies must address it. A natural strategic response to uncertainty is postponement (Boone, Craighead & Hanna, 2007).
2.6.5 Postponement
Postponement represents the concept of delaying activities in the supply chain until a demand has been recognized (Boone et al., 2007). The logic behind this concept is that uncertainty costs and risks are connected to the differentiation of items which occurs during production (time, place and form) and logistics operations (Pagh & Cooper, 1998). Authors propose that postponement can de-crease the costs of inventory, transportation, storage and obsolescence while increasing the respon-siveness of the supply chain (Boone et al., 2007).
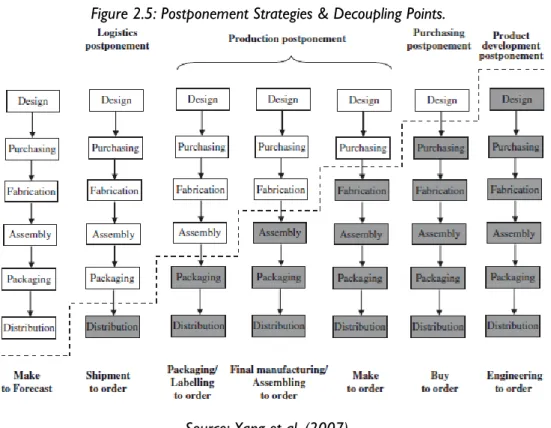
The level of postponement is defined by the type of product the supply chain carries and by the cus-tomers’ needs. This dictates the appropriate supply chain strategies since postponed activities might be placed closer to the time and place of consumption (Yang et al., 2007).
A major principle of postponement is to gather actual information to describe and interpret custom-ers’ requirements into a specific service or item (Yang et al., 2007). This decreases inventory in the supply chain and at the same time enhances the response time to customers (Yang et al., 2004). Ac-cording to the condition of the inventory, four categories of postponement are suggested: Logistics postponement, production postponement, purchasing postponement and production development postpone-ment (Yang et al., 2007).
Logistics postponement pursues delay opportunities that concern finish goods such as postponing in-ventory location to the suppliers until customer demand has been received (Yang et al., 2007). However, sometimes postponement in logistics needs express deliveries, which increases transpor-tations costs. Therefore, the greatest advantage of using this approach is when a product needs to be tailored before delivery (Yang et al., 2004), such as single packaging.
Production Postponement (Work-In-Process): Semi-finished items can be maintained undifferentiated as long as the demand allows it. This enables the firm to be more flexible to satisfy the variations in customers’ needs. By maintaining undifferentiated inventory, firms can decrease supply chain costs (Yang et al., 2007) as it is possible to reduce obsolete inventory (Yang et al., 2004).
Purchasing Postponement: The purchase of raw materials or parts can be delayed until the receipt of an order. Thus, obsolete stock risk is minimized as firms are prevented from building unnecessary inventory. Vendor-managed inventory (VMI) practices can be applied at the same time as purchasing postponement (Yang et al., 2007).
Product Development Postponement: High risk projects with long lead time usually get more assets as-signed while low risk sub-projects can be postponed so that every part of the project occurs simul-taneously. In order to decrease integration risks, low risks sub-projects must consider the latest in-formation of high risk projects, customers, manufacturers and other members of the supply chain (Yang et al., 2007).
Postponement facilitates actions to be performed on real time and real market demand. Therefore, it is essential to collaborate along the supply chain in order to implement postponement. For in-stance, purchasing and production postponement should be used to decrease inventory levels along the whole supply chain instead of shifting inventory responsibilities to lower levels. The downstream members of the supply chain must be aware of the potential order fulfillment difficulties in the
up-placing an order at an early phase. On the other hand, suppliers may not have the possibility to plan manufacturing and logistics, thus decreasing the performance of the entire supply chain (Yang et al., 2007).
Postponement might provide the strategy of using a centralized approach in the upstream parts of the supply chain and a decentralized approach in the downstream parts of the supply chain. Defining a proper level of postponement relies on the customers’ needs and on the capacities of the firm. Moreover, postponement may be intended as a substitute for additional inventory investment (Yang et al., 2007).
The following figure describes postponement strategies and suggests the decoupling point to be based on the type of product the supply chain carries. The level of postponement can be connected to the choice of customer order decoupling point. For instance, the manufacturing method of engi-neering to order (ETO) entails a full postponement strategy. The dotted line in the figure reveals where in the supply chain the customers’ demand is registered. This differentiates order controlled and forecast activities (Yang et al., 2007).
Figure 2.5: Postponement Strategies & Decoupling Points.
Source: Yang et al. (2007).
2.6.6 Inventory Location: The Decoupling Point
The customer order decoupling point (CODP), or order penetration point (OPP), delimits the point in the supply chain where an item is connected to a customer order. The OPP is the last place in the supply chain where inventory is maintained. Likewise, the location of the OPP is determined by the product strategy adopted by the firm, such as make-to-stock (forecast driven), make-to-order (or-der driven), assemble-to-or(or-der (ATO) and engineer-to-or(or-der. The market, items and manufacturing aspects also affect the location of the OPP and its shifting along the supply chain (Olhager, 2003). The OPP separates the manufacturing phases that are forecast controlled in the upstream level from the customer controlled phases in the downstream level (Olhager, 2003). Both information and ma-terial flows have their decoupling point. Hence, differentiating and placing strategically the OPP for both flows enhances the supply chain performance. Also, postponement theory can be applied when handling the material flow penetration point. The strategic location of the material penetration point